

Integrating network pharmacology with experimental validation to investigate the mechanism of Wuwei Zishen formula in improving perimenopausal syndrome
- PMID: 39006282
- PMCID: PMC11236650
- DOI: 10.62347/RQHY5963
Integrating network pharmacology with experimental validation to investigate the mechanism of Wuwei Zishen formula in improving perimenopausal syndrome
Abstract
Objectives: To investigate the role of the Wuwei Zishen formula (WWZSF) in treating and preventing perimenopausal syndrome (PMS) and to understand its mechanism.
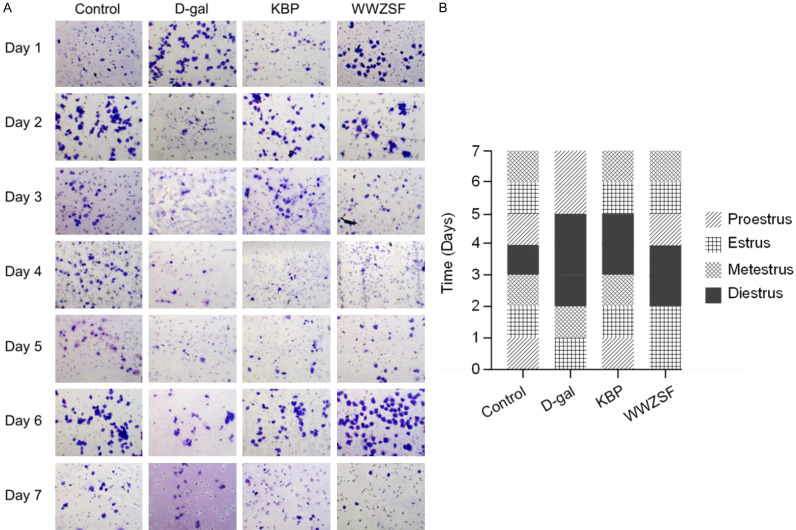
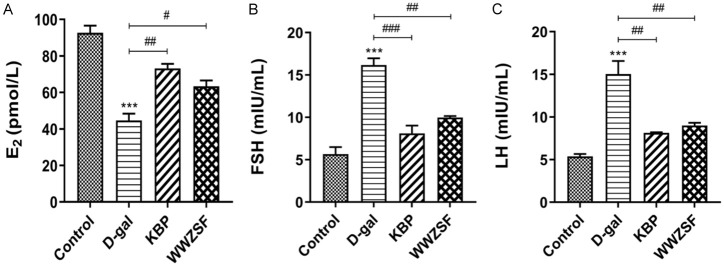
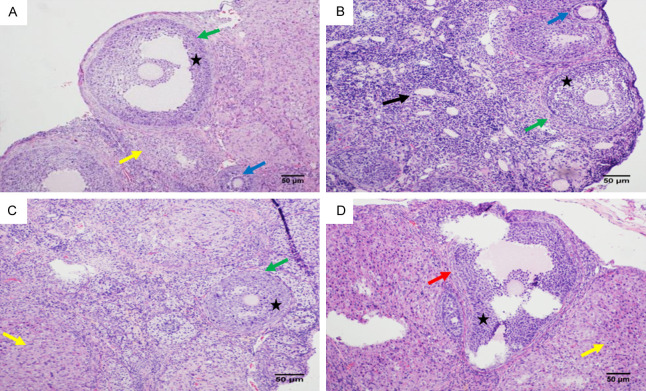
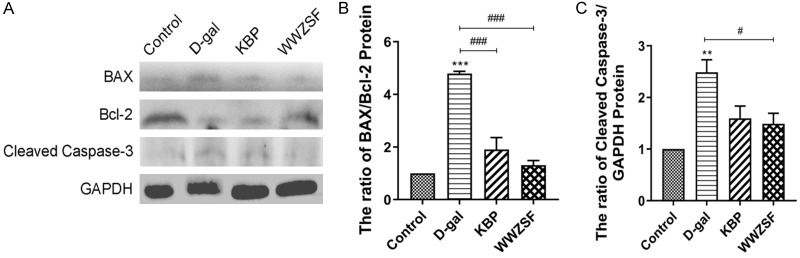
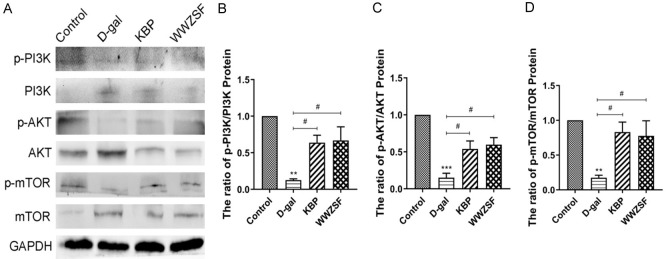
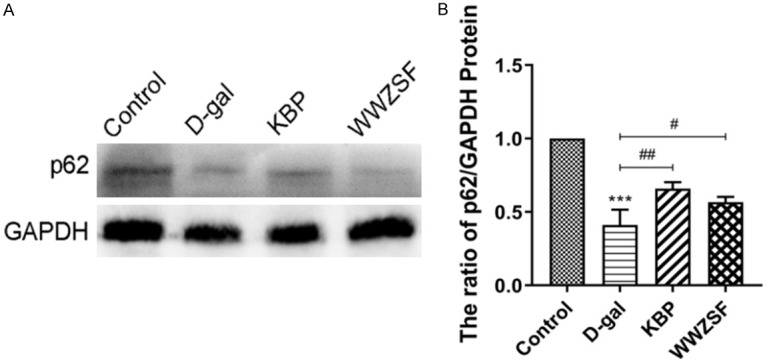
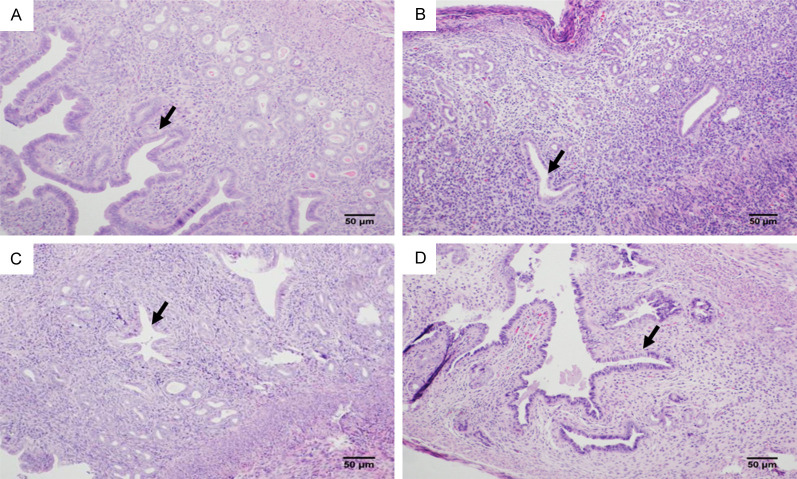
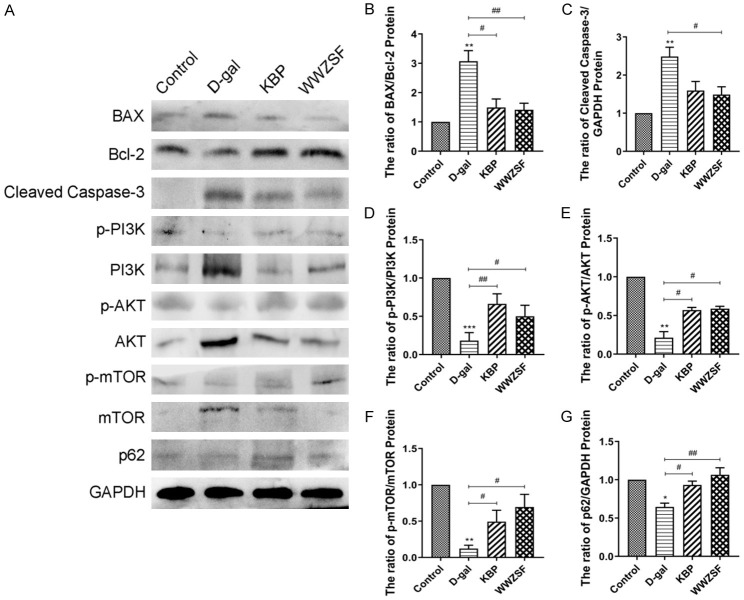
Methods: Network pharmacology and molecular docking was used to predict active compounds, potential targets, and pathways for PMS treatment using WWZSF. Female Sprague-Dawley (SD) rats were induced with D-galactose (D-gal) to establish a PMS model and treated with Kunbao pill (KBP) and WWZSF. Estrus cycles were observed using vaginal smears. Serum sex hormones were measured using the enzyme-linked immunosorbent assay (ELISA). Histological changes in the uterus and ovaries were evaluated using hematoxylin-eosin staining (HE). Western blot was used to assess the protein expression levels of Cleaved Caspase-3, p62, BAX/Bcl-2, p-PI3K/PI3K, p-AKT/AKT, and p-mTOR/mTOR in the uterus and ovaries.
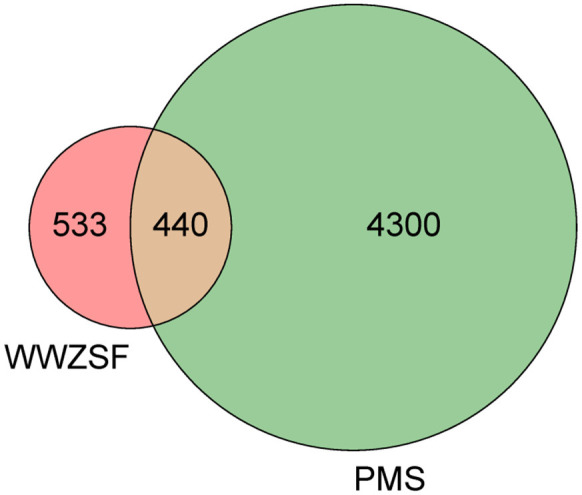
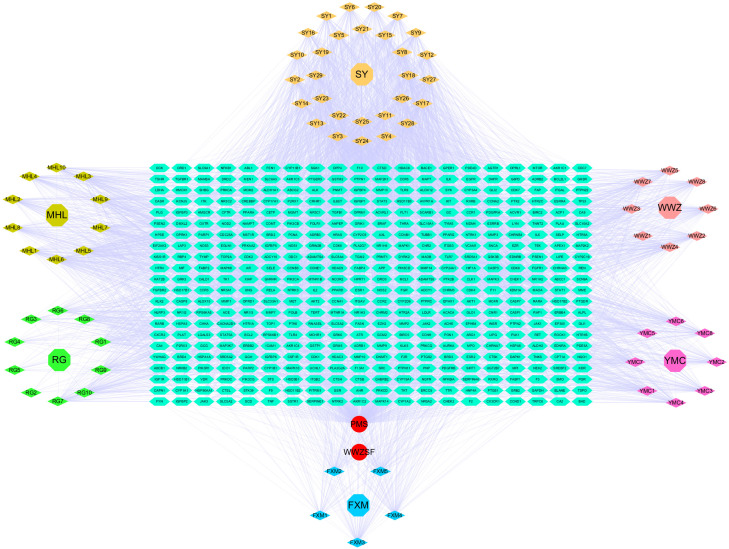
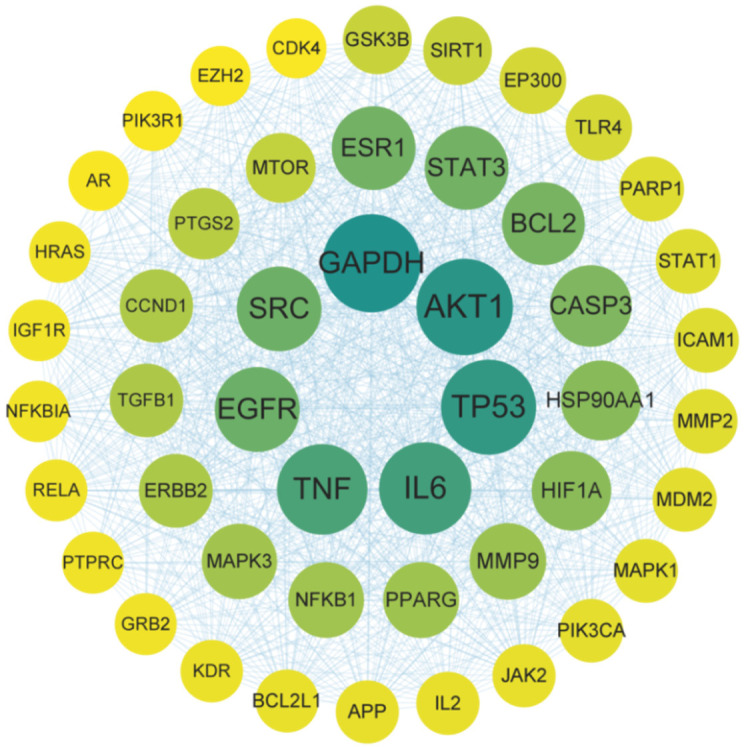
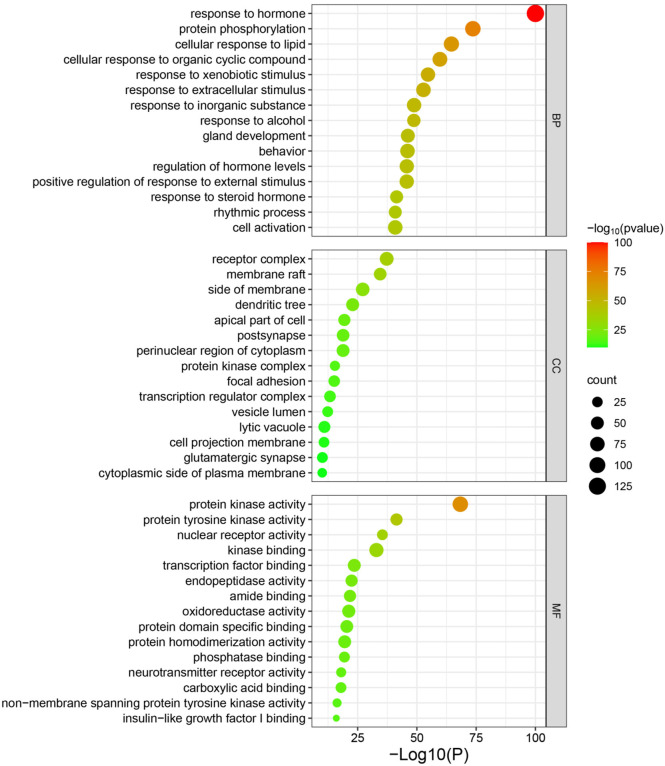
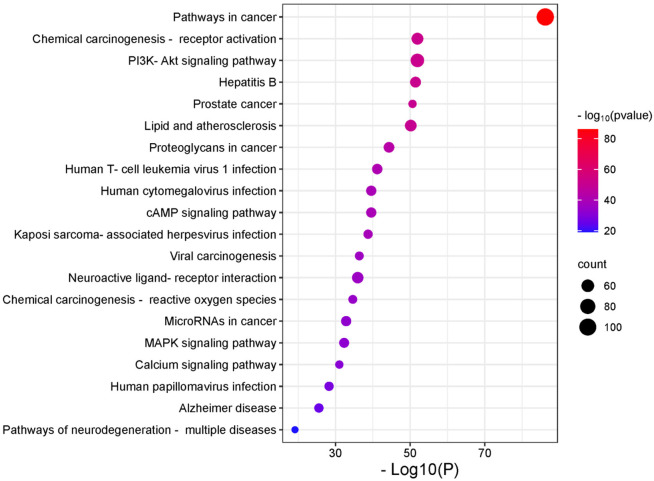
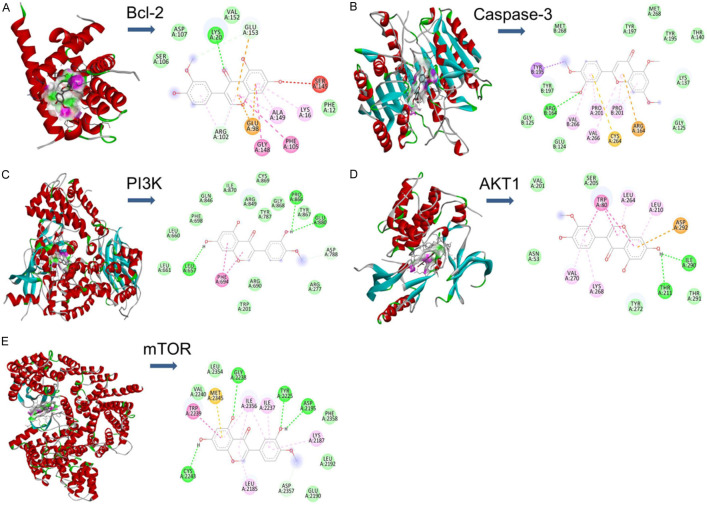
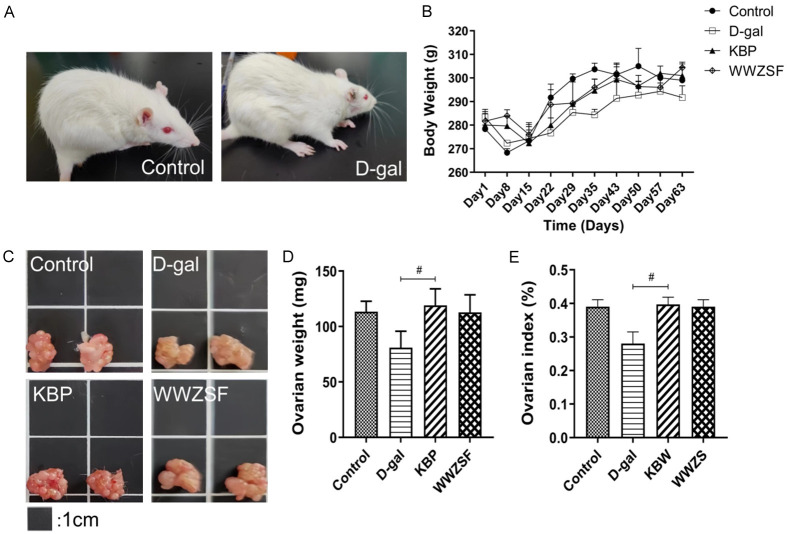
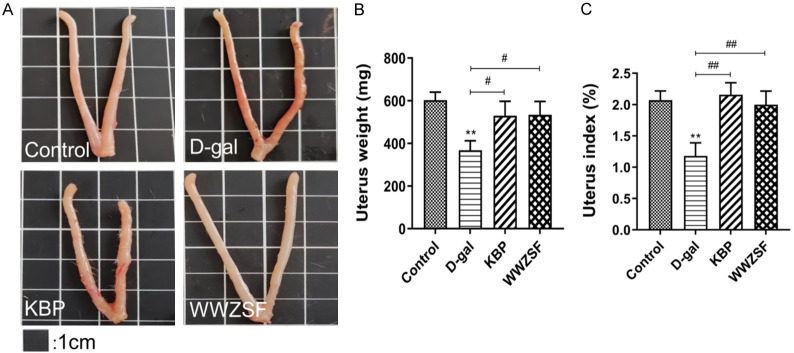
Results: A total of 70 active compounds and 440 potential targets were screened out. Important targets and pathways, including AKT1, Bcl-2, Caspase-3, mTOR, and the PI3K/AKT/mTOR pathways, and molecular docking verified their high affinities to key WWZSF components. In vivo experiments showed that WWZSF can ameliorate the morphological abnormalities of the uterus and ovaries, increase sex hormone levels and organ index, and restore the estrus cycles in PMS rats. Moreover, the western blot results showed decreased Cleaved Caspase-3 and BAX/Bcl-2 protein levels in the ovarian and uterine tissues after WWZSF therapy. Concurrently, there was an increase in the expression of p62 and the ratios of p-AKT/AKT, p-mTOR/mTOR, and p-PI3K/PI3K.
Conclusion: The PI3K/AKT/mTOR signaling pathway-mediated apoptosis and autophagy pathways may be how WWZSF efficiently reduces PMS.
Keywords: D-galactose; Network pharmacology; PI3K/AKT/mTOR signaling pathway; molecular docking; perimenopausal syndrome.
AJTR Copyright © 2024.
Conflict of interest statement
None.
Figures
Similar articles
-
A network pharmacology approach and experimental validation to investigate the anticancer mechanism and potential active targets of ethanol extract of Wei-Tong-Xin against colorectal cancer through induction of apoptosis via PI3K/AKT signaling pathway.J Ethnopharmacol. 2023 Mar 1;303:115933. doi: 10.1016/j.jep.2022.115933. Epub 2022 Nov 18. J Ethnopharmacol. 2023. PMID: 36403742
-
Guizhi Fuling Wan reduces autophagy of granulosa cell in rats with polycystic ovary syndrome via restoring the PI3K/AKT/mTOR signaling pathway.J Ethnopharmacol. 2021 Apr 24;270:113821. doi: 10.1016/j.jep.2021.113821. Epub 2021 Jan 16. J Ethnopharmacol. 2021. PMID: 33460753
-
Dingkun Pill replenishes diminished ovarian reserve through the PI3K/AKT/mTOR signaling pathway in TWP-induced mice.J Ethnopharmacol. 2020 Nov 15;262:112993. doi: 10.1016/j.jep.2020.112993. Epub 2020 May 28. J Ethnopharmacol. 2020. PMID: 32473368
-
Investigation of Tongqiao Huashuan Granules' effect on hippocampal neuron autophagy in vascular dementia rats via the PI3K/Akt-mTOR signaling pathway using network pharmacology and experimental validation.Front Neurol. 2025 Mar 21;16:1555411. doi: 10.3389/fneur.2025.1555411. eCollection 2025. Front Neurol. 2025. PMID: 40191596 Free PMC article.
-
Xuebijing injection protects against sepsis-induced myocardial injury by regulating apoptosis and autophagy via mediation of PI3K/AKT/mTOR signaling pathway in rats.Aging (Albany NY). 2023 May 22;15(10):4374-4390. doi: 10.18632/aging.204740. Epub 2023 May 22. Aging (Albany NY). 2023. PMID: 37219401 Free PMC article.
References
-
- Sourouni M, Zangger M, Honermann L, Foth D, Stute P. Assessment of the climacteric syndrome: a narrative review. Arch Gynecol Obstet. 2021;304:855–862. - PubMed
-
- Voedisch AJ, Dunsmoor-Su R, Kasirsky J. Menopause: a global perspective and clinical guide for practice. Clin Obstet Gynecol. 2021;64:528–554. - PubMed
-
- Pan M, Pan X, Zhou J, Wang J, Qi Q, Wang L. Update on hormone therapy for the management of postmenopausal women. Biosci Trends. 2022;16:46–57. - PubMed
LinkOut - more resources
Full Text Sources
Research Materials
Miscellaneous