

Bayesian Modeling with Spatial Curvature Processes
- PMID: 39006311
- PMCID: PMC11238907
- DOI: 10.1080/01621459.2023.2177166
Bayesian Modeling with Spatial Curvature Processes
Abstract
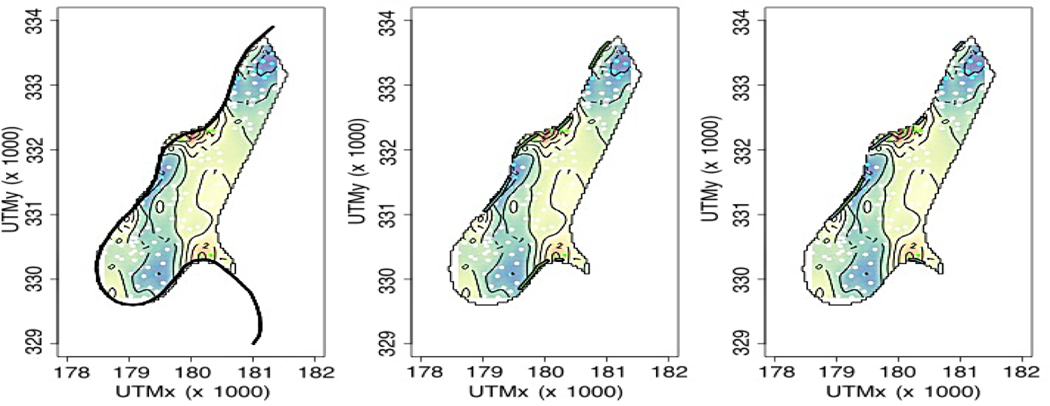
Spatial process models are widely used for modeling point-referenced variables arising from diverse scientific domains. Analyzing the resulting random surface provides deeper insights into the nature of latent dependence within the studied response. We develop Bayesian modeling and inference for rapid changes on the response surface to assess directional curvature along a given trajectory. Such trajectories or curves of rapid change, often referred to as wombling boundaries, occur in geographic space in the form of rivers in a flood plain, roads, mountains or plateaus or other topographic features leading to high gradients on the response surface. We demonstrate fully model based Bayesian inference on directional curvature processes to analyze differential behavior in responses along wombling boundaries. We illustrate our methodology with a number of simulated experiments followed by multiple applications featuring the Boston Housing data; Meuse river data; and temperature data from the Northeastern United States.
Keywords: Bayesian modeling; Directional Curvature; Gaussian Processes; Wombling.
Figures


References
-
- Abramowitz M, Stegun IA & Romer RH (1988), ‘Handbook Of Mathematical Functions With Formulas, Graphs, and Mathematical Tables; ’.
-
- Adler RJ (1981), The Geometry Of Random Fields, SIAM.
-
- Banerjee S, Carlin BP & Gelfand AE (2014), Hierarchical Modeling And Analysis For Spatial Data, CRC press.
-
- Banerjee S. & Gelfand A. (2003), ‘On Smoothness Properties Of Spatial Processes’, Journal of Multivariate Analysis 84(1), 85–100.
Grants and funding
LinkOut - more resources
Full Text Sources