. 2024 Apr 2;4(4):100279.
doi: 10.1016/j.xjidi.2024.100279. eCollection 2024 Jul.

Atopic Dermatitis Complicated by Recurrent Eczema Herpeticum Is Characterized by Multiple, Concurrent Epidermal Inflammatory Endotypes

Affiliations

Atopic Dermatitis Complicated by Recurrent Eczema Herpeticum Is Characterized by Multiple, Concurrent Epidermal Inflammatory Endotypes

Nathan D Jackson et al. JID Innov. .

Abstract

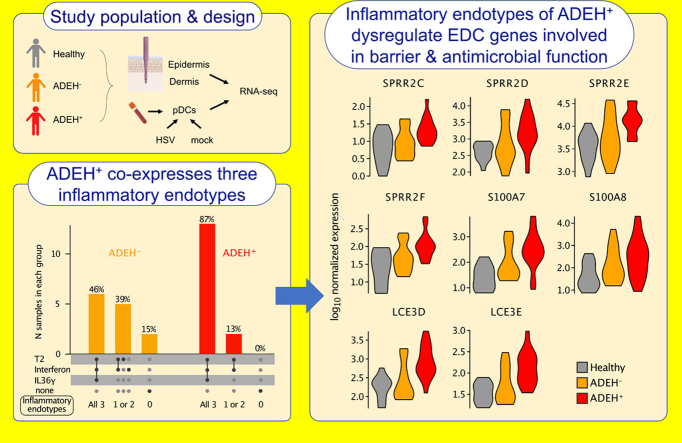
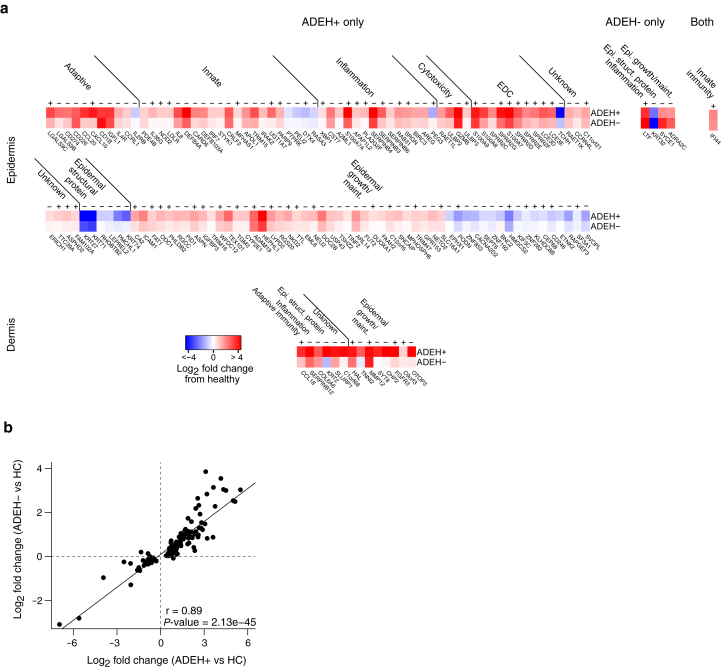
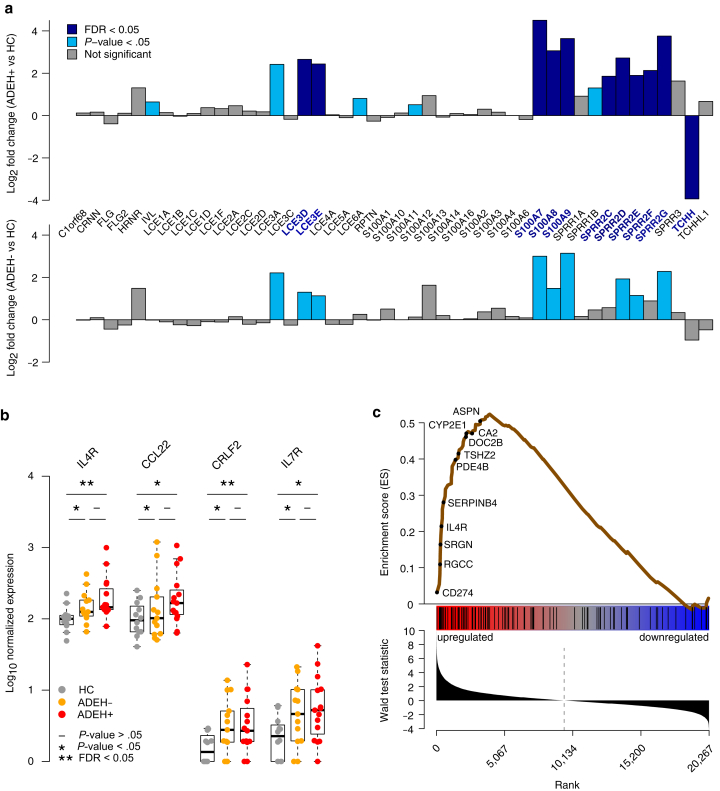
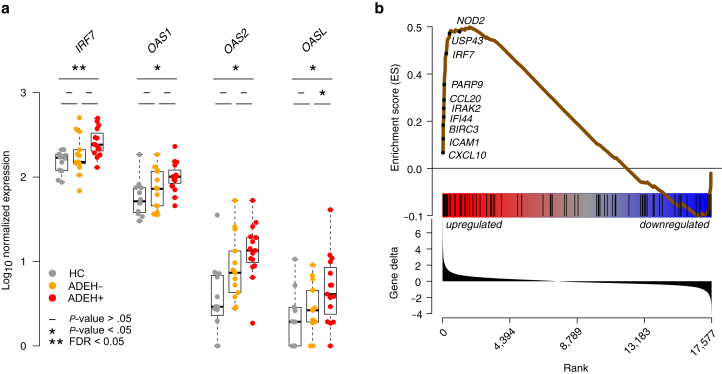
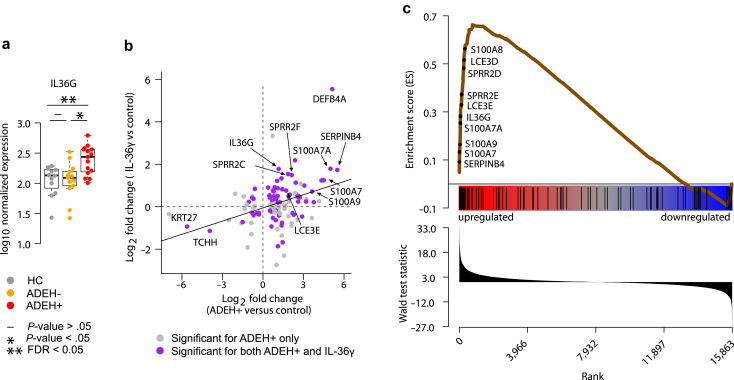
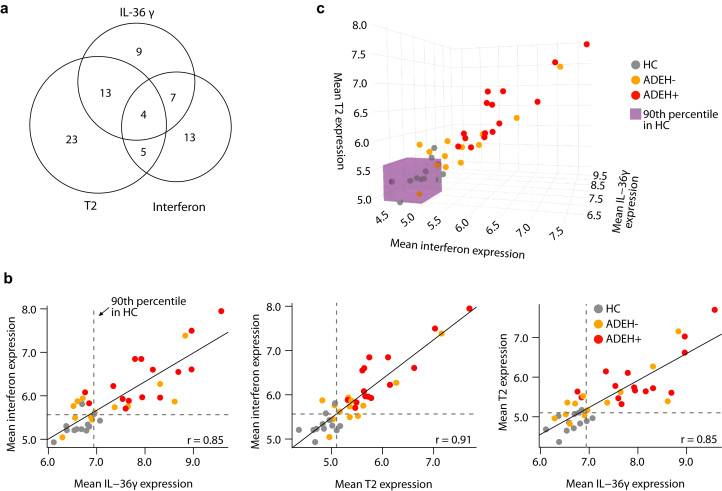
A subgroup of patients with atopic dermatitis (AD) suffers from recurrent, disseminated herpes simplex virus skin infection, termed eczema herpeticum. To determine the transcriptional mechanisms of the skin and immune system pathobiology that underlie development of AD with eczema herpeticum (ADEH), we performed RNA-sequencing analysis of nonlesional skin (epidermis, dermis) from AD patients with and without a history of ADEH (ADEH+, n = 15; ADEH-, n = 13) along with healthy controls (n = 15). We also performed RNA sequencing on participants' plasmacytoid dendritic cells infected in vitro with herpes simplex virus 1. ADEH+ patients exhibited dysregulated gene expression, limited in the dermis (14 differentially expressed genes) and more widespread in the epidermis (129 differentially expressed genes). ADEH+-upregulated epidermal differentially expressed genes were enriched in type 2 cytokine (IL4R , CCL22, CRLF2, IL7R), interferon (CXCL10, ICAM1, IFI44, IRF7), and IL-36γ (IL36G) inflammatory gene pathways. All ADEH+ participants exhibited type 2 cytokine and inteferon endotypes, and 87% were IL36G-high. In contrast, these endotypes were more variably expressed among ADEH- participants. ADEH+ skin also had dysregulated epidermal differentiation complex gene expression of the late-cornified envelope, S100A, and small proline-rich gene families, which are involved in skin barrier function and antimicrobial activities. Plasmacytoid dendritic cell transcriptional responses to herpes simplex virus 1 infection were unaltered by ADEH status. The study concluded that the pathobiology underlying ADEH+ risk is associated with a unique, multifaceted epidermal inflammation that accompanies dysregulation of epidermal differentiation complex genes. These findings will help direct future studies that define how these inflammatory patterns may drive risk of eczema herpeticum in AD.

Keywords: AD; ADEH; HSV; RNA sequencing; Skin disease.


Figures

None
Graphical abstract
Figure 1
Figure 1
Multitissue transcriptome analysis of nonlesional skin from subjects with AD with and without EH reveals dysregulated epidermal expression among subjects. (a) Heat maps showing LFC in expression between ADEH+ (top row) or ADEH (bottom row) participants compared with HCs for genes differentially expressed in 1 or the other disease group or both (from left to right) in epidermis (top) or dermis (bottom). The genes are organized into broad functional groups. Symbols above heat maps indicate whether (+) or not (−) each gene has been previously associated with AD in nonlesional skin. (b) Scatter plot comparing LFCs between ADEH and HC epidermal skin with those between ADEH+ and HC epidermal skin on the basis of genes with significantly modified expression in ADEH+ epidermis compared with that in HCs. Pearson correlation between the 2 sets of LFCs is indicated and demonstrates that genes dysregulated in ADEH+ skin are similarly dysregulated in ADEH individuals. AD, atopic dermatitis; ADEH, atopic dermatitis with eczema herpeticum; EDC, epidermal differentiation complex; EH, eczema herpeticum; HC, healthy control; LFC, log2 fold change.
Figure 2
Figure 2
Dysregulation of EDC gene expression in ADEH+ corresponds with T2 inflammation. (a) Bar plots of LFCs for EDC genes, comparing epidermal ADEH+ with HC skin (top) and ADEH with HC skin (bottom). Teal = nominally significant differences (P < .05); dark blue = significant differences (FDR < 0.05). Many dysregulated EDC genes in ADEH+ skin are similarly dysregulated in ADEH skin. (b) Box plots of epidermal expression for canonical T2 genes in HC (gray), ADEH (orange), and ADEH+ (red) samples. Asterisk (∗) denotes nominally significant differences (P < .05); asterisks (∗∗) denote significant differences (FDR < 0.05). (c) ES plot from GSEA visualizing enrichment of ADEH+ epidermal DEGs within a gene set preranked on the basis of DE analysis between T2-high and T2-low AD. Top: running-sum ES profile (brown line) across T2-ranked genes, where the left-side peak of positive ES values indicates particular enrichment of ADEH+ DEGs among the most T2-upregulated genes. A subset of genes belonging to the leading edge of enrichment (appearing at/before the ES maximum and most strongly contributing to enrichment) are indicated. Middle: vertical black bars denote positions of ADEH+ DEGs along the T2-ranked list of genes. Bottom: bar plot showing the ordered distribution of the gene ranking statistic (Wald test statistic from DESeq2). AD, atopic dermatitis; ADEH, atopic dermatitis with eczema herpeticum; DE, differential expression; DEG, differentially expressed gene; EDC, epidermal differentiation complex; ES, enrichment score; FDR, false discovery rate; GSEA, gene set enrichment analysis; HC, healthy control; LFC, log2 fold change; T2, type 2 cytokine.
Figure 3
Figure 3
ADEH skin exhibits enhanced viral/IFN inflammation. (a) Box plots of epidermal expression for canonical viral response genes in HC (gray), ADEH (orange), and ADEH+ (red) participants. The asterisk (∗) denotes nominally significant differences (P < .05); the asterisks (∗∗) denote significant differences (FDR < 0.05). (b) ES plot from GSEA visualizing enrichment of ADEH+ epidermal DEGs within a gene set preranked on the basis of expression within poly(I:C)-stimulated keratinocytes compared with the controls. Top: running-sum ES profile (brown line) across the poly(I:C)-ranked genes. A subset of leading-edge genes is shown. Middle: positions of ADEH+ DEGs along the poly(I:C)-ranked gene list. Bottom: ordered distribution of the gene-ranking statistic (gene deltas). ADEH, atopic dermatitis with eczema herpeticum; DEG, differentially expressed gene; ES, enrichment score; FDR, false discovery rate; GSEA, gene set enrichment analysis; HC, healthy control; Poly(I:C), polyinosinic:polycytidylic acid.
Figure 4
Figure 4
ADEH skin exhibits enhanced IL-36γ–driven inflammation. (a) Box plots of epidermal expression for IL36G in HC (gray), ADEH (orange), and ADEH+ (red). Asterisk (∗) denotes nominally significant differences (P < .05); asterisks (∗∗) denote significant differences (FDR < 0.05). (b) Scatter plot comparing LFCs for epidermal ADEH+ versus HC DEGs (x-axis) with LFCs of these same genes on the basis of comparing IL-36γ–stimulated keratinocytes with controls (y-axis). Gray = DEG only in the ADEH+ versus HC comparison; purple = DEG in both comparisons. (c) ES plot from GSEA visualizing enrichment of ADEH+ epidermal DEGs within a gene set preranked on the basis of IL-36γ–stimulated keratinocytes versus controls. Top: running-sum ES profile (brown line) across the IL-36γ–ranked genes. A subset of leading-edge genes is shown. Middle: positions of ADEH+ DEGs along the IL-36γ–ranked gene list. Bottom: ordered distribution of the gene-ranking statistic (Wald test statistic from DESeq2). ADEH, atopic dermatitis with eczema herpeticum; DEG, differentially expressed gene; ES, enrichment score; FDR, false discovery rate; GSEA, gene set enrichment analysis; HC, healthy control; LFC, log2 fold change.
Figure 5
Figure 5
Subjects with ADEH coexpress multiple inflammatory skin endotypes. (a) Venn diagram of leading-edge genes detected in distinct GSEAs that test for enrichment of epidermal ADEH+ DEGs within preranked genes on the basis of T2-high, viral-induced interferon (poly(I:C)-stimulation), and IL-36γ–stimulated inflammation. (b) Pairwise scatter plots of mean expression for distinct leading-edge genes from the 3 inflammatory endotypes (T2, interferon, and IL-36γ). Gray = HC, orange = ADEH, red = ADEH+. Dashed lines = the 90th percentiles of mean expression for HC samples, solid line = slope of the linear relationship, r = Pearson correlation coefficient. (c) The 3D scatter plot of mean expression for distinct leading-edge genes from the 3 inflammatory endotypes. Point colors are as in b. The purple box subsumes all values that are below the 90th percentile threshold of mean expression for HCs. 3D, 3-dimensional; ADEH, atopic dermatitis with eczema herpeticum; DEG, differentially expressed gene; GSEA, gene set enrichment analysis; HC, healthy control; Poly(I:C), polyinosinic:polycytidylic acid; T2, type 2 cytokine.

Update of

References

    1. Abtin A., Eckhart L., Gläser R., Gmeiner R., Mildner M., Tschachler E. The antimicrobial heterodimer S100A8/S100A9 (calprotectin) is upregulated by bacterial flagellin in human epidermal keratinocytes. J Invest Dermatol. 2010;130:2423–2430. - PubMed
    1. Beck L.A., Boguniewicz M., Hata T., Schneider L.C., Hanifin J., Gallo R., et al. Phenotype of atopic dermatitis subjects with a history of eczema herpeticum. J Allergy Clin Immunol. 2009;124:260–269.e2697. - PMC - PubMed
    1. Berdyshev E., Goleva E., Bronova I., Bronoff A.S., Streib J.E., Vang K.A., et al. Signaling sphingolipids are biomarkers for atopic dermatitis prone to disseminated viral infections. J Allergy Clin Immunol. 2022;150:640–648. - PMC - PubMed
    1. Bergboer J.G., Tjabringa G.S., Kamsteeg M., van Vlijmen-Willems I.M., Rodijk-Olthuis D., Jansen P.A., et al. Psoriasis risk genes of the late cornified envelope-3 group are distinctly expressed compared with genes of other LCE groups. Am J Pathol. 2011;178:1470–1477. - PMC - PubMed
    1. Bhakta N.R., Christenson S.A., Nerella S., Solberg O.D., Nguyen C.P., Choy D.F., et al. IFN-stimulated gene expression, type 2 inflammation, and endoplasmic reticulum stress in asthma. Am J Respir Crit Care Med. 2018;197:313–324. - PMC - PubMed