[Preprint]. 2024 Jul 5:2024.07.01.24309780.
doi: 10.1101/2024.07.01.24309780.

Tumor Regression Following Engineered Polyomavirus-Specific T Cell Therapy in Immune Checkpoint Inhibitor-Refractory Merkel Cell Carcinoma

Affiliations

Tumor Regression Following Engineered Polyomavirus-Specific T Cell Therapy in Immune Checkpoint Inhibitor-Refractory Merkel Cell Carcinoma

Yuta Asano et al. medRxiv. .

Abstract

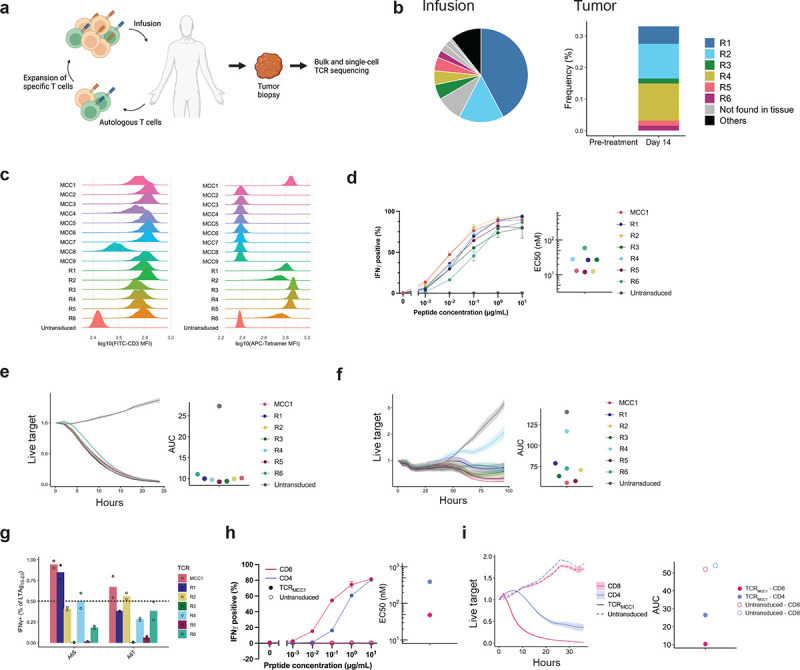
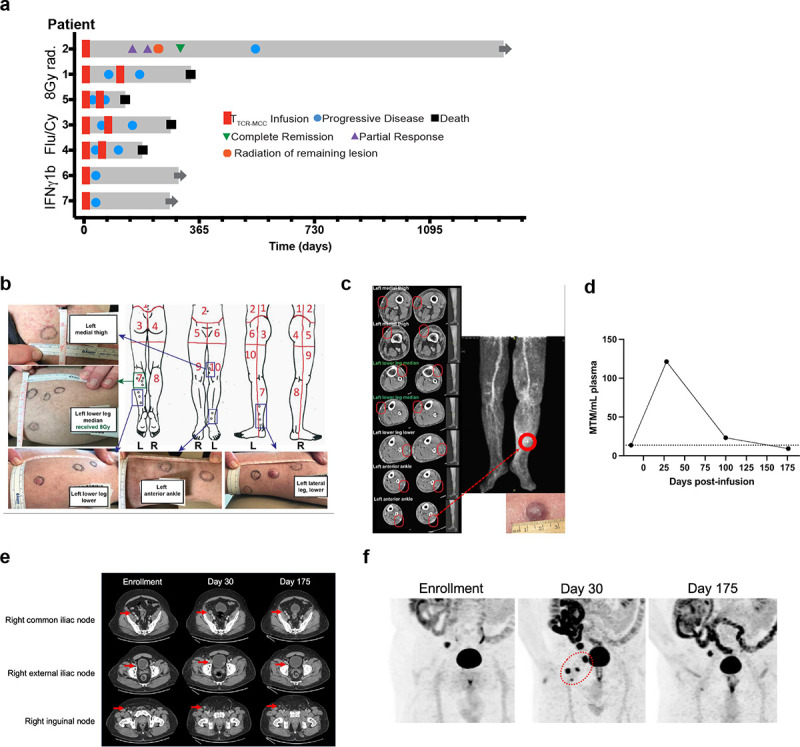
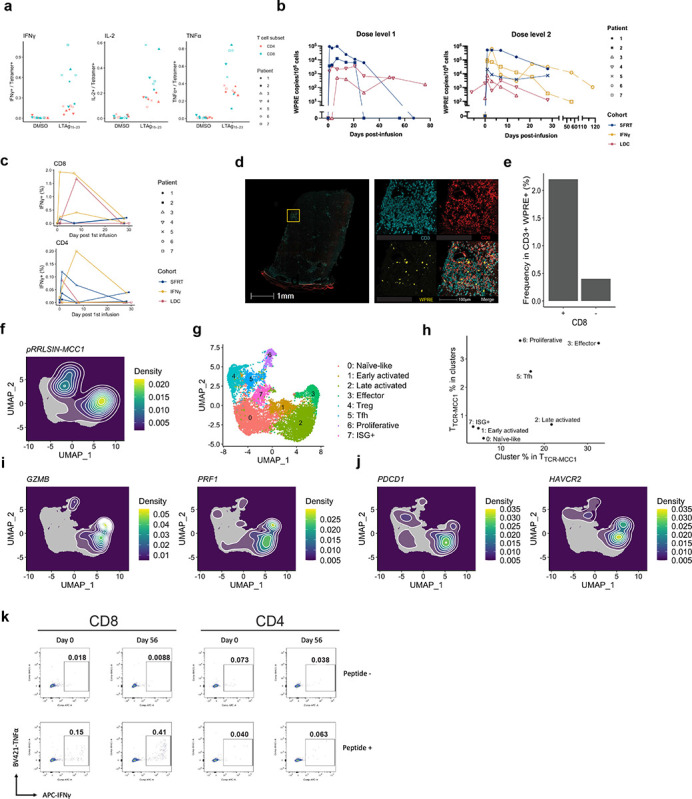
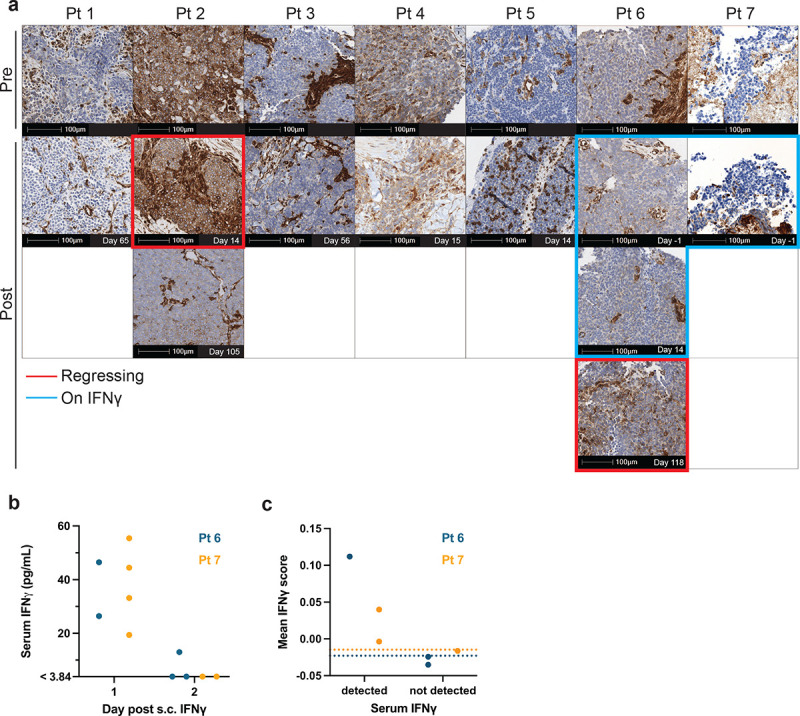
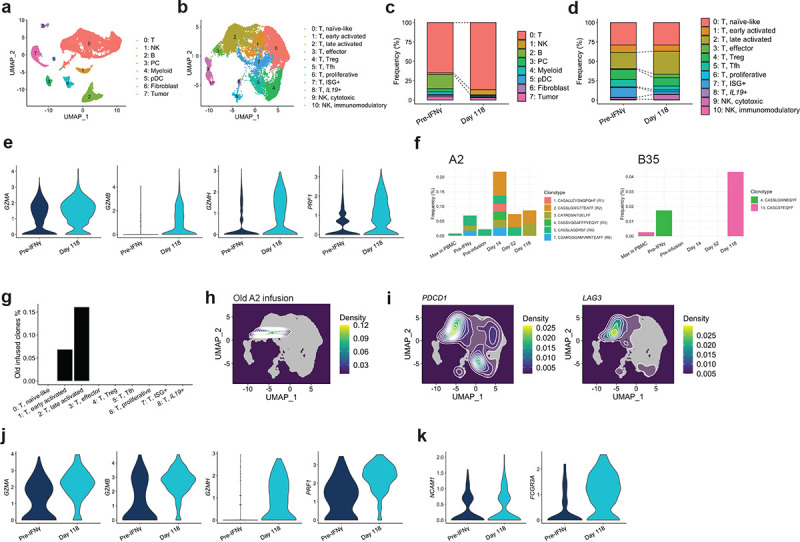
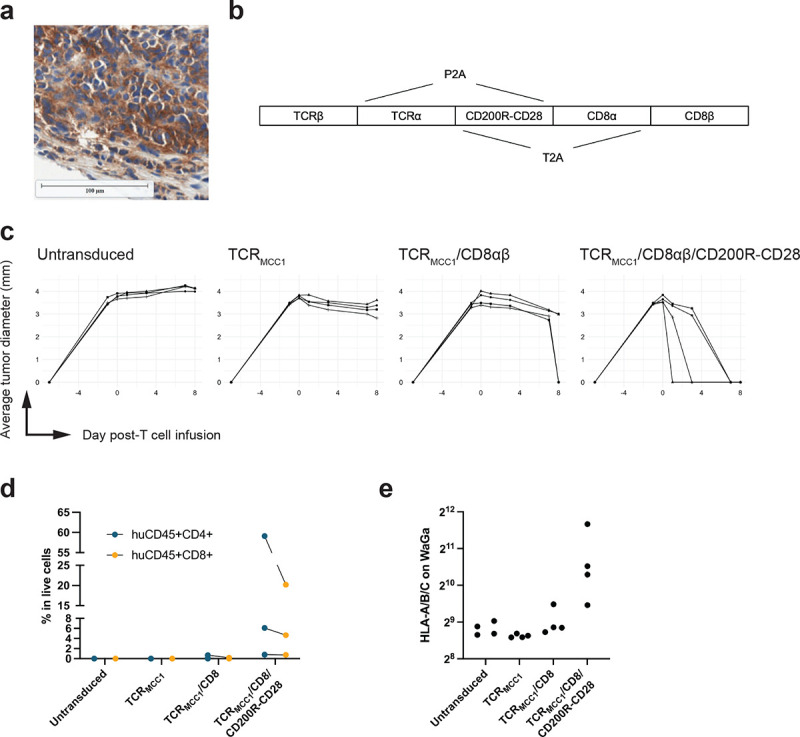
Although immune check-point inhibitors (CPIs) revolutionized treatment of Merkel cell carcinoma (MCC), patients with CPI-refractory MCC lack effective therapy. More than 80% of MCC express T-antigens encoded by Merkel cell polyomavirus, which is an ideal target for T-cell receptor (TCR)-based immunotherapy. However, MCC often repress HLA expression, requiring additional strategies to reverse the downregulation for allowing T cells to recognize their targets. We identified TCRMCC1 that recognizes a T-antigen epitope restricted to human leukocyte antigen (HLA)-A*02:01. Seven CPI-refractory metastatic MCC patients received CD4 and CD8 T cells transduced with TCRMCC1 (TTCR-MCC1) preceded either by lymphodepleting chemotherapy or an HLA-upregulating regimen (single-fraction radiation therapy (SFRT) or systemic interferon gamma (IFNγ)) with concurrent avelumab. Two patients who received preceding SFRT and IFNγ respectively experienced tumor regression. One experienced regression of 13/14 subcutaneous lesions with 1 'escape' lesion and the other had delayed tumor regression in all lesions after initial progression. Although TTCR-MCC1 cells with an activated phenotype infiltrated tumors including the 'escape' lesion, all progressing lesions transcriptionally lacked HLA expression. While SFRT/IFNγ did not immediately upregulate tumor HLA expression, a secondary endogenous antigen-specific T cell infiltrate was detected in one of the regressing tumors and associated with HLA upregulation, indicating in situ immune responses have the potential to reverse HLA downregulation. Indeed, supplying a strong co-stimulatory signal via a CD200R-CD28 switch receptor allows TTCR-MCC1 cells to control HLA-downregulated MCC cells in a xenograft mouse model, upregulating HLA expression. Our results demonstrate the potential of TCR gene therapy for metastatic MCC and propose a next strategy for overcoming epigenetic downregulation of HLA in MCC.


Conflict of interest statement

M. McAfee, P. Nghiem, T. Schmitt and A. G. Chapuis are inventors on Fred Hutchinson patents related to the MCPyV TCR (patent no. 17-085-US-PCT) used in these studies. A. G. Chapuis received research funding through cooperative research and development agreements with bluebird Bio and Affini-T Therapeutics.

Figures

Figure 1.
Figure 1.. T cells transduced with the anti-MCPyV TCR identified from healthy donor PBMCs showed similar functional avidity but broader recognition of LTAg15–23 variants compared to those identified from responding patient-derived tumor-infiltrating T cells.
a Schema of the expanded autologous T cell therapy with HLA-A*02:01-restricted LTAg15–23-specific CD8+ T cells resulting in MCC regression. b distribution in the infusion product (left) and frequency of the infusion-enriched clonotypes before and after T cell infusion in a regressing tumor biopsy (right). c CD3 expression (left) indicating surface expression of a functional TCR and LTAg15–23 p/HLA binding (right) by endogenous TCR knock-out Jurkat cells. d IFNγ production by CD8 T cells transduced with indicated TCRs exposed to TAP-deficient T2 B lymphoblastoid cell lines (T2-BLCL) exogenously loaded with indicated concentrations of LTAg15–23 (left) and mean half-maximal concentrations (EC50) (right) of three biological replicates for each TCR. 1 ng/mL LTAg15–23 equals 1 nM. e, f Growth kinetics of HLA-A2+ LTAg+ dermal fibroblasts (e) or WaGa cells (f) in the presence of CD8 T cells transduced with indicated TCRs. g IFNγ production by CD8 T cells transduced with indicated TCRs upon coculture with exogenously loaded LTAg15–23 variants (10 μg/mL). Horizontal line indicates 50% threshold below which variant recognition was impaired. Data from two biological replicates are shown. 50% h, i Same as (d, e) comparing CD8 vs. CD4 T cells transduced with TCRMCC1.
Figure 2.
Figure 2.. forced HLA expression, TCRMCC1, and CPIs induced tumor regression in 2/7 previously CPI-refractory metastatic MCC patients.
a A swimmer’s plot showing clinical courses of the five enrolled patients. b Images and map of Pt 2 tumors at enrollment. c CT and PET scan images of Pt. 2’s remaining ‘escape’ lesion 105 days after TCRMCC1 infusion. d-f Pt 6 circulating tumor DNA (ctDNA) measurements (d), CT scan (e) and PET images (f) at indicated timepoints after TCRMCC1 infusion. Target lesions are indicated with red arrows and a circle.
Figure 3.
Figure 3.. Functional TTCR-MCC1 cells persist in blood and preferentially infiltrate tumors.
a Percent of CD4 and CD8 TTCR-MCC1 within the infusion products that produced IFNg, TNFa or IL-2 in response to LTAg15–23. b Circulating TTCR-MCC1 (WPRE copies/106 cells) (y axis) at indicated timepoints (x axis) for all pts. c Percent of CD4 and CD8 TTCR-MCC1 that produced IFNg in response to 1μM LTAg15–23 at indicated timepoints. d CD3/CD8/WPRE (FISH) staining of Pt 2 ‘escape’ lesion. The right panel shows a zoomed-in image of the selected region in the left panel. e Quantification of CD8+ or CD8- CD3+ WPRE+ cells in (d). f Density of TCRMCC1 cells projected on the UMAP coordinate. g A UMAP plot of T cell populations with cluster annotations. h Frequency of TTCR-MCC1 cells in each cluster (y-axis) and frequency of each cluster in TTCR-MCC1 cells. i, j Density of cells that express indicated genes projected on the UMAP coordinate. k Cytokine production from expanded tumor-infiltrating T cells in Pt 6 biopsies.
Figure 4.
Figure 4.. HLA expression/downregulation is associated with tumor regression/progression.
a IHC of class-I HLA in tumor tissues. b Serum IFNγ level detected by Luminex in Pts 6 and 7 during the systemic IFNγ regimen. c IFNγ downstream gene scores calculated in Pts 6 and PBMC scRNA-seq data up to Day 28 post-T cell infusion. Each data point represents a single time point where scores of all cells were averaged. Dotted lines indicate basal levels at pre-IFNγ time points.
Figure 5.
Figure 5.. Activated endogenous T and NK cells expanded in a tumor showing delayed regression.
a, b scRNA-seq cluster annotation of major cell types (a) and T/NK cell sub-clusters (b). c, d cluster frequency change from pre-treatment to Day 118, with (c, d) corresponding to (a, b) respectively. e Effector gene expression in T cells of sub-cluster 1–3 combined at the indicated time points. f TCR clonotypes in the infusion products for a previous endogenous T cell trial that were re-discovered in Pt 6 PBMC and tumors. “Max in PBMC” indicates the maximum frequency across tested PBMC time points. g Frequency of old HLA-A2-targeting infusion clones in T cell sub-clusters. h Distribution of the A2-targeting clones on the UMAP plot. i Density of cells that express indicated genes projected on the UMAP coordinate. j, k Effector (j) and phenotypic marker (k) gene expression in NK cells at the indicated time points.
Figure 6.
Figure 6.. A CD200-targeting switch receptor allows TTCR-MCC1 cells control HLA-low MCC cells in mice.
a CD200 expression in MCC. A representative image from Pt 1 is shown. b Design of TCRMCC1/CD200R-CD28/CD8αβ construct. c In vivo tumor control by T cells with the indicated transgene. 4 mice per arm. d Frequency of human CD4 and CD8 T cells in digested tumor single cell suspension. e HLA expression on tumor (huCD45- CD56+) cells measured by flow cytometry.

References

    1. Cowey C. L. et al. Real-world treatment outcomes in patients with metastatic Merkel cell carcinoma treated with chemotherapy in the USA. Future Oncology 13, 1699–1710 (2017). - PubMed
    1. Becker J. C. et al. Evaluation of real-world treatment outcomes in patients with distant metastatic Merkel cell carcinoma following second-line chemotherapy in Europe. Oncotarget 8, 79731–79741 (2017). - PMC - PubMed
    1. D’Angelo S. P. et al. First-line avelumab in a cohort of 116 patients with metastatic Merkel cell carcinoma (JAVELIN Merkel 200): primary and biomarker analyses of a phase II study. J Immunother Cancer 9, e002646 (2021). - PMC - PubMed
    1. D’Angelo S. P. et al. Avelumab in patients with previously treated metastatic Merkel cell carcinoma (JAVELIN Merkel 200): updated overall survival data after >5 years of follow-up. ESMO Open 6, 100290 (2021). - PMC - PubMed
    1. Ribas A. & Wolchok J. D. Cancer immunotherapy using checkpoint blockade. Science 359, 1350–1355 (2018). - PMC - PubMed

Publication types