[Preprint]. 2024 Jul 5:2024.07.03.24309903.
doi: 10.1101/2024.07.03.24309903.

A Label-free Optical Biosensor-Based Point-of-Care Test for the Rapid Detection of Monkeypox Virus

Affiliations

A Label-free Optical Biosensor-Based Point-of-Care Test for the Rapid Detection of Monkeypox Virus

Mete Aslan et al. medRxiv. .

Update in

Abstract

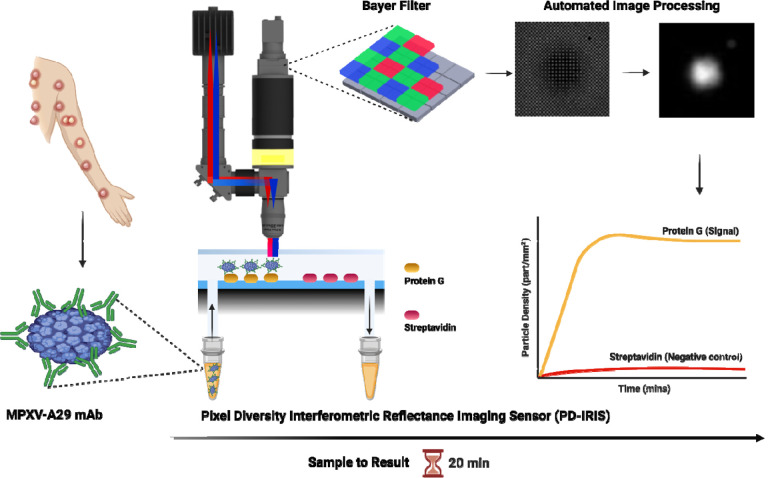
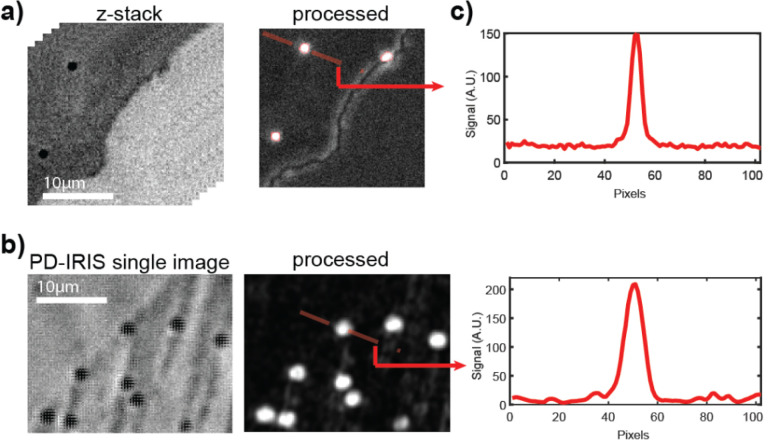
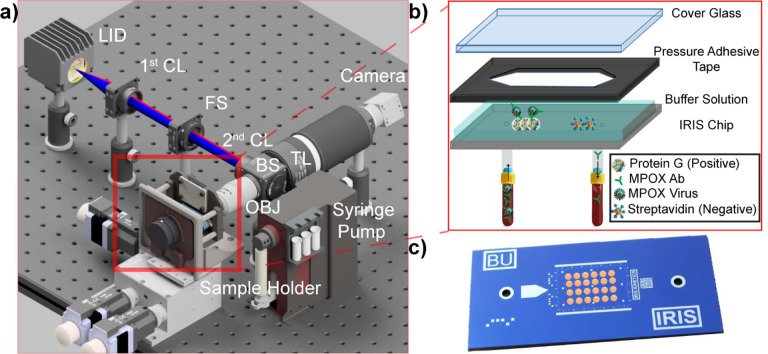
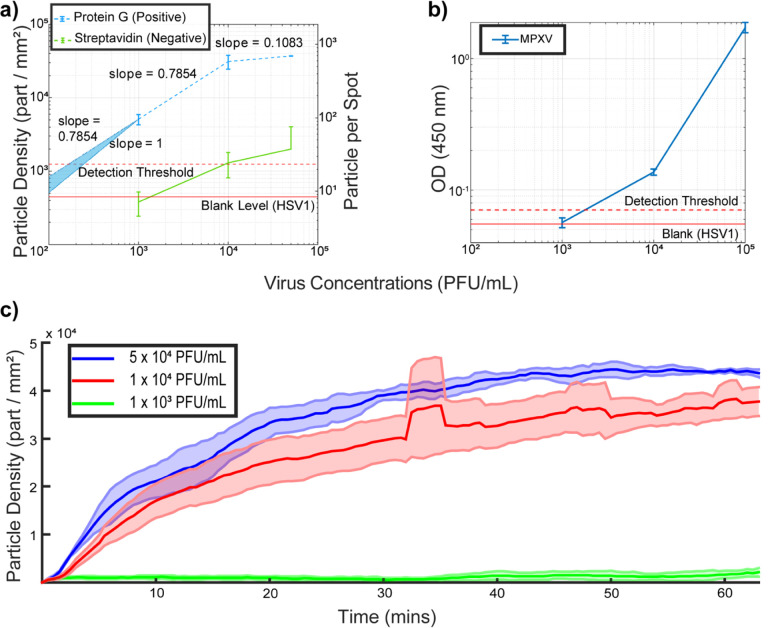
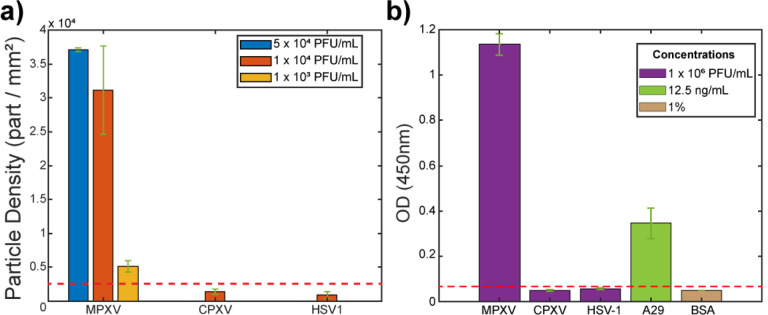
Diagnostic approaches that combine the high sensitivity and specificity of laboratory-based digital detection with the ease of use and affordability of point-of-care (POC) technologies could revolutionize disease diagnostics. This is especially true in infectious disease diagnostics, where rapid and accurate pathogen detection is critical to curbing the spread of disease. We have pioneered an innovative label-free digital detection platform that utilizes Interferometric Reflectance Imaging Sensor (IRIS) technology. IRIS leverages light interference from an optically transparent thin film, eliminating the need for complex optical resonances to enhance the signal by harnessing light interference and the power of signal averaging in shot-noise-limited operation to achieve virtually unlimited sensitivity. In our latest work, we have further improved our previous 'Single-Particle' IRIS (SP-IRIS) technology by allowing the construction of the optical signature of target nanoparticles (whole virus) from a single image. This new platform, 'Pixel-Diversity' IRIS (PD-IRIS), eliminated the need for z-scan acquisition, required in SP-IRIS, a time-consuming and expensive process, and made our technology more applicable to POC settings. Using PD-IRIS, we quantitatively detected the Monkeypox virus (MPXV), the etiological agent for Monkeypox (Mpox) infection. MPXV was captured by anti-A29 monoclonal antibody (mAb 69-126-3) on Protein G spots on the sensor chips and were detected at a limit-of-detection (LOD) - of 200 PFU/ml (~3.3 attomolar). PD-IRIS was superior to the laboratory-based ELISA (LOD - 1800 PFU/mL) used as a comparator. The specificity of PD-IRIS in MPXV detection was demonstrated using Herpes simplex virus, type 1 (HSV-1), and Cowpox virus (CPXV). This work establishes the effectiveness of PD-IRIS and opens possibilities for its advancement in clinical diagnostics of Mpox at POC. Moreover, PD-IRIS is a modular technology that can be adapted for the multiplex detection of pathogens for which high-affinity ligands are available that can bind their surface antigens to capture them on the sensor surface.

Keywords: Intact Virus detection; Label-free biosensor; Monkeypox (Mpox); Pixel Diversity Interferometric Reflectance Imaging Sensor (PD-IRIS); Point of Care (POC) diagnostics.


Figures

Figure 1:
Figure 1:
A schematic showing PD-IRIS workflow for MPXV detection in a POC format. First, the sample (MPXV) is mixed with specific detection antibodies (A29 mAb), and then, this mixture flows over the PD-IRIS chip assembled in a microfluidic cartridge. As the antibody-decorated viruses are captured on the surface-spotted protein G, bound particles appear as white dots on the camera following an image processing step. The overall signal is calculated as particle density (particles/mm2), and the binding curves are generated to show the signal on protein G and negative (streptavidin) spots. The figure was made using the BioRender software.
Figure 2:
Figure 2:
Comparison of SP-IRIS (a) and PD-IRIS (b) modalities. The signal along the cross-section of the analyzed particle for both techniques is given in (c).
Figure 3:
Figure 3:
Defocus profiles of 80 nm gold nanospheres (GNS) (a, b) and MPXV particles (c) that are immobilized on silicon chips with a 60 nm SiO2 top layer. The measured defocus signals are shifted when the light is collected with 20x S Plan Flour, Nikon objective lens. The arrows indicate the shift due to chromatic aberrations (a). A 10x Plan Apochromatic Lambda D, Nikon objective lens doesn’t yield defocus shifts (b). All defocus profiles have a ~ 5 μm focus range where the difference between minimum and maximum contrast of different color channels is greater than 1%. The shaded region indicates where the focus is set for MPXV experiments (c).
Figure 4:
Figure 4:
Prototype of PD-IRIS (a). Uniformly mixed light at two distinct wavelengths excites the sample in the Koehler configuration. The reflected and scattered light response is collected by the same objective lens and imaged onto a conventional color CMOS sensor. The chip and glass cover are assembled using pressure adhesive tape, creating a fluidic channel for the sample incubation (b). An image of the PD-IRIS chip with microarray spots printed (c).
Figure 5:
Figure 5:
Estimating the sensitivity of PD-IRIS (a) and ELISA (b) for MPXV detection. The signal obtained from the distractor viruses (HSV-1) was used to determine the limit-of-detection (LOD) level, which is shown as a red dashed line (Mean particle density plus three standard deviations). For PD-IRIS measurements (a), two different FOVs, including three protein G and two streptavidin spots, are analyzed to extract the data points. Once the mean particle density and total detected particles are calculated for each FOV, the error bars are created by calculating the mean and standard deviation of those two FOVs. The error bars for ELISA (c) are calculated from three OD measurements. The LOD curve was extrapolated according to the slope between the least two concentrations of the virus dilutions in PD-IRIS data. The real-time MPXV measurements of PD-IRIS are shown in (c) for three different virus concentrations over the course of the experiment. For each real-time experiment, three different protein G spots are imaged. The solid line represents the mean of those three spots, and the shaded area represents their standard deviations.
Figure 6:
Figure 6:
Specificity experiments with PD-IRIS (a) and ELISA (b). The red dotted line represents 3 standard deviations from the mean of the HSV-1 signal for both graphs and corresponds to the detection threshold.

References

    1. Allan D.B., Caswell T., Keim N.C., der Wel C.M., Verweij R.W., 2023. soft-matter/trackpy: v0.6.1. 10.5281/zenodo.7670439 - DOI
    1. Americo J.L., Earl P.L., Moss B., 2017. Droplet digital PCR for rapid enumeration of viral genomes and particles from cells and animals infected with orthopoxviruses. Virology 511, 19–22. 10.1016/J.VIROL.2017.08.005 - DOI - PMC - PubMed
    1. Azzi A., 2023. Unusual Monkeypox virus outbreak in 2022: Phenotypic and molecular characteristics. Aspects of Molecular Medicine 1, 100001. 10.1016/J.AMOLM.2023.100001 - DOI
    1. Baaske M., Vollmer F., 2012. Optical resonator biosensors: molecular diagnostic and nanoparticle detection on an integrated platform. ChemPhysChem 13, 427–436. - PubMed
    1. Bourner J., Garcia E., Mbrenga F., Boum Y., Paterson A., Jones B., Olliaro P., Nakouné E., Rojek A., 2024. Challenges in Clinical Diagnosis of Clade I Mpox: Highlighting the Need for Enhanced Diagnostic Approaches. medRxiv 2023–2024. - PMC - PubMed

Publication types

LinkOut - more resources