. 2024 Jul 3;28(3):419.
doi: 10.3892/ol.2024.14552. eCollection 2024 Sep.

A hot and cold tumor‑related prognostic signature for stage II colorectal cancer

Affiliations

A hot and cold tumor‑related prognostic signature for stage II colorectal cancer

Ming Zhou et al. Oncol Lett. .

Abstract

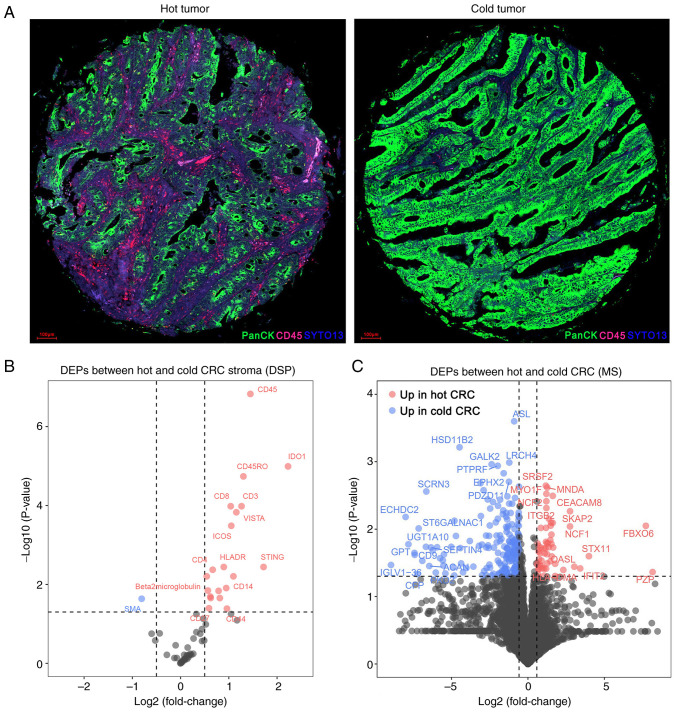
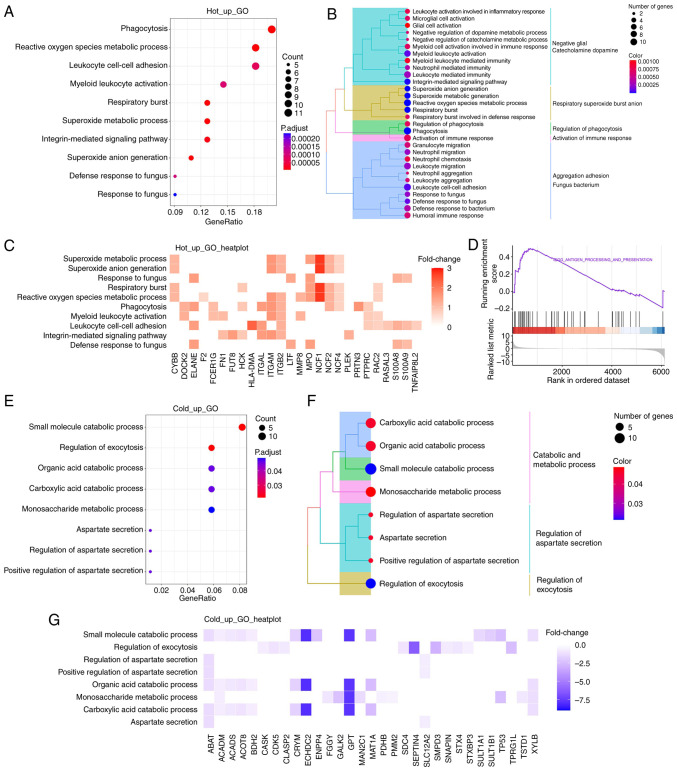
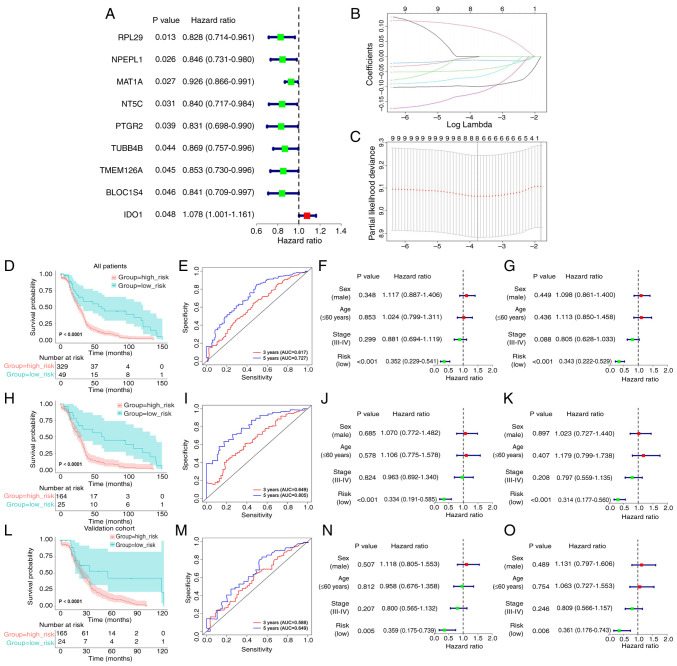
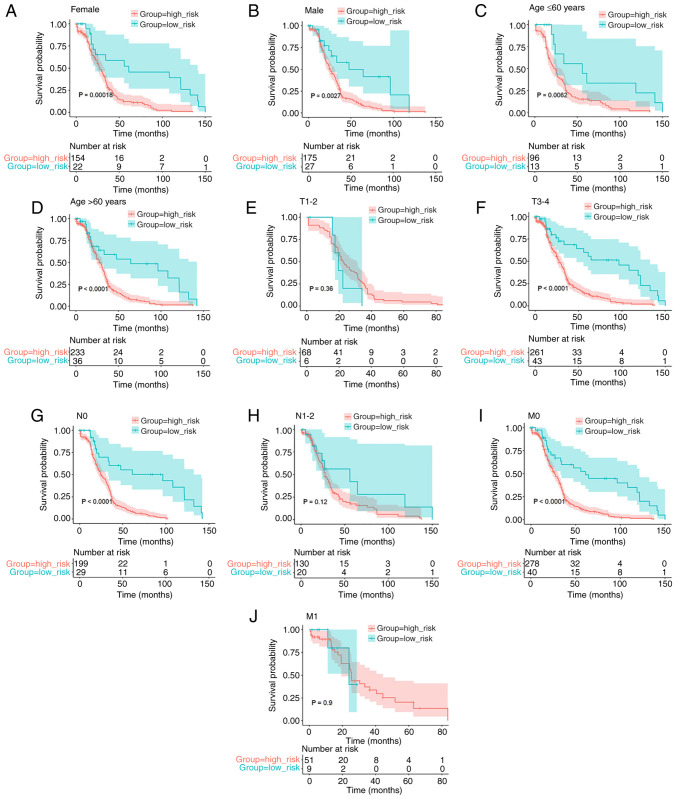
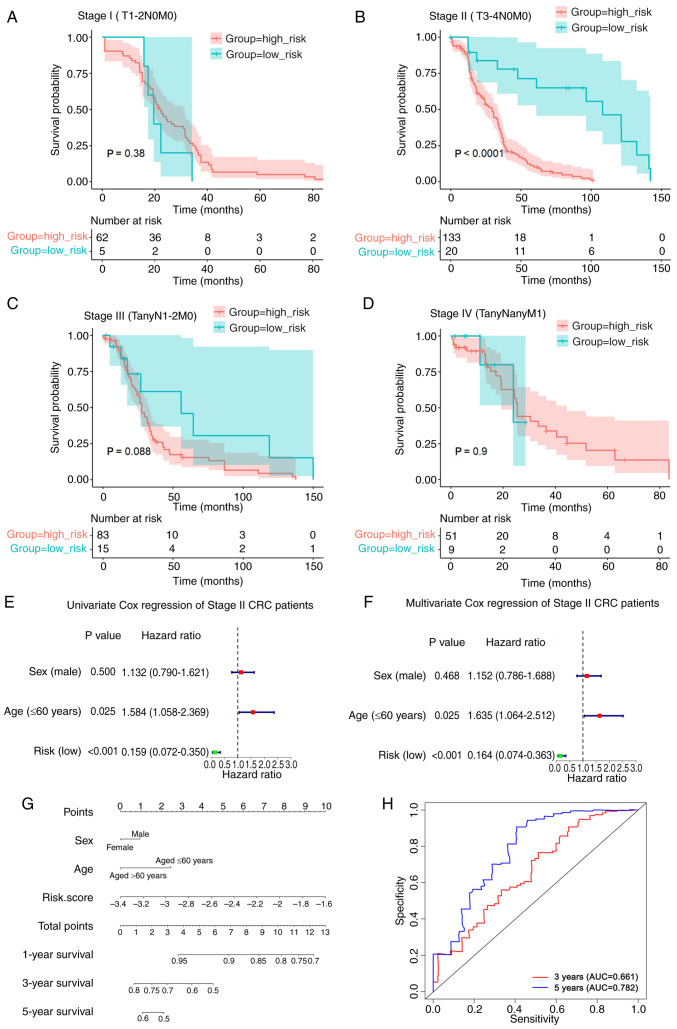
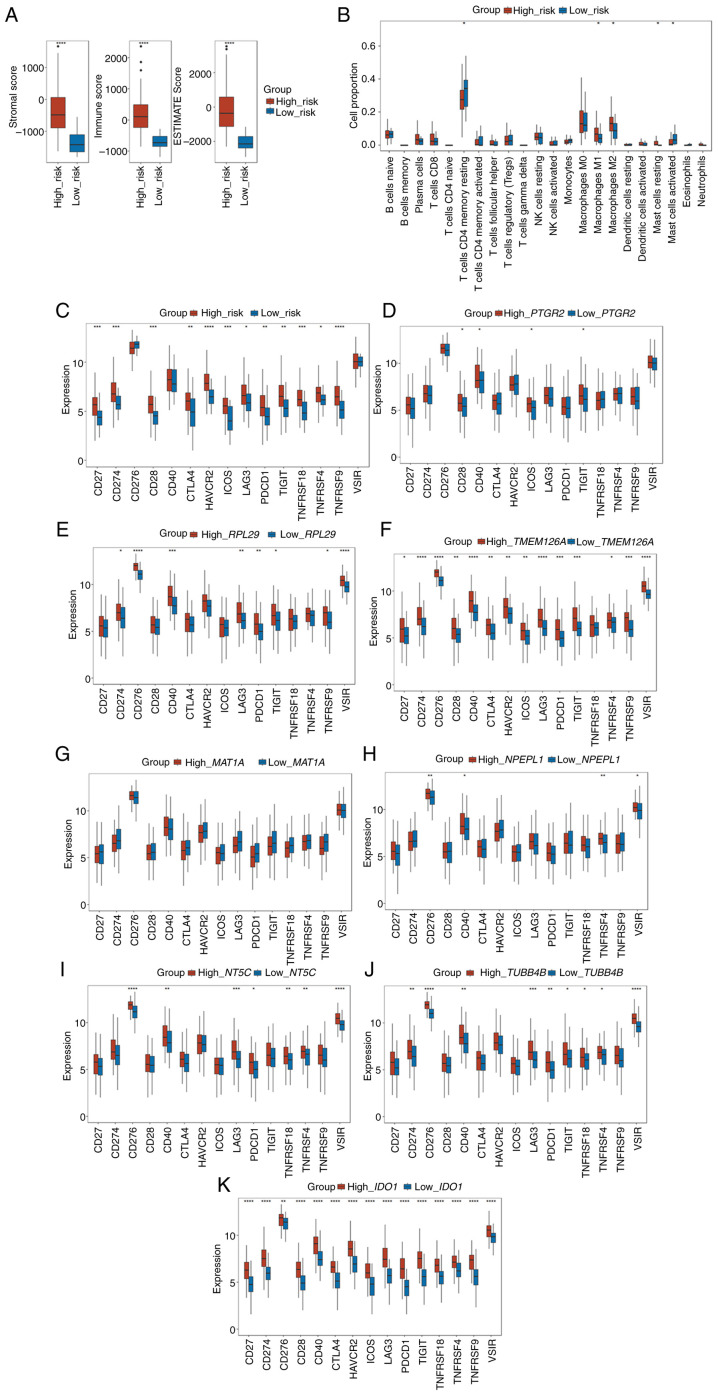
Globally, colorectal cancer (CRC) is one of the most lethal and prevalent malignancies. Based on the presence of immune cell infiltration in the tumor microenvironment, CRC can be divided into immunologically 'hot' or 'cold' tumors, which in turn leads to the differential efficacy of immunotherapy. However, the immune characteristics of hot and cold CRC tumors remain largely elusive, prompting further investigation of their properties regarding the tumor microenvironment. In the present study, a predictive model was developed based on the differential expression of proteins between cold and hot CRC tumors. First, the differentially expressed proteins (DEPs) were identified using digital spatial profiling and mass spectrometry-based proteomics analysis, and the pathway features of the DEPs were analyzed using functional enrichment analysis. A novel eight-gene signature prognostic risk model was developed (IDO1, MAT1A, NPEPL1, NT5C, PTGR2, RPL29, TMEM126A and TUBB4B), which was validated using data obtained from The Cancer Genome Atlas. The results revealed that the risk score of the eight-gene signature acted as an independent prognostic indicator in patients with stage II CRC (T3-4N0M0). It was also found that a high-risk score in the eight-gene signature was associated with high immune cell infiltration in patients with CRC. Taken together, these findings revealed some of the differential immune characteristics of hot and cold CRC tumors, and an eight-gene signature prognostic risk model was developed, which may serve as an independent prognostic indicator for patients with stage II CRC (T3-4N0M0).

Keywords: colorectal cancer; hot and cold tumor; prognosis; tumor microenvironment.


Conflict of interest statement

The authors declare that they have no competing interests.

Figures

Figure 1.
Figure 1.
DSP- and MS-based proteomics analysis for the identification of DEPs between hot and cold CRC tumors. (A) Representative images of hot and cold tumors obtained by immunofluorescent staining for SYTO13 (blue), PanCK (green) and CD45 (red) using the NanoString DSP platform. SYTO13, PanCK and CD45 were used to characterize the nuclei, tumor and stroma compartments, respectively. (B) Volcano plot of the DEPs in the stroma compartment between primary hot and cold CRC tumor samples via DSP analysis. (C) Volcano plot of the DEPs between primary hot and cold CRC tumor samples via MS-based proteomics analysis. The vertical lines represent the log2 fold changes of −0.5 and 0.5, and the horizontal line represents the P-value of 0.05. DSP, digital spatial profiling; MS, mass spectrometry; CRC, colorectal cancer; DEP, differentially expressed protein.
Figure 2.
Figure 2.
Functional enrichment analysis reveals the functional differential pathways between the hot and cold CRC tumors. (A) Bubble plots of the GO analysis of upregulated proteins in the hot CRC group. (B) Tree diagrams of the GO analysis of the upregulated proteins in the hot CRC group. Circle size, the number of genes contributing to the pathway. Color bar, adjusted P-value for the pathway. (C) Heatmap of the top ten biological processes and the expressions of the corresponding proteins. (D) Gene set enrichment analysis of antigen processing and presentation pathway genes. (E) Bubble plots of the GO analysis of downregulated proteins in the hot CRC group. (F) Tree diagrams of the GO analysis of the downregulated proteins in the hot CRC group. Circle size, the number of genes contributing to the pathway. Color bar, adjusted P value for the pathway. (G) Heatmap of the top eight biological processes and the expression of the corresponding proteins. CRC, colorectal cancer; GO, Gene Ontology.
Figure 3.
Figure 3.
A prognostic risk model of the eight-gene signature constructed and validated using data obtained from TCGA. (A) Forest plot of the prognosis-related genes based on the univariate Cox regression analysis. (B) LASSO regression analysis was used to identify the eight-gene signature. (C) Cross-validation in the LASSO model. (D) Kaplan-Meier curve of the OS between the high- and low-risk subgroups in all patients from TCGA. (E) ROC curves of the eight-gene signature for 3- and 5-year OS in all patients from TCGA. Forest plots of the (F) univariate and (G) multivariate Cox regression analyses for the clinicopathological factors and the risk score in all patients from TCGA. (H) Kaplan-Meier curve of the OS between the high- and low-risk subgroups in the training cohort from TCGA. (I) ROC curves of the eight-gene signature for 3- and 5-year OS in the training cohort from TCGA. Forest plots of the (J) univariate and (K) multivariate Cox regression analyses for the clinicopathological factors and the risk score in the training cohort from TCGA. (L) Kaplan-Meier curve of the OS between the high- and low-risk subgroups in the validation cohort from TCGA. (M) ROC curves of the eight-gene signature for 3- and 5-year OS in the validation cohort from TCGA. Forest plots of the (N) univariate and (O) multivariate Cox regression analyses of the clinicopathologic factors and the risk score in the validation cohort from TCGA. TCGA, The Cancer Genome Atlas; OS, overall survival; AUC, area under the curve; ROC, receiver operating characteristic.
Figure 4.
Figure 4.
Kaplan-Meier analysis showing the association between the risk score of the eight-gene signature and survival in the different subgroups of patients. Kaplan-Meier curves showing the overall survival between the high- and low-risk subgroups in (A) female and (B) male patients, patients (C) aged ≤60 years and (D) aged >60 years old, and patients with stage (E) T1-2, (F) T3-4, (G) N0, (H) N1-2, (I) M0 and (J) M1 tumors.
Figure 5.
Figure 5.
Risk score of the eight-gene signature serves as an independent prognostic indicator in patients with stage II CRC (T3-4N0M0). Kaplan-Meier curves for OS between the high- and low-risk subgroups in patients with (A) stage I (T1-2N0M0), (B) stage II (T3-4N0M0), (C) stage III and (D) stage IV CRC using data obtained from TCGA. Forest plots of (E) univariate and (F) multivariate Cox regression analyses for the clinicopathologic factors and the risk score in patients with stage II CRC (T3-4N0M0) using data obtained from TCGA. (G) Nomogram for predicting the 1-, 3- and 5-year OS in patients with stage II CRC (T3-4N0M0). (H) Receiver operating characteristic curves of the eight-gene signature for 3- and 5-year OS in patients with stage II CRC (T3-4N0M0). TCGA, The Cancer Genome Atlas; OS, overall survival; AUC, area under the curve; CRC, colorectal cancer.
Figure 6.
Figure 6.
Risk score is associated with the tumor immune infiltration characteristics of colorectal cancer. (A) Box plots of the comparison of the stromal score, immune score, and ESTIMATE score between the high- and low-risk subgroups. (B) Box plots of the differences in the proportion of immune cells between the high- and low-risk subgroups. (C) Box plots of the differences in the expression of immune checkpoint genes between the high- and low-risk subgroups. Box plots of the differences in the expression of immune checkpoint genes between the high- and low-expression subgroups of (D) PTGR2, (E) RPL29, (F) TMEM126A, (G) MAT1A, (H) NPEPL1, (I) NT5C, (J) TUBB4B and (K) IDO1. *P<0.05, **P<0.01, ***P<0.001, ****P<0.0001. ESTIMATE, Estimation of STromal and Immune cells in MAlignant Tumor tissues using Expression data.

Similar articles

Cited by

References

    1. Paijens ST, Vledder A, de Bruyn M, Nijman HW. Tumor-infiltrating lymphocytes in the immunotherapy era. Cell Mol Immunol. 2021;18:842–859. doi: 10.1038/s41423-020-00565-9. - DOI - PMC - PubMed
    1. Hanahan D, Coussens LM. Accessories to the crime: Functions of cells recruited to the tumor microenvironment. Cancer Cell. 2012;21:309–322. doi: 10.1016/j.ccr.2012.02.022. - DOI - PubMed
    1. Kim TK, Vandsemb EN, Herbst RS, Chen L. Adaptive immune resistance at the tumour site: Mechanisms and therapeutic opportunities. Nat Rev Drug Discov. 2022;21:529–540. doi: 10.1038/s41573-022-00493-5. - DOI - PubMed
    1. Duan Q, Zhang H, Zheng J, Zhang L. Turning cold into hot: Firing up the Tumor Microenvironment. Trends Cancer. 2020;6:605–618. doi: 10.1016/j.trecan.2020.02.022. - DOI - PubMed
    1. Weng J, Li S, Zhu Z, Liu Q, Zhang R, Yang Y, Li X. Exploring immunotherapy in colorectal cancer. J Hematol Oncol. 2022;15:95. doi: 10.1186/s13045-022-01294-4. - DOI - PMC - PubMed

LinkOut - more resources