. 2024 Jul 12;6(4):fcae213.
doi: 10.1093/braincomms/fcae213. eCollection 2024.

Ethnic differences in the effects of apolipoprotein E ɛ4 and vascular risk factors on accelerated brain aging

Affiliations

Ethnic differences in the effects of apolipoprotein E ɛ4 and vascular risk factors on accelerated brain aging

Yanghee Im et al. Brain Commun. .

Abstract

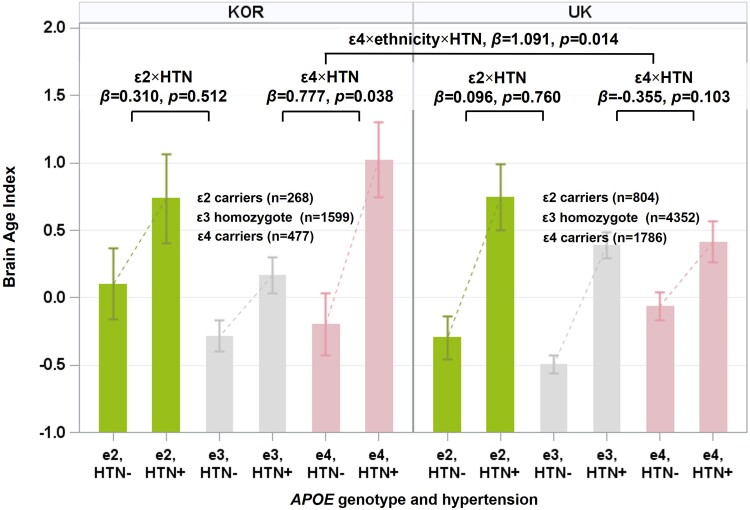
The frequency of the apolipoprotein E ɛ4 allele and vascular risk factors differs among ethnic groups. We aimed to assess the combined effects of apolipoprotein E ɛ4 and vascular risk factors on brain age in Korean and UK cognitively unimpaired populations. We also aimed to determine the differences in the combined effects between the two populations. We enrolled 2314 cognitively unimpaired individuals aged ≥45 years from Korea and 6942 cognitively unimpaired individuals from the UK, who were matched using propensity scores. Brain age was defined using the brain age index. The apolipoprotein E genotype (ɛ4 carriers, ɛ2 carriers and ɛ3/ɛ3 homozygotes) and vascular risk factors (age, hypertension and diabetes) were considered predictors. Apolipoprotein E ɛ4 carriers in the Korean (β = 0.511, P = 0.012) and UK (β = 0.302, P = 0.006) groups had higher brain age index values. The adverse effects of the apolipoprotein E genotype on brain age index values increased with age in the Korean group alone (ɛ2 carriers × age, β = 0.085, P = 0.009; ɛ4 carriers × age, β = 0.100, P < 0.001). The apolipoprotein E genotype, age and ethnicity showed a three-way interaction with the brain age index (ɛ2 carriers × age × ethnicity, β = 0.091, P = 0.022; ɛ4 carriers × age × ethnicity, β = 0.093, P = 0.003). The effects of apolipoprotein E on the brain age index values were more pronounced in individuals with hypertension in the Korean group alone (ɛ4 carriers × hypertension, β = 0.777, P = 0.038). The apolipoprotein E genotype, age and ethnicity showed a three-way interaction with the brain age index (ɛ4 carriers × hypertension × ethnicity, β=1.091, P = 0.014). We highlight the ethnic differences in the combined effects of the apolipoprotein E ɛ4 genotype and vascular risk factors on accelerated brain age. These findings emphasize the need for ethnicity-specific strategies to mitigate apolipoprotein E ɛ4-related brain aging in cognitively unimpaired individuals.

Keywords: APOE ɛ4; brain age; ethnicity; vascular risk factors.


Conflict of interest statement

The authors report no competing interests.

Figures

Graphical Abstract
Graphical Abstract
Figure 1
Figure 1
GCN for regional brain age prediction. (A) The input to the GCN was defined as a set of two feature vectors (i.e. cortical thickness and grey/white matter intensity ratio) in all vertices in a specific ROI and a sparse binary adjacency matrix representing the connections between each vertex and its neighbouring vertices. The output of the GCN model was a predicted brain age for each individual. The BAI was calculated as the difference between chronological age (age at scan) and predicted brain age, which represented the relative brain health status of the individual. (B) We used ROIs as 10 functional network regions in the cerebral cortex. These regions consisted of the sensorimotor, FPN, dorsal and ventral attention, default mode, salient, language and auditory, visual network and limbic cortical regions. In addition, we included the Alzheimer's disease signature region to assess whether brain aging in this region was associated with APOE ɛ4. To predict global brain age, the entire cortical surface was used as the ROI. AD, Alzheimer's disease; APOE, apolipoprotein E; BAI, brain age index; FPN, frontoparietal network; GCN, graph-based convolutional network; ROI, region of interest.
Figure 2
Figure 2
BAI distribution in each APOE genotype subgroup in the Korean and UK populations. The values depicted in the bar plot represent the mean BAI, and the values depicted in the error bar represent the standard error of the mean of each group. BAI = 0 indicates that the predicted brain age is equal to the chronological age, with higher values indicating an older-appearing brain than the chronological age. The P-values were obtained by linear regression analyses with APOE genotype (ɛ2 carriers, ɛ4 carriers and ɛ3 homozygotes) as a predictor after controlling for age, sex, hypertension and diabetes in the Korean and UK populations. The P-values for the interaction were obtained by linear regression analyses with the addition of a two-way interaction term (APOE genotype × ethnicity) to the covariates after controlling for age, sex, hypertension and diabetes in the Korean and UK populations. All P-values were modified after FDR correction for multiple comparisons. N represents the number of individuals used in the statistical analyses. APOE, apolipoprotein E; BAI, brain age index; FDR, false discovery rate; KOR, Korea; UK, United Kingdom.
Figure 3
Figure 3
Differential interaction effects between APOE genotype and age on BAI among ethnic groups. BAI = 0 indicates that the chronological age at scan is the same as the predicted brain age, with higher values indicating an older-appearing brain than the chronological age. The P-values for two-way interaction were obtained by linear regression analyses with APOE ɛ4 or APOE ɛ2 carriers [ɛ3 homozygotes (reference)] as a predictor and the addition of each two-way interaction term (APOE ɛ4 carriers × age or APOE ɛ2 carriers × age) to the covariates after controlling for age, sex, hypertension and diabetes in the Korean and UK populations. The P-values for three-way interactions were obtained by linear regression analyses with the addition of each three-way interaction term (APOE ɛ4 carriers × age × ethnicity or APOE ɛ2 carriers × age × ethnicity) to the covariates after controlling for age, sex, hypertension and diabetes in the Korean and UK populations. All P-values were modified after FDR correction for multiple comparisons. N represents the number of individuals used in the statistical analyses. APOE, apolipoprotein E; BAI, brain age index; KOR, Korea; UK, United Kingdom.
Figure 4
Figure 4
Differential interaction effects between APOE genotype and hypertension on BAI among ethnic groups. The values depicted in the bar plot represent the mean BAI, and the values depicted in the error bar represent the standard error of the mean of each group. BAI = 0 indicates that the chronological age at scan is the same as the predicted brain age, with higher values indicating an older-appearing brain than the chronological age. The P-values for two-way interaction were obtained by linear regression analyses with APOE ɛ4 or APOE ɛ2 carriers [ɛ3 homozygotes (reference)] as a predictor and the addition of each two-way interaction term (APOE ɛ4 carriers × hypertension or APOE ɛ2 carriers × hypertension) to the covariates after controlling for age, sex, hypertension and diabetes in the Korean and UK populations. The P-values for three-way interaction were obtained by linear regression analyses with the addition of each three-way interaction term (APOE ɛ4 carriers × hypertension × ethnicity or APOE ɛ2 carriers × hypertension × ethnicity) to the covariates after controlling for age, sex, hypertension and diabetes in the Korean and UK populations. N represents the number of individuals used in the statistical analyses. APOE, apolipoprotein E; BAI, brain age index; HTN, hypertension; KOR, Korea; UK, United Kingdom.
Figure 5
Figure 5
Effects of the three-way interaction among APOE ɛ4, age or hypertension and ethnicity on regional brain age.  T-value maps represent the effect size of the interactions (grey: not significant after FDR correction). The generated maps indicate that age and hypertension had more detrimental effects on regional brain aging in individuals when combined with APOE ɛ4, particularly in the Korean cohort than in the UK cohort. With regard to age, these effects were significant in the language and Alzheimer’s disease signature regions. The effects of hypertension were significant in the visual and limb regions. APOE, apolipoprotein E; KOR, Korea; UK, United Kingdom.

Similar articles

References

    1. Mishra S, Blazey TM, Holtzman DM, et al. Longitudinal brain imaging in preclinical Alzheimer disease: Impact of APOE ɛ4 genotype. Brain J Neurol. 2018;141(6):1828–1839. - PMC - PubMed
    1. Lind J, Larsson A, Persson J, et al. Reduced hippocampal volume in non-demented carriers of the apolipoprotein E epsilon4: Relation to chronological age and recognition memory. Neurosci Lett. 2006;396(1):23–27. - PubMed
    1. Risacher SL, Shen L, West JD, et al. Longitudinal MRI atrophy biomarkers: Relationship to conversion in the ADNI cohort. Neurobiol Aging. 2010;31(8):1401–1418. - PMC - PubMed
    1. Cox SR, Lyall DM, Ritchie SJ, et al. Associations between vascular risk factors and brain MRI indices in UK Biobank. Eur Heart J. 2019;40(28):2290–2300. - PMC - PubMed
    1. Ye BS, Seo SW, Kim GH, et al. Amyloid burden, cerebrovascular disease, brain atrophy, and cognition in cognitively impaired patients. Alzheimers Dement. 2015;11(5):494–503.e3. - PMC - PubMed

LinkOut - more resources