. 2024 Aug 1;4(8):2008-2024.
doi: 10.1158/2767-9764.CRC-24-0077.

Tumor Vessel Normalization via PFKFB3 Inhibition Alleviates Hypoxia and Increases Tumor Necrosis in Rectal Cancer upon Radiotherapy

Affiliations

Tumor Vessel Normalization via PFKFB3 Inhibition Alleviates Hypoxia and Increases Tumor Necrosis in Rectal Cancer upon Radiotherapy

Marcus Edelmann et al. Cancer Res Commun. .

Abstract

Treatment of patients with locally advanced rectal cancer (RC) is based on neoadjuvant chemoradiotherapy followed by surgery. In order to reduce the development of therapy resistance, it is necessary to further improve previous treatment approaches. Recent in vivo experimental studies suggested that the reduction of tumor hypoxia by tumor vessel normalization (TVN), through the inhibition of the glycolytic activator PFKFB3, could significantly improve tumor response to therapy. We have evaluated in vitro and in vivo the effects of the PFKFB3 inhibitor 2E-3-(3-pyridinyl)-1-(4-pyridinyl)-2-propen-1-one (3PO) on cell survival, clonogenicity, migration, invasion, and metabolism using colorectal cancer cells, patient-derived tumor organoid (PDO), and xenograft (PDX). 3PO treatment of colorectal cancer cells increased radiation-induced cell death and reduced cancer cell invasion. Moreover, gene set enrichment analysis shows that 3PO is able to alter the metabolic status of PDOs toward oxidative phosphorylation. Additionally, in vivo neoadjuvant treatment with 3PO induced TVN, alleviated tumor hypoxia, and increased tumor necrosis. Our results support PFKFB3 inhibition as a possible future neoadjuvant addition for patients with RC.

Significance: Novel therapies to better treat colorectal cancer are necessary to improve patient outcomes. Therefore, in this study, we evaluated the combination of a metabolic inhibitor (3PO) and standard radiotherapy in different experimental settings. We have observed that the addition of 3PO increased radiation effects, ultimately improving tumor cell response to therapy.


Conflict of interest statement

N.B. Paul reports grants from the German Research Foundation during the conduct of the study and outside the submitted work. No disclosures were reported by the other authors.

Figures
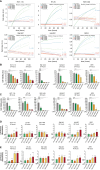
Figure 1
Figure 1
3PO affects normal epithelial and colorectal cancer cell proliferation and viability in a concentration-dependent manner. A, xCELLigence assay performed with HCT-116, HT-29, SW-1463, SW-837, HUVECs, and RPE-1 cells. Real-time cell analysis following treatment with different concentrations of 3PO over a period of 96 hours. Dotted lines indicate the fitted saturation curve in logarithm, n = 3 independent experiments. B and C, CellTiter-Blue assay performed with HCT-116, HT-29, SW-1463, SW-837, HUVECs, and RPE cells treated with different concentrations of 3PO for 24 and 48 hours. D and E, LDH assay performed with HCT-116, HT-29, SW-1463, SW-837, HUVECs, and RPE cells treated with different concentrations of 3PO for 24 and 48 hours. B–E, Data are displayed as means SD, , P < 0.05; ∗∗, P < 0.01; ∗∗∗, P < 0.001; ∗∗∗∗, P < 0.0001. One-way ANOVA was used to calculate statistical significance, n = 3 independent experiments.
Figure 2
Figure 2
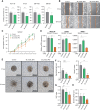
3PO reduces colorectal cancer cell invasion and endothelial cell sprouting capabilities. A, Invasion assay performed with HCT-116, HT-29, SW-1463, and SW-837 cancer cells. Cells were plated in a Boyden multi-well chamber and treated with 10 µmol/L 3PO for a period of 96 hours. Data are displayed as means SD, n = 3. ∗∗, P < 0.01; ∗∗∗∗, P < 0.0001; Student t test. B, Representative pictures of migration assay performed with SW-837 treated with 10 and 25 µmol/L 3PO; 0 and 30 hours after removing culture inserts. C, Cell migration assay quantification of SW-837 treated with different concentrations of 3PO for 48 hours. Data are displayed as means ± SD, n = 3. D, Relative mRNA expression levels of PAXILLIN, CDC42, and WASF-1 in SW-837 cells treated with different concentrations of 3PO after 72 hours. Data are displayed as means SD, , P < 0.05; ∗∗, P < 0.01; one-way ANOVA. E, Representative pictures of cell sprouting assay performed with HUVECs treated with 10 and 20 µmol/L 3PO after 0 and 24 hours. F and G, Sprouting assay quantification of HUVECs upon PFKFB3 inhibition. Sprouting length, vessel number, and EC proliferation analyzed upon treatment with 10 and 20 µmol/L 3PO for a period of 24 hours. H, Sprouting length quantification upon 24 hours of 3PO treatment on already established spheroids. Data are displayed as means SD, n = 3. ∗∗∗, P < 0,001; ∗∗∗∗, P < 00,001; one-way ANOVA.
Figure 3
Figure 3
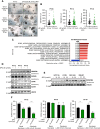
Gene set enrichment analysis of 3PO-treated colon organoids. A, Representative pictures of patient-derived tumor organoids treated with 30 µmol/L 3PO for 24 hours. Scale bars, 200 μm. B, Patient-derived tumor organoid size quantification. Data are displayed as means ± SD. , P < 0.05; one-way ANOVA. C, GSEA with gene sets derived from the GO Biological Process ontology. For the enrichment plot (score curves), refer to Supplementary Fig. S2. FDR, false discovery rate. D and E, Protein expression levels of NDUFB6, ACAD9, and LDHA in colorectal cancer organoids (PT-73, PT-70, and PT-79) and colorectal cancer cell lines treated with 3PO for 24 hours. ACTIN and HSC70 were used as loading control. Uncropped Western blot pictures at Supplementary Fig. S5. In all cases, densitometry analysis is performed using loading control as references. F, Seahorse analysis for extracellular acidification rate performed with patient-derived tumor organoids treated with 10 µmol/L 3PO for 24 hours. Data is displayed as SD. ∗∗∗, P < 0.001; ∗∗∗∗, P < 0.0001.
Figure 4
Figure 4
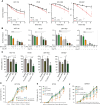
3PO potentializes irradiation effects in colorectal cancer cells. A, Colony formation assay performed with HCT-116, HT-29, SW-1463, and SW-837 cancer cells upon 3PO treatment. Cells treated with DMSO or 2.5 µmol/L 3PO for 4 hours and exposed to indicated doses of RT. Six days (HCT-116), 7 days (HT-29), and 14 days (SW-1463 and SW-837) later, colonies were stained and counted. Data are displayed as means ± SD, n = 3. , P < 0.05; one-way ANOVA. B, Colony formation assays performed with HCT-116, HT-29, SW-1463, and SW-837 cells treated with different concentrations of 3PO for 4 hours, exposed to either RT (6 Gy) or not irradiated and analyzed after 6 days (HCT-116), 7 days (HT-29), 14 days (SW-1463), and 14 days (SW-837) by counting colonies. C, Invasion assay performed with HCT-116, HT-29, SW-1463, and SW-837 cancer cells. Cells were plated in a Boyden multi-well chamber and treated with 10 µmol/L 3PO for 4 hours, subjected to RT (6Gy), and incubated for a period of 96 hours. Data are displayed as means SD, n = 3. ∗∗, P < 0.01; ∗∗∗∗, P < 0.0001; one-way ANOVA. DF Cell migration assay quantification of HCT-116, HT-29, and SW-837 cancer cells upon combinatory treatment. Cells were treated with 3PO for 4 hours and subjected to RT (6 Gy). Data are displayed as means ± SD, n = 3. , P < 0.05; ∗∗, P < 0.01; ∗∗∗, P < 0.001; ∗∗∗∗, P < 0.0001; one-way ANOVA.
Figure 5
Figure 5
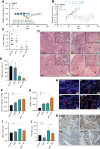
3PO administration in combination with radiotherapy increases tumor necrosis and DNA damage in RC cells in vivo. A, Relative body weight curves of mice in different therapy groups. B, Relative growth curve of rectal PDX tumors upon treatment with vehicle (control; n = 5), 3PO (25 mg/kg; 3×/week; n = 4), RT (1.8 Gy single dose; 5×/week; n = 4), and dual therapy 3PO + RT (25 mg/kg; 3×/week; 1.8 Gy single dose; 5×/week; n = 5). Arrows indicate administration of 3PO and RT. Data are displayed as means ± SEM, , P < 0.05; one-way ANOVA. , P value refers to RT or RT + 3PO compared with control. C, PDX tumor weight. Data are displayed as means ± SD. , P < 0.05; one-way ANOVA. D, Representative H&E staining images of PDX tumors upon treatment with vehicle (control), 3PO, RT, and 3PO + RT. Scale bars, 500 and 100 µm. Arrow heads: representative necrotic areas; asterisks: viable tumor areas. E, Viable tumor area quantification (% of total tumor area). Data are displayed as means SD. , P < 0.05; ∗∗∗∗, P < 0.0001; Student t test. F, Quantification of apoptosis by cleaved caspase-3 staining. Data are displayed as means SD. ∗∗∗, P < 0.001; ∗∗∗∗, P < 0.0001; one-way ANOVA. G, Quantification of DNA fragmentation using TUNEL staining. Data are displayed as means SD. , P < 0.05; ∗∗, P < 0.01; ∗∗∗∗, P < 0.0001; one-way ANOVA. H, Representative images from TUNEL staining in PDX tumors upon treatment with vehicle (control), 3PO, RT, and 3PO + RT. Scale bars, 25 µm. I, Quantification of proliferation using bromodeoxyuridine (BrdU) staining. Data are displayed as means ± SD. , P < 0.05; ∗∗∗∗, P < 0.0001; one-way ANOVA. J, Quantification of PFKFB3 expression in tumor tissue. Data are displayed as means SD. ∗∗∗, P < 0.001; ∗∗∗∗, P < 0.0001; one-way ANOVA. K, Representative images from PFKFB3 staining in PDX tumors upon treatment with vehicle (control), 3PO, RT, and 3PO + RT. Scale bars, 200 µm.
Figure 6
Figure 6
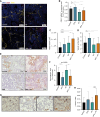
In vivo 3PO administration in combination with radiotherapy induces TVN and alleviates hypoxia in RC. A, Representative images of CD31+αSMA+ co-stained sections of PDX tumors upon treatment with vehicle (comtrol), 3PO, RT, and 3PO + RT. Scale bars, 100 μm. B–D, Quantification of CD31+ αSMA+ area (%), vessel lumen size (µm2), and tumor vessel number in PDX tumors from control, 3PO, RT, and 3PO + RT-treated mice. Data are displayed as means SD. , P < 0.05; ∗∗, P < 0.01; ∗∗∗, P < 0.001, ∗∗∗∗, P < 0.0001; one-way ANOVA. E, Representative images of hypoxic zones stained with pimonidazole (brown staining) from sections of PDX tumors upon treatment with vehicle (control), 3PO, RT, and 3PO + RT. Scale bars, 100 µm. F, Quantification of PIMO+ area (%) in PDX tumors from control, 3PO, RT, and 3PO + RT-treated mice. Data are displayed as means SD. , P < 0.05; ∗∗∗, P < 0.001; one-way ANOVA. G, Representative micrographs of γH2AX-stained sections of PDX tumors from control, 3PO, RT, and 3PO + RT-treated mice. Scale bar, 20 μm. H, DNA damage levels were assessed using γH2AX staining, and treated PDX tumors were immunostained and quantified for γH2AX. Data are displayed as means SD. ∗∗∗∗, P < 0.0001; one-way ANOVA.

References

    1. Bray F, Ferlay J, Soerjomataram I, Siegel RL, Torre LA, Jemal A. Global cancer statistics 2018: GLOBOCAN estimates of incidence and mortality worldwide for 36 cancers in 185 countries. CA Cancer J Clin 2018;68:394–424. - PubMed
    1. Rödel C, Martus P, Papadoupolos T, Füzesi L, Klimpfinger M, Fietkau R, et al. . Prognostic significance of tumor regression after preoperative chemoradiotherapy for rectal cancer. J Clin Oncol 2005;23:8688–96. - PubMed
    1. Kitz J, Fokas E, Beissbarth T, Ströbel P, Wittekind C, Hartmann A, et al. . Association of plane of total mesorectal excision with prognosis of rectal cancer: secondary analysis of the CAO/ARO/AIO-04 phase 3 randomized clinical trial. JAMA Surg 2018;153:e181607. - PMC - PubMed
    1. Martens MH, Maas M, Heijnen LA, Lambregts DMJ, Leijtens JWA, Stassen LPS, et al. . Long-term outcome of an organ preservation program after neoadjuvant treatment for rectal cancer. J Natl Cancer Inst 2016;108:djw171. - PubMed
    1. van der Valk MJM, Hilling DE, Bastiaannet E, Meershoek-Klein Kranenbarg E, Beets GL, Figueiredo NL, et al. . Long-term outcomes of clinical complete responders after neoadjuvant treatment for rectal cancer in the International Watch & Wait Database (IWWD): an international multicentre registry study. Lancet 2018;391:2537–45. - PubMed

Publication types

Substances