. 2024 Jul 23;121(30):e2404000121.
doi: 10.1073/pnas.2404000121. Epub 2024 Jul 15.

Conformational dynamics underlying atypical chemokine receptor 3 activation

Affiliations

Conformational dynamics underlying atypical chemokine receptor 3 activation

Omolade Otun et al. Proc Natl Acad Sci U S A. .

Abstract

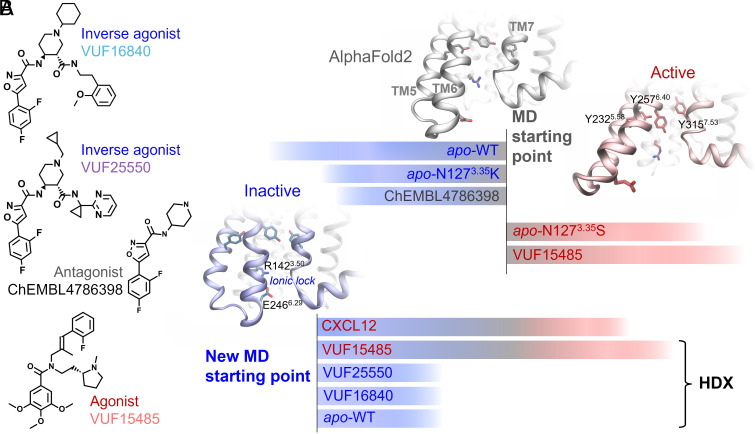
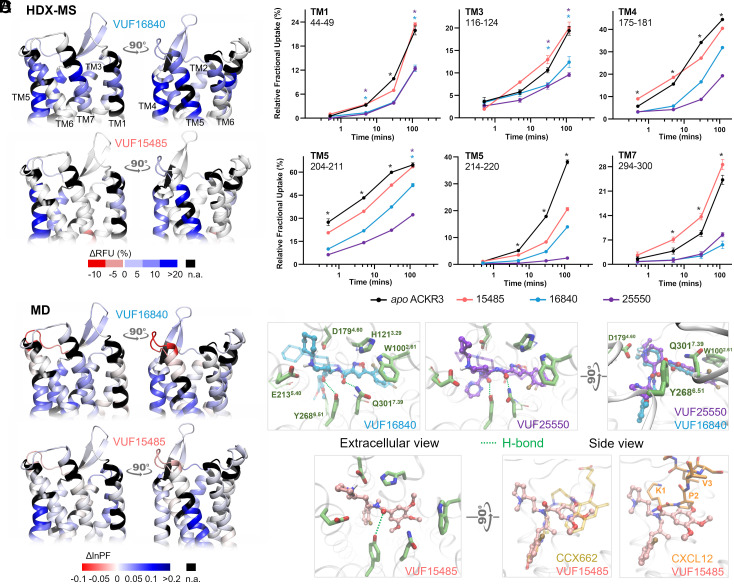
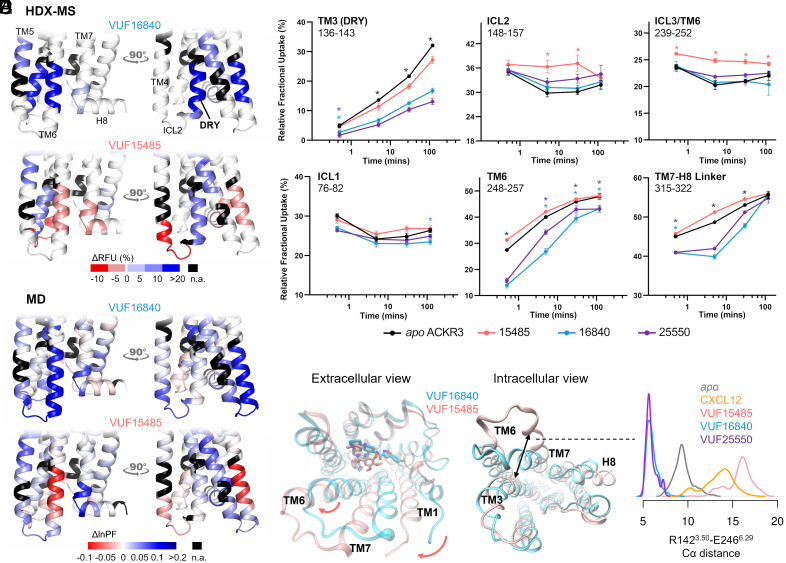
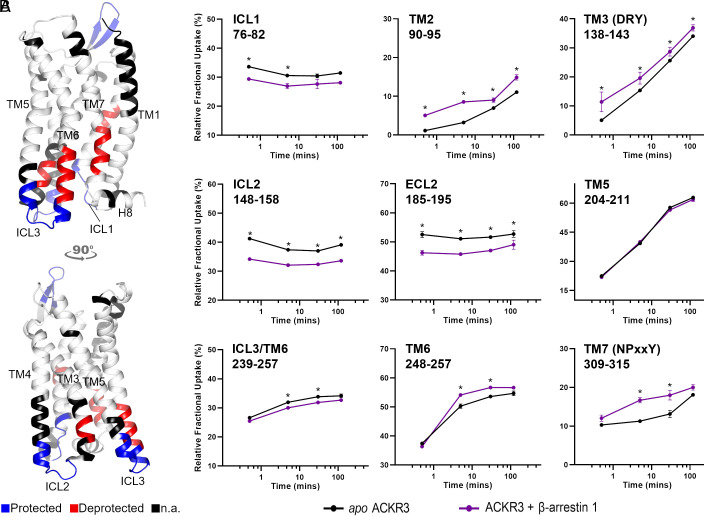
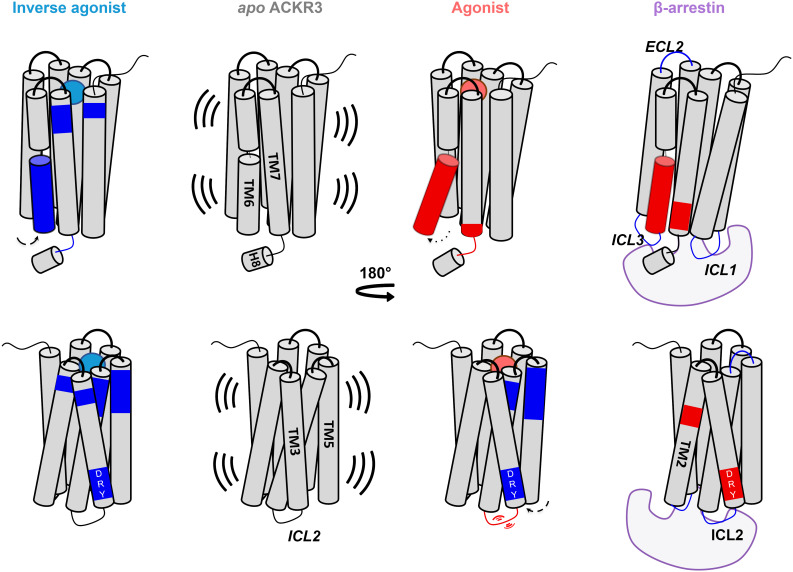
Atypical Chemokine Receptor 3 (ACKR3) belongs to the G protein-coupled receptor family but it does not signal through G proteins. The structural properties that govern the functional selectivity and the conformational dynamics of ACKR3 activation are poorly understood. Here, we combined hydrogen/deuterium exchange mass spectrometry, site-directed mutagenesis, and molecular dynamics simulations to examine the binding mode and mechanism of action of ACKR3 ligands of different efficacies. Our results show that activation or inhibition of ACKR3 is governed by intracellular conformational changes of helix 6, intracellular loop 2, and helix 7, while the DRY motif becomes protected during both processes. Moreover, we identified the binding sites and the allosteric modulation of ACKR3 upon β-arrestin 1 binding. In summary, this study highlights the structure-function relationship of small ligands, the binding mode of β-arrestin 1, the activation dynamics, and the atypical dynamic features in ACKR3 that may contribute to its inability to activate G proteins.

Keywords: ACKR3; GPCR conformational dynamics; HDX-MS; MD simulations.


Conflict of interest statement

Competing interests statement:The authors declare no competing interest.

Figures

Fig. 1.
Fig. 1.
Small-molecule ligands and MD systems studied. (A) Chemical structures of the agonist VUF15485, inverse agonists VUF16840 and VUF25550, and an antagonist ChEMBL4786398. ChEMBL4786398 is a substructure of the inverse agonists, which was used here to facilitate the binding mode prediction. (B) Two batches of MD simulations from different starting structures. Initially, five simulations were performed starting from the AF model, including WT ACKR3, a constitutively active mutant (N1273.35S), an inactive mutant (N1273.35K) in apo form, as well as WT ACKR3 bound to VUF15485 and ChEMBL4786398. The agonist-bound receptor and the constitutively active mutant evolved toward active states. The other three systems evolved toward inactive states featured by TM6 inward movements and the TM6-TM3 ionic lock formation. The final inactive state of apo WT ACKR3 was then used as the new starting point to investigate the receptor conformational changes induced by agonists and inverse agonists. HDX protection factors were calculated from the new trajectories using the apo form as a reference state. These were compared with the HDX-MS data to validate the MD sampling.
Fig. 2.
Fig. 2.
Ligand binding at the level of ACKR3 orthosteric pocket. (A) Schematic representation of the % differential relative fractional uptake data (apo ACKR3—bound ACKR3) mapped onto the upper part of the AF model of ACKR3 (for clarity, we did not include the N terminus). Relative fractional uptake is calculated by dividing the experimental uptake (Da) of a peptide by its maximum possible uptake. This depicts reproducible and statistically significant ΔHDX in response to inverse agonists small ligands represented by VUF16840 (VUF25550 giving a similar profile), or agonist small ligand VUF15485. Black regions represent regions with no sequence coverage. Ligand-induced reduction in deuterium uptake is represented in blue while ligand-induced increase in deuterium uptake is in red, according to the scale. (B) Associated deuterium uptake plots showing the relative uptake for peptides from apo or ligand-bound ACKR3 across several deuteration time points and are representative of the extracellular region as indicated at the Top of the plot. Statistically significant changes were determined using Deuteros 2.0 software (48) (P ≤ 0.01): statistically significant time points for the different ligands are represented by a colored star corresponding to the ligand in question (pink, blue, and purple for VUF15485, VUF16840, and VUF25550 respectively). Black stars depict time points that are statistically significant for all three ligands. Uptake plots are the average and SD of three technical replicates from the same biological preparation of ACKR3. (C) Calculated differential ln HDX protection factor changes (ΔlnPF) mapped on the AF model. Per-residue lnPF was first calculated for each MD trajectory of ACKR3 in apo and ligand-bound forms. The difference between the apo and bound forms gave the per-residue ΔlnPF for each ligand. For comparison with the HDX data, per-peptide ΔlnPF was calculated by averaging the per-residue ΔlnPF over the peptides obtained in the HDX-MS experiments for each ligand (see Materials and Methods and Dataset S3 for details). (D) Predicted ligand binding mode. The inverse agonists could bind in both enantiomers of the piperidine group (solid and transparent depictions). They showed nearly identical binding poses except that the cyclopropyl-pyrimidine of VUF25550 was more mobile. The agonist VUF15485 formed ionic interactions with D1794.60 via its 1-methylpyrrolidine. The rest of VUF15485 largely overlaps with CCX662 as shown in the superimposition to PDB 7SK8. It also overlaps with the N terminus of CXCL12.
Fig. 3.
Fig. 3.
Allosteric conformational changes of ACKR3 activation. (A) Schematic representation of the % differential relative fractional uptake data (apo ACKR3—bound ACKR3) mapped onto the lower part of the AF model of ACKR3 (for clarity, we did not include the C- terminus). Relative fractional uptake is calculated by dividing the experimental uptake (Da) of a peptide by its maximum possible uptake. Scheme depicts reproducible and statistically significant ΔHDX in response to inverse agonists small ligands represented by VUF16840 (VUF25550 giving a similar profile), or agonist small ligand VUF15485. Black regions represent regions with no sequence coverage. Ligand-induced reduction in deuterium uptake is represented in blue while ligand-induced increase in deuterium uptake is in red, according to the scale. (B) Associated deuterium uptake plots showing the relative uptake for peptides from apo or ligand-bound ACKR3 across several deuteration time points and are representative of the intracellular region as indicated at the Top of the plot. Statistically significant changes were determined using Deuteros 2.0 software (48) (P ≤ 0.01): statistically significant time points for the different ligands are represented by a colored star corresponding to the ligand in question (pink, blue, and purple for VUF15485, VUF16840, and VUF25550 respectively). Black stars depict time points that are statistically significant for all three ligands. Uptake plots are the average and SD of 3 technical replicates from the same biological preparation of ACKR3. (C) Calculated ΔlnPF from the MD simulations, mapped on the AF model. (D) Proposed mechanism of activation. The bulky trimethoxybenzamide group of VUF15485 induces a “twist” of the 7TM bundle around the orthosteric pocket, which allosterically triggers TM6 opening on the intracellular side. (E) Probability density distribution of the ionic-lock-residue Cα distances during the MD simulations.
Fig. 4.
Fig. 4.
β-Arrestin 1 binding to ACKR3. (A) Schematic representation of the protected (blue) and deprotected (red) regions of ACKR1 in the presence of β-arrestin 1 mapped onto the AF model of ACKR3 (for clarity, we did not include the N- and C- termini). This depicts reproducible and statistically significant changes in deuterium uptake in the presence of β-arrestin 1. Black regions represent regions with no sequence coverage. (B) Associated deuterium uptake plots showing the relative uptake for peptides from apo or arrestin-bound ACKR3 across several deuteration time points and are representative of the region as indicated at the Top of the plot. Statistically significant changes are represented by black stars and were determined using Deuteros 2.0 software (48) (P ≤ 0.01). Uptake plots are the average and SD of three technical replicates from the same biological preparation of ACKR3.
Fig. 5.
Fig. 5.
Scheme summarizing changes induced by binding of an agonist, inverse agonist and β-arrestin 1 to ACKR3. Activation through agonist binding induces an allosteric opening of TM6 and resulted in increased flexibility and/or solvent exposure (red regions) of peptides spanning TM6, TM7, and ICL2. Inverse agonists resulted in decreased flexibility and/or solvent exposure (blue regions) through receptor constraint. β-arrestin 1 binding reduced the deuteration of all intracellular loops and resulted in increased deuteration of the NPxxY motif (TM7), DRY motif (TM3), and the conserved sodium binding site D902.50 (TM2). Arrows depict movements for the respective helices in response to different binders. Activation is associated with outward movement of TM6 and inward movement of TM5 which contributes to protection of the DRY motif in the presence of the agonist.

References

    1. Griffith J. W., Sokol C. L., Luster A. D., Chemokines and chemokine receptors: Positioning cells for host defense and immunity. Annu. Rev. Immunol. 32, 659–702 (2014). - PubMed
    1. Bonecchi R., Graham G. J., Atypical chemokine receptors and their roles in the resolution of the inflammatory response. Front. Immunol. 7, 224 (2016). - PMC - PubMed
    1. Balabanian K., et al. , The chemokine SDF-1/CXCL12 binds to and signals through the orphan receptor RDC1 in T lymphocytes. J. Biol. Chem. 280, 35760–35766 (2005). - PubMed
    1. Meyrath M., et al. , The atypical chemokine receptor ACKR3/CXCR7 is a broad-spectrum scavenger for opioid peptides. Nat. Commun. 11, 3033 (2020). - PMC - PubMed
    1. Smit M. J., et al. , The CXCL12/CXCR4/ACKR3 axis in the tumor microenvironment: Signaling, crosstalk, and therapeutic targeting. Annu. Rev. Pharmacol. Toxicol. 61, 541–563 (2021). - PubMed

LinkOut - more resources