. 2024 Jul 23;121(30):e2321972121.
doi: 10.1073/pnas.2321972121. Epub 2024 Jul 15.

Mitochondrial antioxidants abate SARS-COV-2 pathology in mice

Affiliations

Mitochondrial antioxidants abate SARS-COV-2 pathology in mice

Joseph W Guarnieri et al. Proc Natl Acad Sci U S A. .

Abstract

Severe Acute Respiratory Syndrome Coronavirus 2 (SARS-CoV-2) infection inhibits mitochondrial oxidative phosphorylation (OXPHOS) and elevates mitochondrial reactive oxygen species (ROS, mROS) which activates hypoxia-inducible factor-1alpha (HIF-1α), shifting metabolism toward glycolysis to drive viral biogenesis but also causing the release of mitochondrial DNA (mtDNA) and activation of innate immunity. To determine whether mitochondrially targeted antioxidants could mitigate these viral effects, we challenged mice expressing human angiotensin-converting enzyme 2 (ACE2) with SARS-CoV-2 and intervened using transgenic and pharmacological mitochondrially targeted catalytic antioxidants. Transgenic expression of mitochondrially targeted catalase (mCAT) or systemic treatment with EUK8 decreased weight loss, clinical severity, and circulating levels of mtDNA; as well as reduced lung levels of HIF-1α, viral proteins, and inflammatory cytokines. RNA-sequencing of infected lungs revealed that mCAT and Eukarion 8 (EUK8) up-regulated OXPHOS gene expression and down-regulated HIF-1α and its target genes as well as innate immune gene expression. These data demonstrate that SARS-CoV-2 pathology can be mitigated by catalytically reducing mROS, potentially providing a unique host-directed pharmacological therapy for COVID-19 which is not subject to viral mutational resistance.

Keywords: EUK8; SARS-CoV-2; antioxidant therapy; mCAT; mitochondria.


Conflict of interest statement

Competing interests statement:D.C.W. is on the scientific advisory boards of Pano Therapeutics, Inc. and Medical Excellent Capital, and published a manuscript with S.E. Schriner in 2022.

Figures
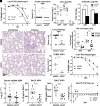
Fig. 1.
Fig. 1.
Systemic expression of mCAT in SARS-CoV-2 infected hACE2 mice decreases disease severity. (A–K) Mice were infected intranasally with 2.5 × 10⁴ PFU WA1, across three independent experiments (hACE2 versus hACE2-mCAT (mCAT), 2 DPI n = 34/22; 3 to 4 DPI 25/22; 5 to 6 DPI 3/3; mock-infected 11/12): (A) weight loss, (B) health status scoring of infected mice, (C) high-accuracy large-scale object (HALO) analysis of the percentage of 2-N positive stained cells, and (D) intensity of 2-N staining in mouse lungs collected at 2, 4, and 5 to 6 DPI across two independent experiments (hACE2 versus hACE2-mCAT, 2 DPI n = 9/7; 4 DPI 10/8; 5 to 6 DPI 2/2; mock-infected 5/6). (E) Hematoxylin and eosin (H&E)-stained lung samples across two independent experiments (hACE2 versus hACE2-mCAT, 4 DPI 10/8; mock-infected 5/6). (F) Pathological scoring of lung histology staining (E) at 4 DPI. (G) HALO analysis of the percentage of terminal deoxynucleotidyl transferase dUTP nick end labeling (TUNEL)-stained positive lung cells at 4 DPI (hACE2 versus hACE2-mCAT, 4 DPI 4/3; mock-infected 3/3). (H) HALO analysis of the percentage of HIF-1α-stained positive cells, across two independent experiments (hACE2 versus mCAT, 2 DPI n = 9/7; 4 DPI 10/8; 5 to 6 DPI 2/2; mock-infected 5/6); representative images of anti-HIF-1α antibody stained infected lungs stained presented in SI Appendix, Fig. S3. (I) mCAT effects on relative mtDNA serum levels of infected versus uninfected mice at 4 DPI determined by RT-PCR with a probe specific for MT-ND5 across two independent experiments (hACE2 versus hACE2-mCAT, 4 DPI 17/17; mock-infected 4/4). DNA was isolated from equal amounts of protein. (J) mCAT effects on relative IL-1β levels determined in BALF by ELISA in mice 4 DPI across two independent experiments (hACE2 versus hACE2-mCAT, 4 DPI 14/14; mock-infected 4/4). (K) mCAT effects on relative INFβ levels determined as in J. (L) Weight loss of mice nasally infected with 1.0 × 10⁴ PFU WA1 (hACE2 versus hACE2-mCAT 12/8). (M) Weight loss of mice nasally infected with 5.0 × 10⁵ PFU Omicron BA.1 (hACE2 versus hACE2-mCAT, 3 DPI n = 16/23, 14 DPI = 6/8, mock-infected 3/3). Error bars represent STD, and statistically significant data are indicated with asterisks (*).
Fig. 2.
Fig. 2.
RNAseq analysis of lung mRNAs in SARS-CoV-2 infected hACE2 versus hACE2-mCAT mice revealed that mCAT dampened virus induced metabolic reprogramming and innate immune activation. Analysis of RNA transcripts from mouse lung assessed in five SARS-CoV-2 hACE2-infected mice, five hACE2-mCAT infected mice, three uninfected hACE2 mice, and three uninfected hACE2-mCAT mice collected at 4 DPI. Bar plots for statistically significant changes (FDR < 0.14). (A) Effect of mCAT expression showing striking reversal of viral OXPHOS inhibition (1) together with partial reversal of viral inhibition of TCA and peroxisomal gene suppression, determined by GSEA for infected versus uninfected lung samples, ranked by nominal enrichment score (NES) (29). (B) Heat map representation of mCAT effects on SARS-CoV-2 infected hACE2 and hACE2-mCAT mice on lung HIF and glycolytic mRNA levels, log-2 fold (L2FC). (C) Effect of mCAT expression on lung innate immune gene expression. (D) Gene ontology (GO) pathway analysis of RNA transcripts demonstrating the striking reversal of viral innate immune gene induction by mCAT expression. (E) Volcano plot of RNA transcript levels of hACE2-infected versus uninfected lung samples. (F) Volcano plot of RNA transcript levels of hACE2-mCAT infected versus uninfected lung samples. (G) Heat map representation of mCAT effects on SARS-CoV-2 infected hACE2 and hACE2-mCAT mice on innate immune and integrated stress response (ISR) mRNA levels, L2FC. (H) Heat map representations of mCAT effects SARS-CoV-2 infected hACE2 and hACE2-mCAT mice on selected mitochondrial, NF-κB, and interferon mRNA levels, L2FC. (I) GO pathway analysis of RNA transcripts demonstrating the striking mCAT inhibition of cell death pathways. An O on a line indicates that the difference between with versus without treatment did not change sufficiently to reach FDR < 0.25 or −log10(adj-P value) >1.3.
Fig. 3.
Fig. 3.
Systemic expression of mitochondrial cocktail (MitoCocktail) and EUK8 on SARS-CoV-2 infected hACE2 mice decreases disease severity. (A–K) hACE2 mice were infected intranasally with 2.5 × 10⁴ PFU of the WA1. (AD) dH2O/EUK8/MitoCocktail/MitoCocktail+EUK8, 23/22/7/7 infected mice, 6/6/3/3 mock-infected mice, dH2O versus EUK8 experiments were assessed across two independent experiments: (A and B) Weight loss. (C) pathological scoring 1 to 5. (D) Survival analysis. (E and F) SARS-CoV-2 ORF1ab and viral N structural protein (2-N) mRNA levels in lungs 6 DPI determined by RT-PCR, dH2O/EUK8, 13/10; mock-infected 6/6, error bars represent STD and statistically significant data is indicated with asterisks (*): (E) ORF1ab, (F) 2-N. (G) Quantification of lung histopathology assessed by H&E staining at 6 DPI, samples collected across two independent experiments. (H) Representative H&E-stained lung samples of vehicle and EUK8-treated hACE2 mice at 6 DPI. (I) Serum levels of mtDNA determined at 6 DPI DNA by RT-PCR with an MT-ND5 probe normalized to serum volume. (J) IL-1β levels determined by ELISA in BALF at 6 DPI, IL-1β was undetectable in uninfected mice. (K) Lung HIF-1α protein levels determined by ELISA at 6 DPI.
Fig. 4.
Fig. 4.
RNAseq analysis of lung mRNAs of SARS-CoV-2 infected hACE2 mice versus EUK8-treated hACE2 mice dampened viral induced metabolic reprogramming and innate immune activation. Analysis of RNA transcripts from mouse lung assessed in five SARS-CoV-2 hACE infected mice, five hACE2-EUK8-treated mice, three uninfected hACE2 mice, and three uninfected hACE2-EUK8 mice collected at 4 DPI. Bar plots for statistically significant changes (FDR < 0.15). (A) Effect of EUK8 on lung transcripts showing the striking reversal of viral OXPHOS (1) and peroxisome gene expression determined by GSEA for infected versus uninfected lung samples, ranked by NES, nominal enrichment score (29). (B) Heat map altered HIF and glycolytic mRNA levels in SARS-CoV-2 infected hACE2 and EUK8-treated hACE2 mouse lungs, log-2 fold (L2FC). (C) Effect of EUK8 treatment on innate immune gene expression. (D) GO pathway analysis of RNA transcripts demonstrating the mitigation of viral innate immune gene induction by EUK8 treatment. (E) Volcano plot of RNA transcript levels of hACE2-infected versus uninfected lung samples. (F) Volcano plot of RNA transcript levels of EUK8-treated hACE2-infected versus uninfected lung samples. (G) Heat map representation of SARS-CoV-2-infected hACE2 versus EUK8-treated infected hACE2 mice on innate immune and ISR mRNA levels, L2FC. (H) Heat map representation of SARS-CoV-2-infected hACE2 and EUK8-treated hACE2 mice of selected mitochondrial, NF-κB, and interferon mRNA levels, L2FC. (I) GO pathway analysis of RNA transcripts demonstrating the EUK8 inhibition of cell death pathways. An O on a line indicates that the difference between with versus without treatment did not change sufficiently to reach FDR < 0.25 or −log10(adj-P value) >1.3.
Fig. 5.
Fig. 5.
Proposed mitochondrial bioenergetic pathophysiology of SARS-CoV-2 infection and its mitigation by the mCAT transgene and EUK8 treatment. SARS-CoV-2 inhibits mitochondrial OXPHOS at both the protein and transcriptional levels 1) and floods the cell and mitochondria with Ca++ via the viroporins E and Orf3a 2) resulting in increased mitochondrial ROS production. Left Arm: The increased mROS stabilizes and activates HIF-1α which up-regulates glycolysis and down-regulates OXPHOS redirecting substrates from oxidative energy production to provide substates for viral propagation. Middle and Right Arm: Increased mROS and mitochondrial Ca++ activated the mtPTP to release fragmented and oxidized mtDNA into the cytosol. Middle Arm: cytosolic mtDNA interacts with TLR9, cGAS of the cGAS-STING pathway, and ZBP1 which interacts with MAVS molecule to activate the NFκB and interferon inflammation pathways. Right Arm: Oxidized mtDNA fragments interact with the NLRP3 inflammasome to activate CASP1 which processed pro-IL-1β to IL-1β which is secreted and activates the inflammation pathways. CASP1 also processes the GSDMD precursor to activated GSDMD which initiates pyroptosis and cell death.

References

    1. Guarnieri J. W., et al. , Core mitochondrial genes are down-regulated during SARS-CoV-2 infection of rodent and human hosts. Sci. Transl. Med. 15, eabq1533 (2023). - PMC - PubMed
    1. Guarnieri J. W., et al. , SARS-COV-2 viroporins activate the NLRP3-inflammasome by the mitochondrial permeability transition pore. Front. Immunol. 14, 1064293 (2023). - PMC - PubMed
    1. Cortese M., et al. , Integrative imaging reveals SARS-CoV-2-induced reshaping of subcellular morphologies. Cell Host Microbe. 28, 853–866 e855 (2020). - PMC - PubMed
    1. Wang P., et al. , A cross-talk between epithelium and endothelium mediates human alveolar-capillary injury during SARS-CoV-2 infection. Cell Death Dis. 11, 1042 (2020). - PMC - PubMed
    1. Codo A. C., et al. , Elevated glucose levels favor SARS-CoV-2 infection and monocyte response through a HIF-1α/glycolysis-dependent axis. Cell Metab. 32, 437–446.e5 (2020). - PMC - PubMed

MeSH terms