. 2024 Oct 8;8(19):4997-5011.
doi: 10.1182/bloodadvances.2023011145.

A brain organoid/ALL coculture model reveals the AP-1 pathway as critically associated with CNS involvement of BCP-ALL

Affiliations

A brain organoid/ALL coculture model reveals the AP-1 pathway as critically associated with CNS involvement of BCP-ALL

Philip Gebing et al. Blood Adv. .

Abstract

Central nervous system (CNS) involvement remains a clinical hurdle in treating childhood B-cell precursor acute lymphoblastic leukemia (BCP-ALL). The disease mechanisms of CNS leukemia are primarily investigated using 2-dimensional cell culture and mouse models. Given the variations in cellular identity and architecture between the human and murine CNS, it becomes imperative to seek complementary models to study CNS leukemia. Here, we present a first-of-its-kind 3-dimensional coculture model combining human brain organoids and BCP-ALL cells. We noticed significantly higher engraftment of BCP-ALL cell lines and patient-derived xenograft (PDX) cells in cerebral organoids than non-ALL cells. To validate translatability between organoid coculture and in vivo murine models, we confirmed that targeting CNS leukemia-relevant pathways such as CD79a/Igα or C-X-C motif chemokine receptor 4-stromal cell-derived factor 1 reduced the invasion of BCP-ALL cells into organoids. RNA sequencing and functional validations of organoid-invading leukemia cells compared with the noninvaded fraction revealed significant upregulation of activator protein 1 (AP-1) transcription factor-complex members in organoid-invading cells. Moreover, we detected a significant enrichment of AP-1 pathway genes in PDX ALL cells recovered from the CNS compared with spleen blasts of mice that had received transplantation with TCF3::PBX1+ PDX cells, substantiating the role of AP-1 signaling in CNS disease. Accordingly, we found significantly higher levels of the AP-1 gene, jun proto-oncogene, in patients initially diagnosed as CNS-positive BCP-ALL compared with CNS-negative cases as well as CNS-relapse vs non-CNS-relapse cases in a cohort of 100 patients with BCP-ALL. Our results suggest CNS organoids as a novel model to investigate CNS involvement and identify the AP-1 pathway as a critical driver of CNS disease in BCP-ALL.


Conflict of interest statement

Conflict-of-interest disclosure: The authors declare no competing financial interests.

Figures

None
Graphical abstract
Figure 1.
Figure 1.
Establishment of cerebral organoids to model CNS invasion of leukemia cells. (A-C) A graphical illustration of the workflow showing differentiation of the mature cerebral organoids from (low passage) human iPSCs, and cocultured with leukemic or HSPCs controls carrying a fluorescent (CFSE) dye.
Figure 2.
Figure 2.
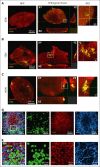
Deep invasion of TCF3::PBX1+ BCP-ALL cells into cerebral organoids occurs after 14 days of coculture. Cerebral organoids were cultured with (10 000) CFSE-stained TCF3::PBX1+ PDX cells. (A-C) Maximum intensity projections (MIP) are shown on the left-hand column, showing the DAPI (4’,6-diamidino-2-phenylindole) and monomeric tag red fluorescent protein tandem colocalizing with the cells’ CFSE signal. Orthogonal views on the right-hand column indicate the position of cells (green dots) by visualizing the organoid in 3 dimensions (XY, ZY, and ZX). Areas of leukemia cells found on the surface or within the organoid itself are shown in the orthogonal viewer and enhanced by the region of interest (ROI) image. (D) Subsurface CFSE-stained leukemia cells localize with other neuronal cell types. (D-E) Collapsed z-stack and merge of CFSE, DAPI, and anti-MAP2 staining are shown. Magnified images provide enhanced details of the leukemia cells colocalizing with the organoid volume (ROI), indicating that the leukemic cells sit in a complex network of neurons and their axonal/dendritic connections. Scale bars: 10 μm, 50 μm, and 500 μm.
Figure 3.
Figure 3.
BCP-ALL cells robustly engraft into cerebral organoids as compared with healthy CD34+ HSPCs. (A-B) Cerebral organoids were cocultured with 10 000 CFSE-stained cells, either cord blood–isolated CD34+ HSPCs or leukemia cells, for 14 days. Enlarged images of cell clusters are shown by white squares (ROI). Scale bars: 25 μm and 250 μm. (C-D) Cerebral organoids were cocultured with 10 000 CFSE-stained leukemia cells or CD34+ HSPCs. After 14 days of coculture period, the total cell counts within the invaded organoids were quantitatively assessed by enumerating CFSE-positive cells in each organoid, using Imaris image processing software. Statistical analysis was conducted to compare the HSPCs, K562, and KCL22 controls to every other condition using the unpaired 2-tailed t test (n = 3 replicates). (E) Visualization of leukemia cell distribution within organoids using Matplotlib-based image analysis. 3D representation illustrates the relative distribution of leukemia cells within the organoid structure. Distances exceeding 10 μm are considered boundaries for deep invasion. (F) Depicted are number of cells that have invaded beyond 10-μm depth in the organoid 3D space (n = 3 replicates, unpaired 2-tailed t test).
Figure 4.
Figure 4.
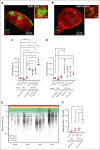
Inhibition of CD79a/Igα or CXCR4–SDF-1 interaction ablates TCF3::PBX1+ leukemia cells’ engraftment into cerebral organoids. (A) shRNA-miR30 (control) or shRNA-mediated CD79a knockdown (KD) 697 cells (10 000 cells) were seeded in a coculture assay with cerebral organoids for 14 days. Both conditions were analyzed using the unpaired 2-tailed t test, 697 CD79a vs 697 shRNA-miR30 (P = .0034). (B-C) To demonstrate the expression of stromal cell-derived factor in our cerebral organoids, we stained cerebral organoids with anti-SDF-1 antibody. A single z-slice of a complete 3D stack is shown above, including a portion of the image in the ROI. Immunofluorescence staining revealed colocalization with anti-MAP2 signal in cerebral organoids and the expression of SDF-1 significantly increased in neurons. (D) 697 wild-type (10 000) cells pretreated for 12 hours with (44 nM) plerixafor or with vehicle control in a coculture assay with cerebral organoids for 14 days. Both conditions were analyzed using the unpaired 2-tailed, vehicle treated vs plerixafor treated 697 cells (P = .0155). Scale bars: 50 μm, 100 μm, and 500 μm.
Figure 5.
Figure 5.
TCF3::PBX1+ leukemia cells upregulate AP-1 transcription factor upon infiltration into cerebral organoids. (A-B) Volcano plot showing significantly (false discovery rate [FDR] ˂ 0.05; log2(FC) < −1 or log2(FC) ˃ 1) upregulated or downregulated genes from RNA sequencing data of (A) cerebral organoid–infiltrated 697 and (B) Kasumi 2 (K2) cells compared with the noninfiltrated fraction. (C-D) 697 and K2 cell lines isolated from organoid cocultures were stained for FOSB and FOS and measured using flow cytometry. The mean fluorescence intensity (MFI) is plotted for both infiltrating (leukemia cells inside organoids) and suspension (noninfiltrated) cells. Statistical analysis was performed using the unpaired 2-tailed t test (FOSB, n = 3; FOS, n = 4). (E) 697 cells transduced with either the AP-1 construct (697-AP1) or a corresponding negative control (697-Neg) were cocultured in the presence (+ORG) or absence (−ORG) of organoids, respectively. Cells (10 000) were seeded from each condition in triplicate. Live cell imaging revealed an early and consistent rise in green fluorescent protein (GFP) fluorescence exclusively within the 697–AP-1 cells when cocultured with organoids. 697 wild-type cells (697 WT culture) and normal culturing media were included as nonfluorescent controls. Significance between 697–AP-1 + ORG vs 697–AP-1 − ORG was calculated using 2-way analysis of variance (697 AP1 + ORG vs 697 AP1 − ORG, n = 3, P < .0001. (F) The total track length covered by 697 cells, with or without T-5224 treatment was measured by time-lapse imaging for 20 hours, and analysis was performed via TrackMate plugin. The results depict the total track length covered by the cells. Statistical analysis was performed using the unpaired 2-tailed t test (dimethyl sulfoxide [DMSO] vs 5 μM, n = 3, P < .0001). FC, fold change.
Figure 6.
Figure 6.
AP-1 family members act downstream CD79a and are selectively upregulated in CNS leukemia. (A) Volcano plot showing significantly (FDR ˂0.05; log2(FC) < −1 or log2(FC) ˃ 1) regulated genes from RNA sequencing data of BCP-ALL PDX cells recovered from the CNS compared with PDX cells isolated from the spleen (SP). (B) Heat map representation of the top differentially regulated AP-1 pathway genes in CNS relative to SP (blue: downregulated; red: upregulated; samples are represented in columns whereas rows show genes. (C) Fast gene set enrichment analysis on the RNA sequencing data of CNS-isolated PDX cells vs spleen and cerebral organoid–infiltrated 697 and K2 cells vs respective noninfiltrated fraction, displaying significantly regulated gene set signatures. (D) Validation of upregulation of AP-1 genes via qRT-PCR in 7 PDX ALL samples isolated from the SP vs CNS, Mann-Whitney U test, graphs show mean with standard error; ∗P ≤ .05, ∗∗P ≤ .01, and ∗∗∗P ≤ .001. (E) The effect of shRNA-mediated knock down of CD79a (shCD79a) on the expression of AP-1 genes compared with control shRNA (shCtr) in an TCF3::PBX1+ PDX sample as determined via qRT-PCR, Mann-Whitney U test, graphs show mean with standard error. ∗P ≤ .05, ∗∗P ≤ .01, and ∗∗∗P ≤ .001. (F-G) CD79a, JUN, and other genes mRNA levels (all normalized to mRNA levels in the 697 cell line) were measured in diagnostic bone marrow (BM) samples in a selected cohort of 100 pediatric patients with BCP-ALL of mixed cytogenetics, which contained 28 patients with CNS-positive disease matched to 72 patients with CNS-negative disease of corresponding sex and age. (F) Bivariate correlation analysis between CD79a expression and JUN, FOS, and FOSB in patients with BCP-ALL diagnosed as CNS positive (CNS+) vs CNS-negative (CNS), 2-sided t test. (G) JUN-expression levels in patients with BCP-ALL diagnosed as CNS+ vs CNS, 2-sided t test. (H) mRNA levels of JUN were detected within patients with BCP-ALL in a cohort enriched for patients who are CNS+ and analyzed for association with the occurrence of relapse. Depicted are mRNA levels normalized to calibrator of n = 83 patients without CNS relapse vs n = 17 patients with CNS relapse, 2-tailed Mann-Whitney U test, ∗P < .05. Glyceraldehyde-3-phosphate dehydrogenase (GAPDH) mRNA levels were used for relative quantification of the mRNA transcript. AU, arbitrary units; FC, fold change.

References

    1. Thastrup M, Duguid A, Mirian C, Schmiegelow K, Halsey C. Central nervous system involvement in childhood acute lymphoblastic leukemia: challenges and solutions. Leukemia. 2022;36(12):2751–2768. - PMC - PubMed
    1. Walker DA, Meijer L, Coyle B, Halsey C. Leptomeningeal malignancy of childhood: sharing learning between childhood leukaemia and brain tumour trials. Lancet Child Adolesc Health. 2020;4(3):242–250. - PubMed
    1. Pui C-H, Evans WE. Treatment of acute lymphoblastic leukemia. N Eng J Med. 2006;354(2):166–178. - PubMed
    1. Hanmantgad S, Khakoo Y. Swaiman’s Pediatric Neurology. Elsevier; 2017. System cancer and the central nervous system involvement; pp. 1017–1020.
    1. Halsey C, Buck G, Richards S, Vargha-Khadem F, Hill F, Gibson B. The impact of therapy for childhood acute lymphoblastic leukaemia on intelligence quotients; results of the risk-stratified randomized central nervous system treatment trial MRC UKALL XI. J Hematol Oncol. 2011;4(1):42. - PMC - PubMed

Publication types

MeSH terms