Randomized Controlled Trial
. 2024 Jul 16:12:RP87030.
doi: 10.7554/eLife.87030.

Anti-inflammatory therapy with nebulized dornase alfa for severe COVID-19 pneumonia: a randomized unblinded trial

Affiliations
Randomized Controlled Trial

Anti-inflammatory therapy with nebulized dornase alfa for severe COVID-19 pneumonia: a randomized unblinded trial

Joanna C Porter et al. Elife. .

Abstract

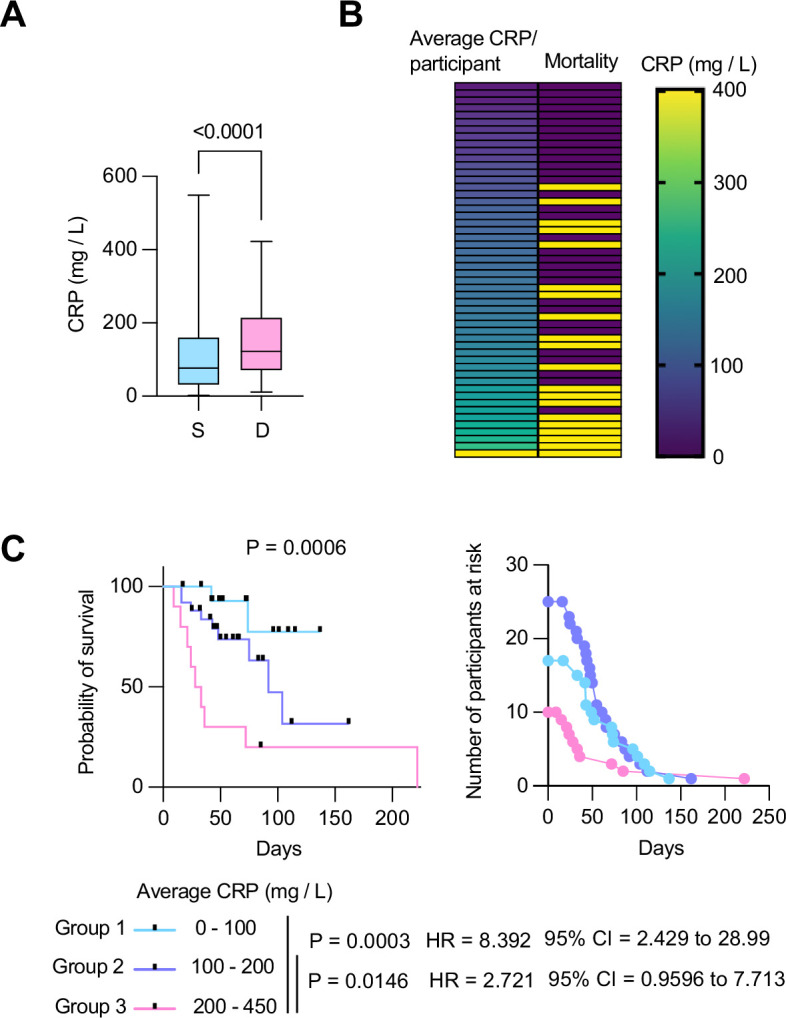
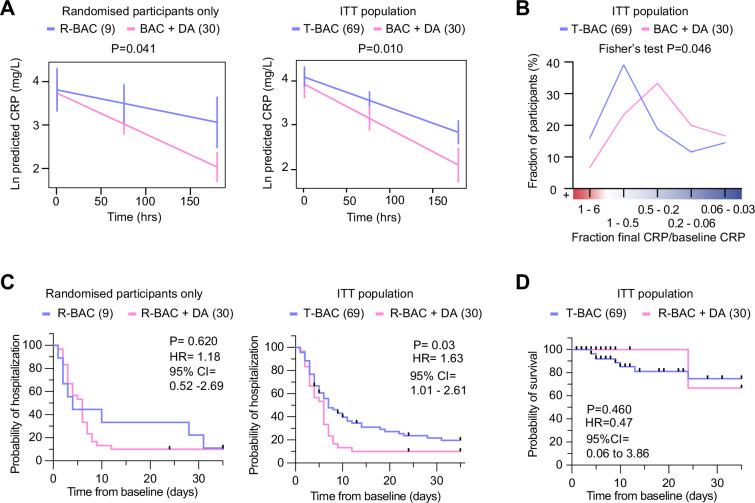
Background: Prinflammatory extracellular chromatin from neutrophil extracellular traps (NETs) and other cellular sources is found in COVID-19 patients and may promote pathology. We determined whether pulmonary administration of the endonuclease dornase alfa reduced systemic inflammation by clearing extracellular chromatin.

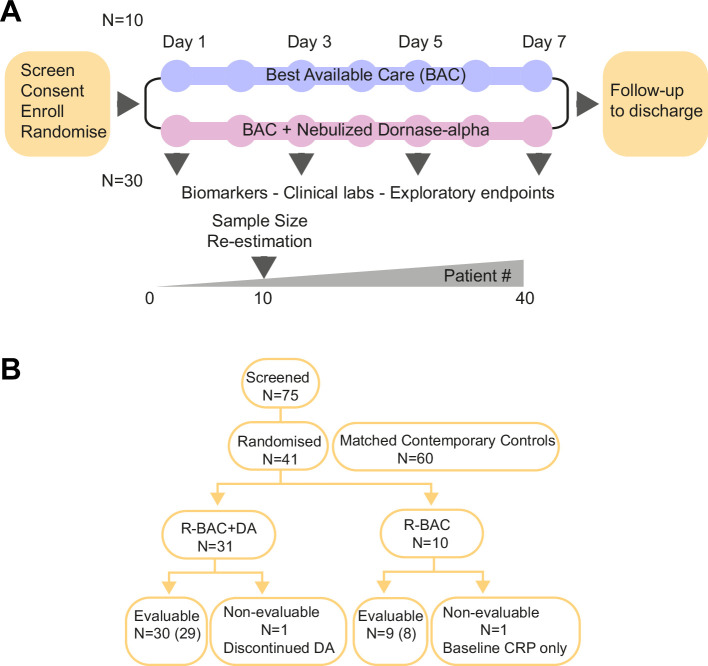
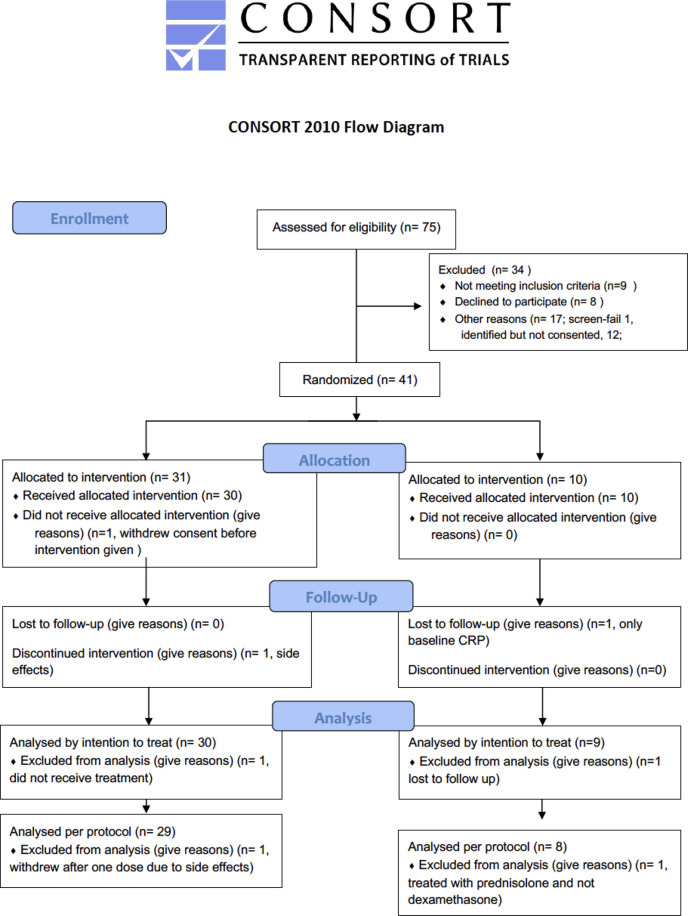
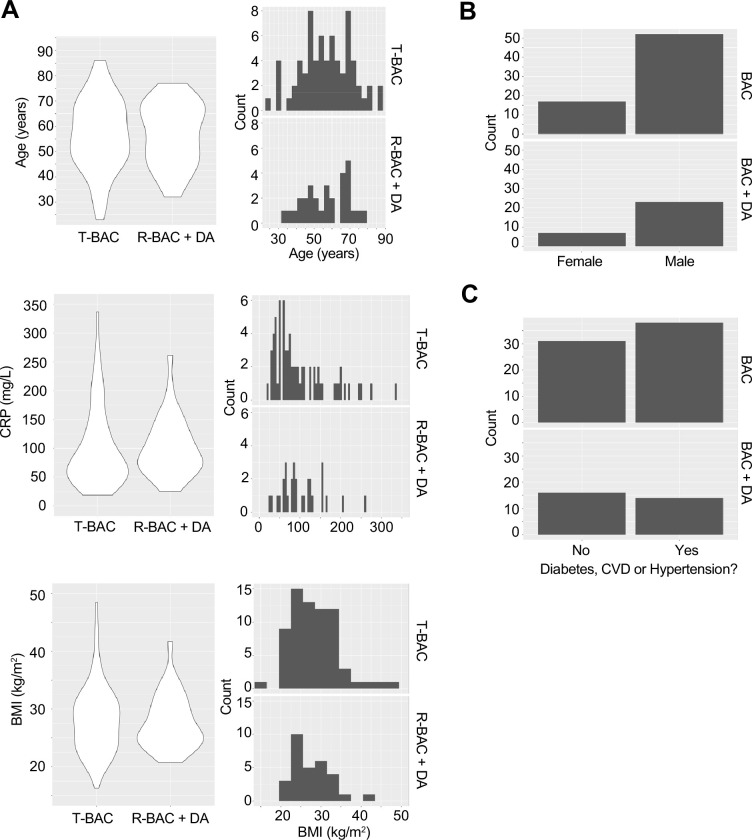
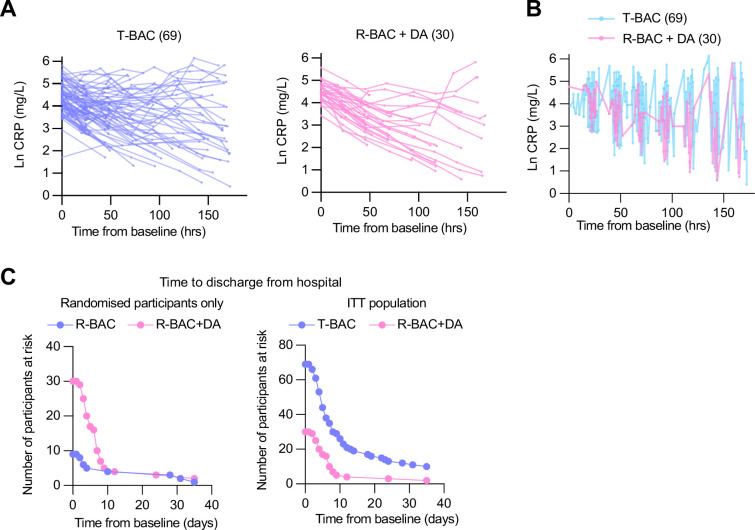
Methods: Eligible patients were randomized (3:1) to the best available care including dexamethasone (R-BAC) or to BAC with twice-daily nebulized dornase alfa (R-BAC + DA) for seven days or until discharge. A 2:1 ratio of matched contemporary controls (CC-BAC) provided additional comparators. The primary endpoint was the improvement in C-reactive protein (CRP) over time, analyzed using a repeated-measures mixed model, adjusted for baseline factors.

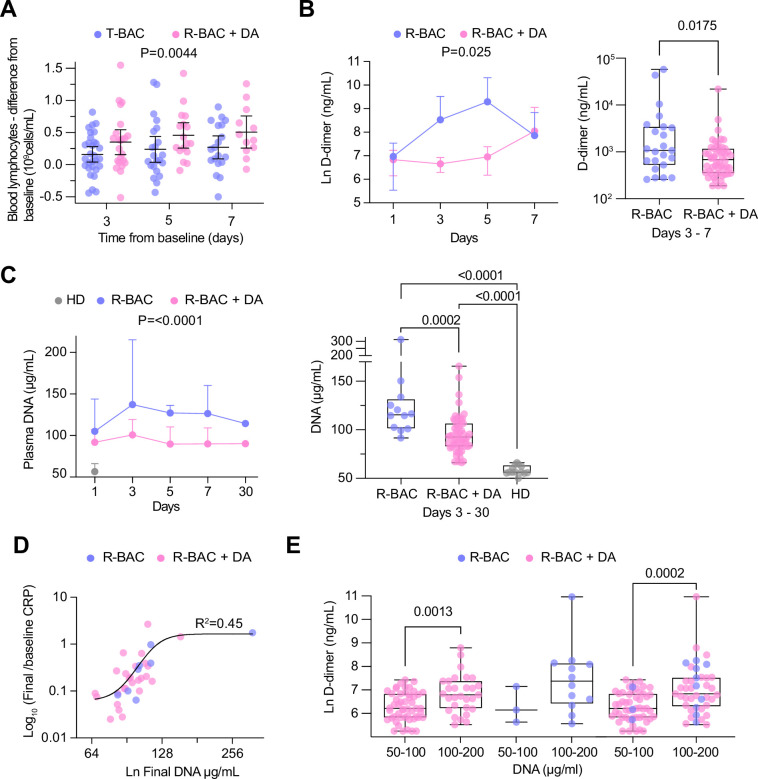
Results: We recruited 39 evaluable participants: 30 randomized to dornase alfa (R-BAC +DA), 9 randomized to BAC (R-BAC), and included 60 CC-BAC participants. Dornase alfa was well tolerated and reduced CRP by 33% compared to the combined BAC groups (T-BAC). Least squares (LS) mean post-dexamethasone CRP fell from 101.9 mg/L to 23.23 mg/L in R-BAC +DA participants versus a 99.5 mg/L to 34.82 mg/L reduction in the T-BAC group at 7 days; p=0.01. The anti-inflammatory effect of dornase alfa was further confirmed with subgroup and sensitivity analyses on randomised participants only, mitigating potential biases associated with the use of CC-BAC participants. Dornase alfa increased live discharge rates by 63% (HR 1.63, 95% CI 1.01-2.61, p=0.03), increased lymphocyte counts (LS mean: 1.08 vs 0.87, p=0.02) and reduced circulating cf-DNA and the coagulopathy marker D-dimer (LS mean: 570.78 vs 1656.96 μg/mL, p=0.004).

Conclusions: Dornase alfa reduces pathogenic inflammation in COVID-19 pneumonia, demonstrating the benefit of cost-effective therapies that target extracellular chromatin.

Funding: LifeArc, Breathing Matters, The Francis Crick Institute (CRUK, Medical Research Council, Wellcome Trust).

Clinical trial number: NCT04359654.

Keywords: COVID-19; DNA; DNase; NETs; dornase alfa; histone; immunology; inflammation; medicine; viruses.


Conflict of interest statement

JP, VS, ED, RE, MT, ND, IA, DH, DB, TC, JG, AW, HE, VJ, AL, TR, LL, EH, FK, BW, VB, VP No competing interests declared, JI, AF Employee of Exploristics, PL Employee of Target to Treatment Consulting Ltd

Figures

Figure 1.
Figure 1.. Trial design and Consort diagram.
(A) COVASE Trial Design. (B) Consort diagram summary. Numbers not in parentheses indicate the participants in the intention-to-treat (ITT) population and the numbers in parentheses indicate the number of participants in the per-protocol population. A complete consort flow diagram is shown in Figure 1—figure supplement 1.
Figure 1—figure supplement 1.
Figure 1—figure supplement 1.. Consort flow diagram.
Flow diagram of recruited randomized participants in the randomised to BAC (R-BAC) and R-BAC +DA arms, depicting the allocation following randomization, the numbers included and lost to follow-up and the numbers of included and excluded participants by intention to treat and per protocol and the justification for each exclusion.
Figure 1—figure supplement 2.
Figure 1—figure supplement 2.. Baseline characteristics of patients analysed in the trial.
(A) Violin plots (left) and frequency distribution (right) of baseline clinical parameters between participants in the contemporary control and randomized best available care (BAC) group (T-BAC) and the randomized BAC +Dornase alfa (R-BAC +DA) group. (Top) Age, (middle) Baseline C-reactive protein (CRP) and (bottom) Body mass index (BMI). (B) Number of male and female participants in the two groups. (C) Incidence of cardiovascular comorbidities in the two groups.
Figure 2.
Figure 2.. Longitudinal C-reactive protein (CRP) predicts survival probability in severe COVID-19 pneumonia.
(A) Individual CRP concentrations in 465 plasmas from 63 participants with maximum WHO severity grade 7 COVID-19 pneumonia segregated into survivors (n=43) and deceased (n=20) groups from the Berlin COVID-19 study. (B) Participants ordered by their longitudinal average CRP concentrations shown in the left column. Mortality is depicted in yellow in the right column. (C) Kaplan Meier survival probabilities (left panel) and numbers at risk (right panel) for patients segregated into three categories of longitudinal average CRP ranges: 0–100 mg / L (n=17), 100–200 mg / L (n=25), and 200–450 mg / L (n=10). Statistical significance (P), Hazard ratios (HR) and 95% confidence intervals (95% CI) for group 1 against group 3 and group 2 against group 3 are shown below the survival plot. Statistics by Mann-Whitney and Mantel-Cox log rank tests.
Figure 3.
Figure 3.. Analysis of primary and clinical endpoints.
(A) Fitted mean (95% confidence interval) from mixed model of natural log (C-reactive protein, CRP) over 7 days follow-up as the outcome. (Left panel) randomized participants only: Blue: participants randomized to R-BAC, n=9; Pink: participants randomized to R-BAC +DA, n=30. (Right panel) ITT population. Blue: T-BAC (CC-BAC and R-BAC) n=69; Pink: R-BAC +DA, n=30. Results were adjusted for natural log baseline CRP, age, sex, BMI, serious comorbidity (diabetes, cardiovascular disease, or hypertension), time and a treatment × time interaction. P-value generated by comparing least-square means between the arms. (B) Distribution of participants based on the change in CRP measured as a ratio of the final CRP reading within the 7 day treatment period over the baseline CRP reading per participant. Statistical analysis by Fisher’s test. (C) Kaplan-Meier plot showing time to discharge from hospital from baseline. Hazard ratio from Cox proportional hazards model adjusted for baseline CRP, age, sex, BMI, serious comorbidity. p-value from log-rank test. Blue: CC-BAC and participants randomized to R-BAC, n=69. Pink: participants randomized to R-BAC +DA, n=30. (D) Kaplan-Meier plot showing time to death over 35 days follow up. Hazard ratio from Cox proportional hazards model adjusted for baseline CRP, age, sex, BMI, serious comorbidity. p-value from log-rank test.
Figure 3—figure supplement 1.
Figure 3—figure supplement 1.. Primary and clinical endpoints.
(A) (Left panel) Natural log C-reactive protein (CRP) in best available care (BAC) (CC and randomized participants; blue). (Right panel) Natural log CRP in participants randomized to BAC+DA (pink). (B) Graph depicting the periodicity and frequency of blood sample collection for all post-baseline CRP values from contemporary control and randomized BAC (blue) or BAC+dornase alfa (BAC+DA, pink) patients pooled into a single timeline. (C). (Left panel) Numbers at risk for Kaplan-Meier plots of the time to discharge from hospital (Figure 3C). intention-to-treat (ITT) population (Blue: CC and participants randomized to BAC, n=69. Pink: participants randomized to BAC+DA, n=30). (Right panel) Numbers at risk depicting the time to discharge from hospital from baseline. Blue: participants randomized to R-BAC, n=9; Pink: participants randomized to R-BAC+DA, n=30. (Right panel) ITT population: Blue: T-BAC (CC-BAC and R-BAC) n=69; Pink: R-BAC+DA, n=30. Hazard ratio from Cox proportional hazards model adjusted for baseline CRP, age, sex, BMI, serious co-mor bidity (diabetes, cardiovascular disease, or hypertension).
Figure 4.
Figure 4.. Analysis of secondary and exploratory endpoints in blood.
(A) Difference between the lymphocyte count for each day of the treatment period and the baseline in each intention-to-treat (ITT) participant who exhibited lymphopenia at baseline (<1 × 10⁹ lymphocytes/mL). T-BAC (n=71 samples); R-BAC + DA (n=52 samples). The mean and 95% CI interval are shown with statistical analysis by two-way Anova. (B) (Left panel) Mean blood D-dimer levels per day in randomized R-BAC (blue) and R-BAC +DA (pink) participants with error bars depicting 95% CI. Statistical difference by mixed effects Anova analysis. (Right panel) D-dimer concentration in the randomized participant post-baseline blood samples from the R-BAC (n=11 samples) and R-BAC +DA (n=28 samples) groups. Statistical analysis by two-tailed unpaired parametric t-test. (C) (Left panel) Mean cell free (cf)-DNA levels per day in randomized R-BAC (n=22 samples, blue) and R-BAC +DA (n=89 samples, pink) participants, with error bars depicting standard deviation. Statistical analysis by mixed effects Anova. (Right panel) Pooled cf-DNA concentration measurements in post-baseline blood samples of R-BAC (n=12) and R-BAC +DA (n=59) groups from days 3, 7 and 30. Healthy donor plasma cf-DNA concentrations (HD, n=13 samples, grey) are shown for comparison. Statistical analysis by one-way Anova. (D) Correlation between the final cf-DNA levels and ratio of CRP at day-7 normalized to the baseline C-reactive protein (CRP) (CRPfinal/CRPbaseline) per randomized participant (Total: n=34; R-BAC: n=7, R-BAC +DA: n=27) . Fitting by non-linear regression. (E) Correlation between D-dimer and cf-DNA levels in the blood of participants randomized to R-BAC (blue) or to R-BAC +DA (DA) (pink), where samples were segregated depending on whether the corresponding levels of cf-DNA were <100μg/mL (R-BAC: n=3; R-BAC+ DA: n=51) or >100 μg/mL (R-BAC: n=12; R-BAC+ DA: n=29). Statistical analysis by unpaired parametric t-test.

Update of

  • doi: 10.1101/2022.04.14.22272888
  • doi: 10.7554/eLife.87030.1
  • doi: 10.7554/eLife.87030.2
  • doi: 10.7554/eLife.87030.3

References

    1. American Thoracic Society Idiopathic pulmonary fibrosis: diagnosis and treatment. International consensus statement. American Journal of Respiratory and Critical Care Medicine. 2000;161:646–664. doi: 10.1164/ajrccm.161.2.ats3-00. - DOI - PubMed
    1. Aramburu IV, Hoving D, Vernardis SI, Tin MCF, Ioannou M, Temkin MI, De Vasconcelos NM, Demichev V, Helbig ET, Lippert L, Stahl K, White M, Radbruch H, Ihlow J, Horst D, Chiesa ST, Deanfield JE, David S, Bode C, Kurth F, Ralser M, Papayannopoulos V. Functional proteomic profiling links deficient DNA clearance with increased mortality in individuals with severe COVID-19 pneumonia. Immunity. 2022;55:2436–2453. doi: 10.1016/j.immuni.2022.11.007. - DOI - PMC - PubMed
    1. Cortjens B, de Jong R, Bonsing JG, van Woensel JBM, Antonis AFG, Bem RA. Local dornase alfa treatment reduces NETs-induced airway obstruction during severe RSV infection. Thorax. 2018;73:578–580. doi: 10.1136/thoraxjnl-2017-210289. - DOI - PubMed
    1. Cui Z, Merritt Z, Assa A, Mustehsan H, Chung E, Liu S, Kumthekar A, Ayesha B, McCort M, Palaiodimos L, Baron S, Averbukh Y, Southern W, Arora S. Early and significant reduction in C-reactive protein levels after corticosteroid therapy is associated with reduced mortality in patients with COVID-19. Journal of Hospital Medicine. 2021;16:142–148. doi: 10.12788/jhm.3560. - DOI - PubMed
    1. Fisher J, Mohanty T, Karlsson CAQ, Khademi SMH, Malmström E, Frigyesi A, Nordenfelt P, Malmstrom J, Linder A. Proteome profiling of recombinant dnase therapy in reducing NETs and aiding recovery in COVID-19 patients. Molecular & Cellular Proteomics. 2021;20:100113. doi: 10.1016/j.mcpro.2021.100113. - DOI - PMC - PubMed

Publication types

MeSH terms

Associated data