. 2024 Sep;216(3):108110.
doi: 10.1016/j.jsb.2024.108110. Epub 2024 Jul 14.

Quantitative 3D electron microscopy characterization of mitochondrial structure, mitophagy, and organelle interactions in murine atrial fibrillation

Affiliations

Quantitative 3D electron microscopy characterization of mitochondrial structure, mitophagy, and organelle interactions in murine atrial fibrillation

Pavithran Guttipatti et al. J Struct Biol. 2024 Sep.

Abstract

Atrial fibrillation (AF) is the most common clinical arrhythmia, however there is limited understanding of its pathophysiology including the cellular and ultrastructural changes rendered by the irregular rhythm, which limits pharmacological therapy development. Prior work has demonstrated the importance of reactive oxygen species (ROS) and mitochondrial dysfunction in the development of AF. Mitochondrial structure, interactions with other organelles such as sarcoplasmic reticulum (SR) and T-tubules (TT), and degradation of dysfunctional mitochondria via mitophagy are important processes to understand ultrastructural changes due to AF. However, most analysis of mitochondrial structure and interactome in AF has been limited to two-dimensional (2D) modalities such as transmission electron microscopy (EM), which does not fully visualize the morphological evolution of the mitochondria during mitophagy. Herein, we utilize focused ion beam-scanning electron microscopy (FIB-SEM) and perform reconstruction of three-dimensional (3D) EM from murine left atrial samples and measure the interactions of mitochondria with SR and TT. We developed a novel 3D quantitative analysis of FIB-SEM in a murine model of AF to quantify mitophagy stage, mitophagosome size in cardiomyocytes, and mitochondrial structural remodeling when compared with control mice. We show that in our murine model of spontaneous and continuous AF due to persistent late sodium current, left atrial cardiomyocytes have heterogenous mitochondria, with a significant number which are enlarged with increased elongation and structural complexity. Mitophagosomes in AF cardiomyocytes are located at Z-lines where they neighbor large, elongated mitochondria. Mitochondria in AF cardiomyocytes show increased organelle interaction, with 5X greater contact area with SR and are 4X as likely to interact with TT when compared to control. We show that mitophagy in AF cardiomyocytes involves 2.5X larger mitophagosomes that carry increased organelle contents. In conclusion, when oxidative stress overcomes compensatory mechanisms, mitophagy in AF faces a challenge of degrading bulky complex mitochondria, which may result in increased SR and TT contacts, perhaps allowing for mitochondrial Ca2+ maintenance and antioxidant production.

Keywords: 3D structure; Atrial fibrillation; Electron microscopy; Mitochondria; Mitophagy.


Conflict of interest statement

Declaration of competing interest The authors declare that they have no known competing financial interests or personal relationships that could have appeared to influence the work reported in this paper.

Figures

Figure 1:
Figure 1:. 3D FIB-SEM reveals enlarged, elongated mitochondria in AF atrial cardiomyocytes
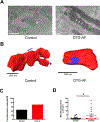
(A) Illustration of FIB-SEM dataset characteristics for control and DTG-AF sample. (B) Sample slices demonstrating the 2D segmentation of individual mitochondria in control and DTG-AF samples. Each mitochondrion is labeled in a different color. Yellow inset shows higher magnification view of mitochondria. Scale bar = 1 μm. (C) 3D reconstruction of mitochondria in Amira using surface generation. (D) Quantification of mitochondrial volume shows mitochondria in DTG-AF are larger than control. A histogram shows the spread of mitochondrial volumes. Insets show quantification of mitochondrial area on 2D TEM imaging of control and DTG-AF mouse atria, with similar enlargement of mitochondria in DTG-AF cardiomyocytes. (E) Quantification showing similar increase in surface area of mitochondria in AF cardiomyocytes. (F) Quantification of mitochondrial shape using the Mitochondrial Complexity Index (see methods) shows AF cardiomyocyte mitochondria are more complex in shape while control mitochondria are closer to perfect globular spheres. (G) 3D reconstructions of example mitochondria with different MCI values, depicting the deviation from spherical shape and increased elongation and complexity with higher MCI values. Student’s unpaired t-test for all analyses, *** p < 0.001.
Figure 2:
Figure 2:. Mitochondria in AF mice cardiomyocytes form increased contacts with SR
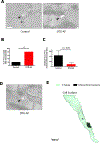
(A) Representative FIB-SEM images from control and DTG-AF mitochondria showing interaction with SR (white arrows). Scale bar = 500 nm. (B) 3D reconstructions of the mitochondria (red) and SR (blue) shown in (A). (C) Quantification of percentage of mitochondria in contact with SR in WT and DTG-AF. Fisher’s exact test, p = 0.200, not significant. (D) Quantification of area of contact between mitochondria and SR in control and DTG-AF samples shows greater mito-SR contact in AF. Student’s unpaired t-test, * p<0.05.
Figure 3:
Figure 3:. Increased proximity of mitochondria with TT in atrial cardiomyocytes of AF mice
(A) Representative FIB-SEM images of TT (black arrowhead) from control and DTG-AF samples. The TT in the DTG-AF sample shows close apposition with a mitochondrion. Z-line labeled with ‘Z’. Scale bar = 200 nm. (B) Quantification of percent of TT in control vs DTG-AF showing contact with mitochondria reveals increased proportion of TT are associated with mitochondria in AF. Fisher’s exact test, * p < 0.05. (C) Quantification of distance from TT to mitochondria in control and DTG-AF. Student’s unpaired t-test, p = 0.09, not significant. (D) TT from DTG-AF sample showing electron dense structure inside the lumen that may represent material for disposal. Scale bar = 200 nm. (E) 3D reconstruction of TT shown in (D) displaying location of the intraluminal contents.
Figure 4:
Figure 4:. 3D quantification of mitophagy reveals larger mitophagosomes in AF cardiomyocytes
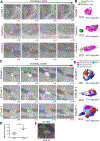
(A) Three cases of mitophagy from the control sample with selected FIB-SEM slices at different z values displayed. Yellow arrowhead = degraded area, magenta arrowhead = contents undergoing degradation, green arrowhead = lysosome, white arrowhead = sarcolemma. Scale bar = 200 nm. (B) 3D reconstructions of the mitophagy cases shown in (A), with percentage degradation calculated. Case 2 with a lysosome in proximity demonstrates the highest percentage degradation. (C) Three cases of mitophagy from the DTG-AF sample, which display multiple materials inside and are bordered by SR-like membranes (blue arrowhead). Scale bar = 200 nm. (D) 3D reconstruction of AF cardiomyocyte mitophagy cases in (C), with percent degradation calculations. Contents determined to be separate materials are colored differently for visualization. In case 1 a lysosome is visualized in direct contact with the mitophagosome; interestingly this mitophagosome displays the highest percentage degradation score of all cases. (E) Quantification of mitophagosome volume shows increased mitophagosome size in DTG-AF compared to control. Student’s unpaired t-test, * p < 0.05. (F) Mitophagosome in a DTG-AF cardiomyocyte on TEM imaging with similar appearance to FIB-SEM, with multiple materials inside indicated by white arrowheads. Scale bar = 200 nm.

Similar articles

References

    1. Ahuja P, Wanagat J, Wang Z, Wang Y, Liem DA, Ping P, Antoshechkin IA, Margulies KB, Maclellan WR, 2013. Divergent mitochondrial biogenesis responses in human cardiomyopathy. Circulation 127, 1957–1967. - PMC - PubMed
    1. Ashrafi G, Schwarz TL, 2013. The pathways of mitophagy for quality control and clearance of mitochondria. Cell death and differentiation 20, 31–42. - PMC - PubMed
    1. Avula UMR, Abrams J, Katchman A, Zakharov S, Mironov S, Bayne J, Roybal D, Gorti A, Yang L, Iyer V, Waase M, Saluja D, Ciaccio EJ, Garan H, Marks AR, Marx SO, Wan EY, 2019. Heterogeneity of the action potential duration is required for sustained atrial fibrillation. JCI Insight 4. - PMC - PubMed
    1. Avula UMR, Dridi H, Chen B-X, Yuan Q, Katchman AN, Reiken SR, Desai AD, Parsons S, Baksh H, Ma E, Dasrat P, Ji R, Lin Y, Sison C, Lederer WJ, Joca HC, Ward CW, Greiser M, Marks AR, Marx SO, Wan EY, 2021. Attenuating persistent sodium current–induced atrial myopathy and fibrillation by preventing mitochondrial oxidative stress. JCI Insight 6. - PMC - PubMed
    1. Chaanine AH, Joyce LD, Stulak JM, Maltais S, Joyce DL, Dearani JA, Klaus K, Nair KS, Hajjar RJ, Redfield MM, 2019. Mitochondrial Morphology, Dynamics, and Function in Human Pressure Overload or Ischemic Heart Disease With Preserved or Reduced Ejection Fraction. Circulation. Heart failure 12, e005131. - PubMed

MeSH terms