

Impact of climate change on paediatric respiratory health: pollutants and aeroallergens
- PMID: 39009406
- PMCID: PMC11262702
- DOI: 10.1183/16000617.0249-2023
Impact of climate change on paediatric respiratory health: pollutants and aeroallergens
Abstract
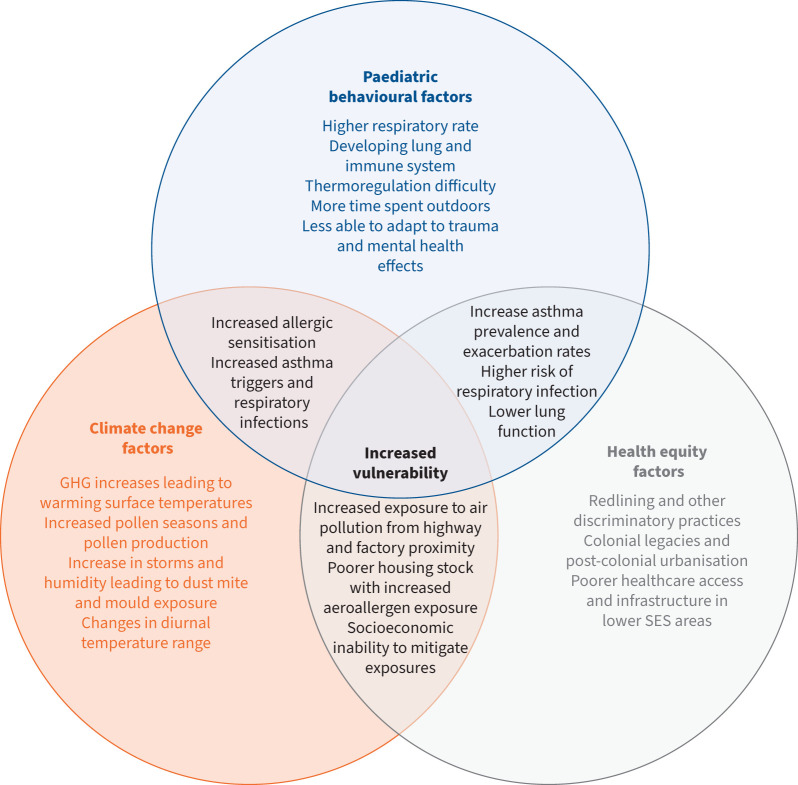
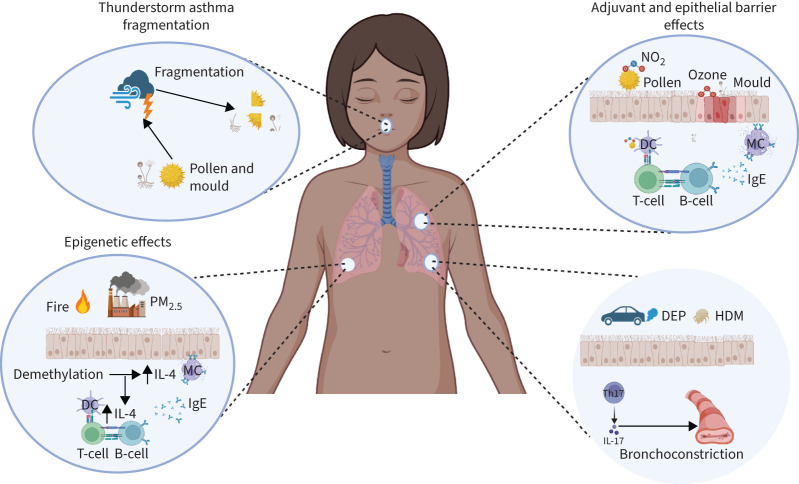
Paediatric populations are particularly vulnerable to respiratory diseases caused and exacerbated by aeroallergens, pollutants and infectious agents. Worsening climate change is expected to increase the prevalence of pollutants and aeroallergens while amplifying disease severity and causing disproportionate effects in under-resourced areas. The purpose of this narrative review is to summarise the role of anthropogenic climate change in the literature examining the future impact of aeroallergens, pollutants and infectious agents on paediatric respiratory diseases with a focus on equitable disease mitigation. The aeroallergens selected for discussion include pollen, dust mites and mould as these are prevalent triggers of paediatric asthma worldwide. Human rhinovirus and respiratory syncytial virus are key viruses interacting with climate change and pollution and are primary causal agents of viral respiratory disease. Within this review, we present the propensity for aeroallergens, climate change and pollution to synergistically exacerbate paediatric respiratory disease and outline measures that can ameliorate the expected increase in morbidity and severity of disease through a health equity lens. We support shifting from fossil fuels to renewable energy worldwide, across sectors, as a primary means of reducing increases in morbidity.
Copyright ©The authors 2024.
Conflict of interest statement
Conflict of interest: All authors have nothing to disclose.
Figures

Comment in
- doi: 10.1183/16000617.0057-2024
Similar articles
-
Impact of climate change and air pollution on childhood respiratory health.J Pediatr (Rio J). 2025 Mar-Apr;101 Suppl 1(Suppl 1):S65-S69. doi: 10.1016/j.jped.2024.11.007. Epub 2025 Jan 31. J Pediatr (Rio J). 2025. PMID: 39701550 Free PMC article. Review.
-
Climate Change and Allergens: Current and Future Impacts.J Allergy Clin Immunol Pract. 2025 Jun;13(6):1281-1288. doi: 10.1016/j.jaip.2025.02.039. Epub 2025 Mar 10. J Allergy Clin Immunol Pract. 2025. PMID: 40074172 Review.
-
Impact of weather and climate change with indoor and outdoor air quality in asthma: A Work Group Report of the AAAAI Environmental Exposure and Respiratory Health Committee.J Allergy Clin Immunol. 2019 May;143(5):1702-1710. doi: 10.1016/j.jaci.2019.02.018. Epub 2019 Feb 28. J Allergy Clin Immunol. 2019. PMID: 30826366 Free PMC article. Review.
-
Air pollution, aeroallergens and admissions to pediatric emergency room for respiratory reasons in Turin, northwestern Italy.BMC Public Health. 2016 Aug 5;16:722. doi: 10.1186/s12889-016-3376-3. BMC Public Health. 2016. PMID: 27492006 Free PMC article.
-
Climate change and children's respiratory health.Paediatr Respir Rev. 2025 Mar;53:64-73. doi: 10.1016/j.prrv.2024.07.002. Epub 2024 Jul 29. Paediatr Respir Rev. 2025. PMID: 39107182 Review.
Cited by
-
Urban Lifestyle and Climate-Driven Environmental Exposures: Immunological Consequences for Pediatric Respiratory Allergies.Immun Inflamm Dis. 2025 Aug;13(8):e70248. doi: 10.1002/iid3.70248. Immun Inflamm Dis. 2025. PMID: 40801216 Free PMC article. Review.
-
Impact of Climate Change and Air Pollution on Bronchiolitis: A Narrative Review Bridging Environmental and Clinical Insights.Pathogens. 2025 Jul 14;14(7):690. doi: 10.3390/pathogens14070690. Pathogens. 2025. PMID: 40732736 Free PMC article. Review.
-
Environment and lung health in a rapidly changing world.Eur Respir Rev. 2024 Apr 10;33(172):240057. doi: 10.1183/16000617.0057-2024. Print 2024 Apr 30. Eur Respir Rev. 2024. PMID: 38599677 Free PMC article.
-
Impact of climate change and air pollution on childhood respiratory health.J Pediatr (Rio J). 2025 Mar-Apr;101 Suppl 1(Suppl 1):S65-S69. doi: 10.1016/j.jped.2024.11.007. Epub 2025 Jan 31. J Pediatr (Rio J). 2025. PMID: 39701550 Free PMC article. Review.
-
Polymerized Molecular Allergoid Alt a1: Effective SCIT in Pediatric Asthma Patients.J Clin Med. 2025 Feb 25;14(5):1528. doi: 10.3390/jcm14051528. J Clin Med. 2025. PMID: 40095008 Free PMC article.
References
-
- Shin YH, Hwang J, Kwon R, et al. . Global, regional, and national burden of allergic disorders and their risk factors in 204 countries and territories, from 1990 to 2019: a systematic analysis for the Global Burden of Disease Study 2019. Allergy 2023; 78: 2232–2254. doi:10.1111/all.15807 - DOI - PMC - PubMed
-
- Lindsey R, Dahlman L. Climate change: global temperature. Date last accessed: 28 November 2023. Date last updated: 28 January 2024. www.climate.gov/news-features/understanding-climate/climate-change-globa...
-
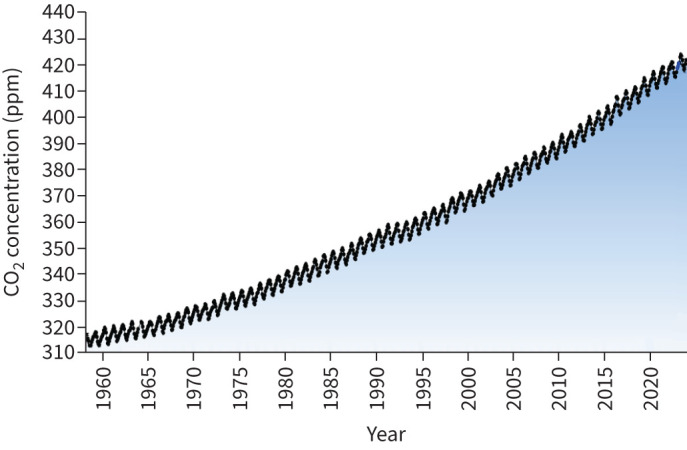
- Scripps Institution of Oceanography, UC San Diego . The Keeling curve. Date last accessed: 6 November 2023. Date last updated: 22 March 2024. https://keelingcurve.ucsd.edu/
Publication types
MeSH terms
Substances
LinkOut - more resources
Full Text Sources
Medical