. 2024 Jul 29;11(7):ENEURO.0125-24.2024.
doi: 10.1523/ENEURO.0125-24.2024. Print 2024 Jul.

Early-Life Resource Scarcity in Mice Does Not Alter Adult Corticosterone or Preovulatory Luteinizing Hormone Surge Responses to Acute Psychosocial Stress

Affiliations

Early-Life Resource Scarcity in Mice Does Not Alter Adult Corticosterone or Preovulatory Luteinizing Hormone Surge Responses to Acute Psychosocial Stress

Amanda G Gibson et al. eNeuro. .

Abstract

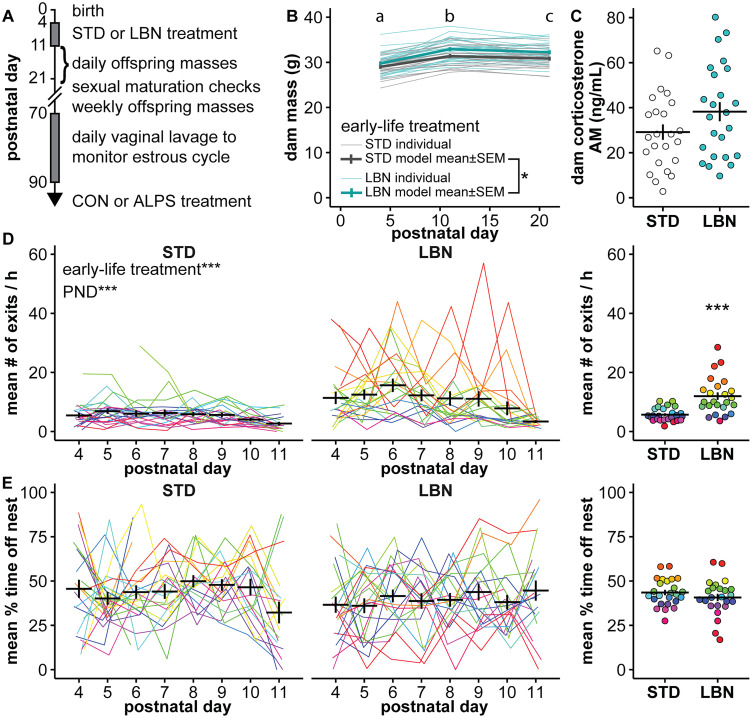
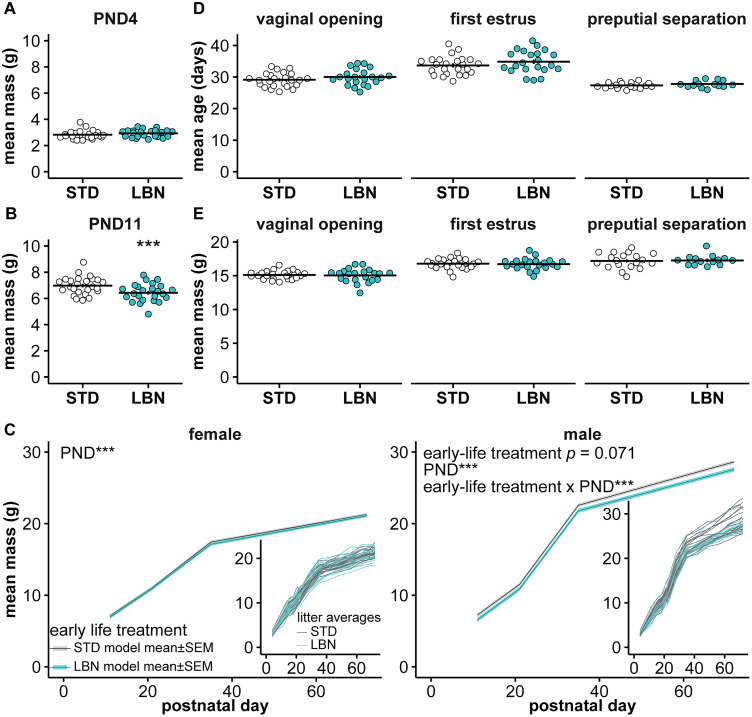
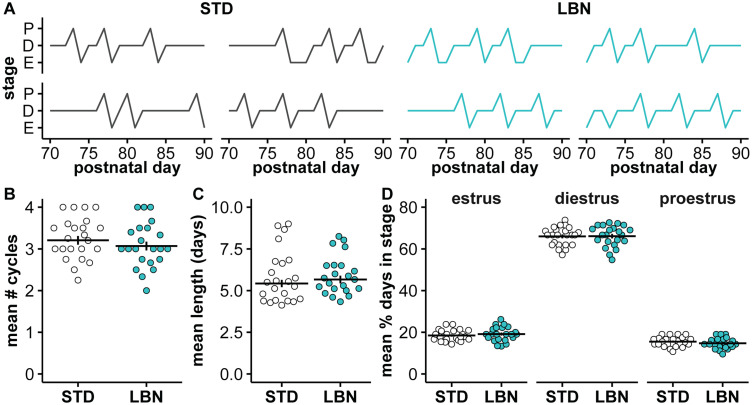
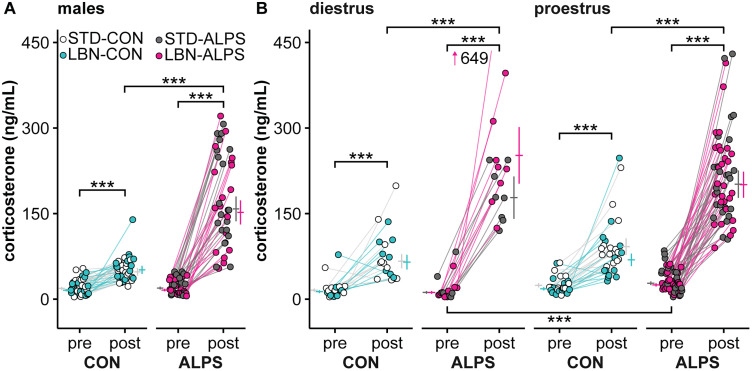
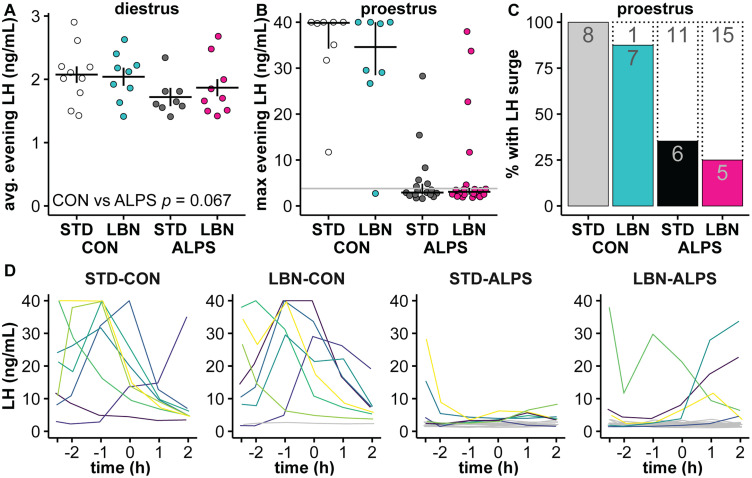
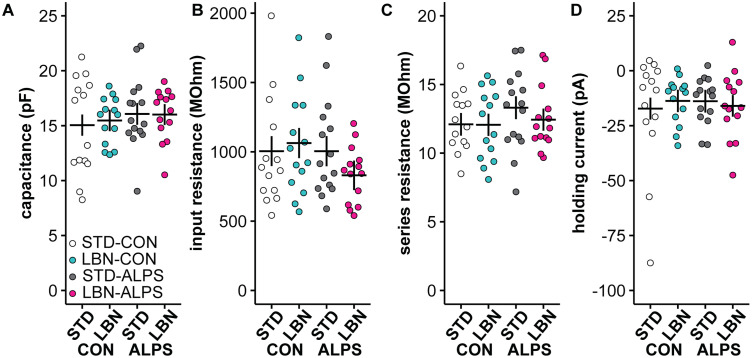
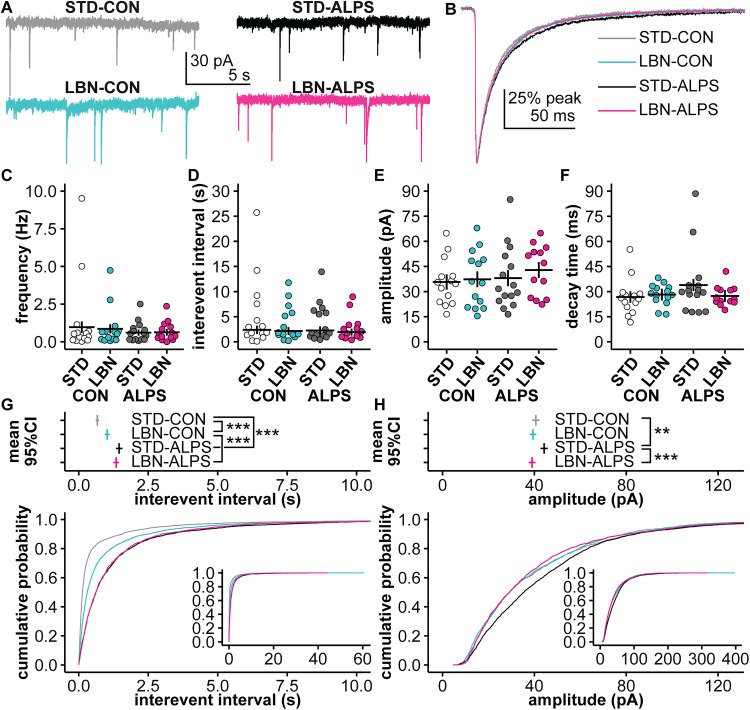
Early-life stressors can affect reproductive development and change responses to adult stress. We tested if resource scarcity in the form of limited bedding and nesting (LBN) from postnatal days (PND) 4 to 11 delayed sexual maturation in male and female mice and/or altered the response to an acute, layered, psychosocial stress (ALPS) in adulthood. Contrary to the hypotheses, age and mass at puberty were unaffected by the present application of LBN. Under basal conditions and after ALPS, corticosterone concentrations in males, diestrous females, and proestrous females reared in standard (STD) or LBN environments were similar. ALPS disrupts the luteinizing hormone (LH) surge in most mice when applied on the morning of proestrus; this effect was not changed by resource scarcity. In this study, the paucity of effects in the offspring may relate to a milder response of CBA dams to the paradigm. While LBN dams exited the nest more often and their offspring were smaller than STD-reared offspring on PND11, dam corticosterone concentrations were similar on PND11. To test if ALPS disrupts the LH surge by blunting the increase in excitatory GABAergic input to gonadotropin-releasing hormone (GnRH) neurons on the afternoon of proestrus, we conducted whole-cell voltage-clamp recordings. The frequency of GABAergic postsynaptic currents in GnRH neurons was not altered by LBN, ALPS, or their interaction. It remains possible that ALPS acts at afferents of GnRH neurons, changes response of GnRH neurons to input, and/or alters pituitary responsiveness to GnRH and that a more pronounced resource scarcity would affect the parameters studied.

Keywords: GABA; GnRH; LH; early-life stress; psychosocial stress; reproduction.


Conflict of interest statement

The authors declare no competing financial interests.

Figures

Figure 1.
Figure 1.
The LBN paradigm altered dam behavior. A, Experimental timeline. B, Dam mass before and after the paradigm and at weaning on PND21. Thin lines are individual dams, LMM model mean ± SEM shown in thick lines. Letters (a–c) indicate that dam mass, combined across treatment groups, differed on each PND (p < 0.01). C, Individual values and mean ± SEM serum corticosterone from the dams at the end of the paradigm on the morning of PND11. D, Left, The number of exits averaged by PND for individual dams are shown by colored lines; warmer colors indicate more exits; mean ± SEM number of nest exits versus PND is in black. Right, Individual dam averages and mean ± SEM number of nest exits; the color is consistent with the left graph. E, Left, The percentages of the time spent off nest averaged by PND for individual dam are shown by colored lines; warmer colors indicated more time off the nest; mean ± SEM percentage of time off the nest versus PND is in black. Right, Individual dam averages and mean ± SEM percentage of time off nest; the color is consistent with the left graph. Some error bars are obscured by the mean line. *p < 0.05, ***p < 0.001. Numbers in Extended Data Table 1-1. Full statistical model results are in Extended Data Table 1-2. STD, standard-reared; LBN, limited bedding and nesting; CON, adult control treatment; ALPS, adult acute, layered, psychosocial stress; PND, postnatal day.
Figure 2.
Figure 2.
LBN decreased PND11 body mass and lowered body mass in adult males but did not affect reproductive maturation. A, Mean litter values and mean ± SEM for PND4 mass. B, Mean litter values (both sexes) and model mean ± SEM for PND11 mass. C, Statistical model mean ± SEM for the body mass of the female (left) and male (right) offspring. The average mass of each litter is plotted in the insets. D, E, Mean litter values and model mean ± SEM for age (D) at the vaginal opening (left), first estrus (center), and preputial separation (right); for mass (E) at the vaginal opening (left), first estrus (center), and preputial separation (right). Some error bars are obscured by the mean line. ***p < 0.001. Full statistical model results are in Extended Data Table 2-1 (mass at PND11), Extended Data Table 2-2 (mass from PND11–72), and Extended Data Table 2-3 (maturation). STD, standard-reared; LBN, limited bedding and nesting.
Figure 3.
Figure 3.
LBN did not alter estrous cyclicity from PND70 to 90. A, Representative individual estrous cycle traces for STD (left) and LBN (right) offspring, proestrus (P), estrus (E), or diestrus (D). B, Number of cycles averaged for female littermates; model mean ± SEM. C, Mean cycle length averaged for female littermates; model mean ± SEM. D, The mean percentage of days spent in each cycle stage for female littermates; data mean ± SEM; no model value is available as χ2 test was used for analysis of percentage values. Full statistical model results are in Extended Data Table 3-1. Some error bars obscured by the mean line. STD, standard-reared; LBN, limited bedding and nesting; PND, postnatal day.
Figure 4.
Figure 4.
LBN does not change the corticosterone response to ALPS. Individual values and model mean ± SEM (adjacent horizontal lines and vertical error bars) for pre- and posttreatment serum corticosterone concentrations in males (A) and females (B; diestrus left, proestrus right). Early-life treatment groups are plotted together as there were no effects of LBN treatment on serum corticosterone concentrations at any point. Numbers are in Extended Data Table 4-1. Results from the full statistical models are in Extended Data Table 4-2. Additional data regarding tissue masses and the effect of corticosterone on masses are in Extended Data Figure 4-1 (male tissue masses), Extended Data Figure 4-2 (female tissue masses), Extended Data Figure 4-3 (male corticosterone administration), and Extended Data Tables 4-3–4-8. STD, standard-reared; LBN, limited bedding and nesting; CON, adult control; ALPS, acute, layered, psychosocial stress in adulthood. ***p < 0.001.
Figure 5.
Figure 5.
The LH surge is disrupted by adult stress. A, Individual values and model mean ± SEM for the average LH concentrations on diestrus. B, Individual values and median ± interquartile range of maximum evening LH for proestrous mice. The gray line at 3.8 ng/ml is the cutoff for an LH surge. C, The percentage of proestrous mice with a maximum LH concentration >3.8 ng/ml (filled bars; numbers are counts per result). D, Individual LH profiles for proestrous mice in each treatment group sampled hourly until 2 h after lights out; the time is relative to lights out. Gray lines show mice with no LH concentrations above 3.8 ng/ml. Results from the full statistical model of diestrous concentrations are in Extended Data Table 5-1. STD, standard-reared; LBN, limited bedding and nesting; CON, adult control; ALPS, acute, layered, psychosocial stress in adulthood.
Figure 6.
Figure 6.
Recording quality and passive properties of GnRH neurons were similar among groups. A–D, Individual cell values and model mean ± SEM for A, capacitance; B, input resistance; C, series resistance; D, holding current. Results for the full statistical model are in Extended Data Table 6-1. STD, standard-reared; LBN, limited bedding and nesting; CON, adult control; ALPS, acute, layered, psychosocial stress in adulthood.
Figure 7.
Figure 7.
Stress treatments did not alter overall GABA PSC frequency, but ALPS may lengthen the interevent interval in GnRH neurons. A, Representative 15 s traces (Box 9 smoothed) near the median frequency and amplitude from a GnRH neuron in each group. B, Normalized average PSC for each treatment group. C–F, Individual cell values and model mean ± SEM for C, PSC frequency (number of events/duration); D, mean interevent interval; E, mean amplitude; and F, decay time from 80 to 20% of peak calculated from the cell's normalized average trace. G, H, Distribution of (G) interevent interval and (H) amplitude. Top, Bootstrapped mean estimates with 95% confidence interval for each group. Bottom, Cumulative probability distribution plots for each group. Inset plots show the full range of the distribution. Results for the full statistical models are in Extended Data Tables 6-1, 7-1, and 7-2. *p < 0.05, **p < 0.01, ***p < 0.001, from bootstrapped results. STD, standard-reared; LBN, limited bedding and nesting; CON, adult control; ALPS, acute, layered, psychosocial stress in adulthood; PSC, postsynaptic current.

Similar articles

Cited by

References

    1. Adams C, Chen X, Moenter SM (2018) Changes in GABAergic transmission to and intrinsic excitability of gonadotropin-releasing hormone (GnRH) neurons during the estrous cycle in mice. eNeuro 5:ENEURO.0171-18.2018. 10.1523/ENEURO.0171-18.2018 - DOI - PMC - PubMed
    1. Agus S, Yavuz Y, Atasoy D, Yilmaz B (2024) Postweaning social isolation alters puberty onset by suppressing electrical activity of arcuate kisspeptin neurons. Neuroendocrinology 114:439–452. 10.1159/000535721 - DOI - PMC - PubMed
    1. Akhter S, Marcus M, Kerber RA, Kong M, Taylor KC (2016) The impact of periconceptional maternal stress on fecundability. Ann Epidemiol 26:710–716.e7. 10.1016/j.annepidem.2016.07.015 - DOI - PubMed
    1. Avishai-Eliner S, Gilles EE, Eghbal-Ahmadi M, Bar-El Y, Baram TZ (2001) Altered regulation of gene and protein expression of hypothalamic-pituitary-adrenal axis components in an immature rat model of chronic stress. J Neuroendocrinol 13:799–807. 10.1046/j.1365-2826.2001.00698.x - DOI - PMC - PubMed
    1. Bates D, Mächler M, Bolker B, Walker S (2015) Fitting linear mixed-effects models using lme4. J Stat Softw 67:1–48. 10.18637/jss.v067.i01 - DOI