. 2024 Jul 15;12(7):e008864.
doi: 10.1136/jitc-2024-008864.

Novel insights into paclitaxel's role on tumor-associated macrophages in enhancing PD-1 blockade in breast cancer treatment

Affiliations

Novel insights into paclitaxel's role on tumor-associated macrophages in enhancing PD-1 blockade in breast cancer treatment

Yoonjeong Choi et al. J Immunother Cancer. .

Abstract

Background: Triple-negative breast cancer (TNBC) poses unique challenges due to its complex nature and the need for more effective treatments. Recent studies showed encouraging outcomes from combining paclitaxel (PTX) with programmed cell death protein-1 (PD-1) blockade in treating TNBC, although the exact mechanisms behind the improved results are unclear.

Methods: We employed an integrated approach, analyzing spatial transcriptomics and single-cell RNA sequencing data from TNBC patients to understand why the combination of PTX and PD-1 blockade showed better response in TNBC patients. We focused on toll-like receptor 4 (TLR4), a receptor of PTX, and its role in modulating the cross-presentation signaling pathways in tumor-associated macrophages (TAMs) within the tumor microenvironment. Leveraging insights obtained from patient-derived data, we conducted in vitro experiments using immunosuppressive bone marrow-derived macrophages (iBMDMs) to validate if PTX could augment the cross-presentation and phagocytosis activities. Subsequently, we extended our study to an in vivo murine model of TNBC to ascertain the effects of PTX on the cross-presentation capabilities of TAMs and its downstream impact on CD8+ T cell-mediated immune responses.

Results: Data analysis from TNBC patients revealed that the activation of TLR4 and cross-presentation signaling pathways are crucial for the antitumor efficacy of PTX. In vitro studies showed that PTX treatment enhances the cross-presentation ability of iBMDMs. In vivo experiments demonstrated that PTX activates TLR4-dependent cross-presentation in TAMs, improving CD8+ T cell-mediated antitumor responses. The efficacy of PTX in promoting antitumor immunity was elicited when combined with PD-1 blockade, suggesting a complementary interaction.

Conclusions: This study reveals how PTX boosts the effectiveness of PD-1 inhibitors in treating TNBC. We found that PTX activates TLR4 signaling in TAMs. This activation enhances their ability to present antigens, thereby boosting CD8+ T cell antitumor responses. These findings not only shed light on PTX's immunomodulatory role in TNBC but also underscore the potential of targeting TAMs' antigen presentation capabilities in immunotherapy approaches.

Keywords: Breast Cancer; Combination therapy; Immune Checkpoint Inhibitor; Macrophage; Toll-like receptor - TLR.


Conflict of interest statement

Competing interests: G-HN and I-SK are the cofounders, and YC, EK, YKK, SK, and JK are employees of SHIFTIBIO. HC is a cofounder, and DL is an employee of Portrai. The other authors declare no conflicts of interest.

Figures
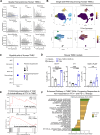
Figure 1
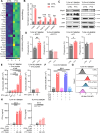
Figure 1. Clinical antitumor efficacy of paclitaxel (PTX) correlates with toll-like receptor 4 (TLR4) signaling and cross-presentation in tumor-associated macrophages (TAMs) with high TLR4 expression in triple-negative breast cancer (TNBC). (A) Spearman correlation of TLR4 expression in cell clusters in the publicly available spatial transcriptomic dataset (Zenodo.4739749). (B) Intercellular heterogeneity of TLR4 expression in TNBC patients was quantified by single-cell RNA sequencing. The uniform manifold approximation and projection for dimension reduction (UMAP) plot of immune cells in TME is distinguished into four clusters (upper left) and TLR4 expression of the cells (upper right). The clusters are as follows: T cell, myeloid cell, B cell, and innate lymphoid cell. The UMAP plot of myeloid cells is distinguished into seven clusters (lower left) and TLR4 expression of the cells (lower right). Macrophage, monocyte, conventional dendritic cell 1(cDC1), conventional dendritic cell 2 (cDC2), myeloid DC (mDC), plasmacytoid DCs (pDC), and mast cell. (C) TLR4 expression in myeloid cell populations from immune cells in tumors of TNBC patients (GSE169246). Samples include baseline (specimen collected before treatment of PTX) and post-treatment of PTX or its combination with the anti-PD-L1 atezolizumab. (D) Intercellular heterogeneity of TLR4 expression in TME of TNBC syngeneic mouse models (EO771, n=4; 4T1, n=6) and syngeneic mouse model (MMTV-PyMT, n=4) were analyzed with flow cytometry. Each column displays group means with individual data points and error bars with SEM. Statistical significance was determined using one-way analysis of variance (ANOVA) followed by Tukey’s multiple comparison test. P values indicate significant differences (**p<0.01; ***p<0.001; only statistically significant comparisons shown). (E) Gene set enrichment analysis (GSEA) on TAM in tumors of TNBC patients (GSE169246) who received PTX treatment (post-treatment specimens), including both responder and non-responders. (F) Upregulated signaling pathways from baseline sample data from responders who received PTX+anti-PD-L1 therapy compared with non-responders (pretreatment specimens). The statistical analysis of transcriptome data is detailed in the Methods section.
Figure 2
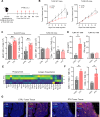
Figure 2. Paclitaxel (PTX) augments cross-presentation of iBMDMs in a toll-like receptor 4 (TLR4)-dependent manner. (A) Heatmap depicting the genetic signatures of PTX-treated and non-treated immunosuppressive bone marrow-derived macrophages (iBMDMs) (n=3). The analyzed gene sets are acquired from GO Biological Process Annotations 2023 (Phagocytosis: GO0002474, antigen presentation: GO0045807). (B) The mRNA expression of PTX-treated and non-treated iBMDMs was analyzed through immune transcriptome profiling and RT-qPCR. CYBB and NCF2 were plotted based on analysis by NanoString. RAB11a, ERGIC53, and VAMP8 are plotted based on RT-qPCR results. The selected genes encode representative markers of the cross-presentation process. (C) The protein expression was assessed with western blotting of peptide-loading complex components (ERp57, CRT, TPN, β2M) and GAPDH for loading control on TLR4 WT (left) and TLR4 KO (right) iBMDMs. (D) The phagocytosis on EO771 and 4T1 cells by TLR4 WT iBMDM and TLR4 KO iBMDM were assessed with flow cytometry. (E–H) PTX was treated for 48 hours on TLR4 WT or KO iBMDMs, and OVA-peptide was added 24 hours after initial PTX treatment. (E) The PTX concentration-dependent cross-presentation enhancement was analyzed. 0.01–10 µM PTX was treated for 48 hours on TLR4 WT iBMDMs, and OVA-peptide was added 24 hours after initial PTX treatment (n=3). On TLR4 KO iBMDMs, 10 µM PTX was treated, and the antigenic peptide was added accordingly (n=3). (F) TLR4 dependency of PTX treatment on antigen cross-presentation (n=6). The positive control for elevation of cross-presentation was tested utilizing LPS treatment, which was diminished on TAK-242 (TLR4 blockade) pre-treatment. (G) TLR4 dependency of PTX treatment on antigen cross-presentation. iBMDMs were pretreated with either TAK-242 or anti-TLR4 antibody for 24 hours prior to exposure to PTX and an ovalbumin (OVA)-peptide challenge. Representative histogram illustrating the distribution of OVA-bound H2Kb expression on treated iBMDMs. (H) The quantitation of secreted IFN-γ from OVA-peptide-challenged splenic CD8+ T cells from OT-1 mice (n=4). Post 24 hours or 48 hours of PTX treatment, TLR4 WT or KO iBMDMs were coincubated with CD8+ T cells and OVA-peptide. The supernatants were collected and analyzed after 72 hours of the OVA-peptide challenge. Each column displays group means with individual data points and error bars with SEM. Statistical significance was determined using Student’s unpaired two-tailed t-test (B, D, right of E) or one-way ANOVA followed by Tukey’s multiple comparison test (left of E, F, H). P values indicate significant differences (*p<0.05; **p<0.01; ***p<0.001). ANOVA, analysis of variance; WT, wild type.
Figure 3
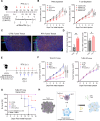
Figure 3. Paclitaxel (PTX) enhances antitumor CD8+ T cell immunity by amplifying cross-presentation in tumor-associated macrophag (TAM) via toll-like receptor 4 (TLR4) signaling. (A) EO771 tumor-bearing orthotopic C57BL/6 or TLR4 KO mice were intravenously treated with PTX or control vehicle (CTRL) five times after tumor size reached 50–80 mm3. (B) The tumor size of TLR4 WT mice (left) (n=16 or 17) and TLR4 KO mice (right) (n=5) were measured every other day from the initial injection day (D 0). (C) The tumor tissues of TLR4 WT mice (n=5) (left) and TLR4 KO mice (n=3) (right) were acquired on day 10, and tumor microenvironment (TME) was assessed at the cellular level via flow cytometry. (D) TAMs from TLR4 WT mice (left) or TLR4 KO mice (right) were isolated from the acquired tumor tissue and coincubated 72 hours with naive CD8+ T cells from non-tumor bearing mice. IFN-γ secretion was measured from the supernatant (n=3). TAMs from three mice were pooled and analyzed. (E) mRNA expression profile of TAMs from PTX treated or non-treated tumors of TLR4 WT mice were assessed through transcriptome sequencing. TAMs from four to six mice were pooled for analysis, and each sample are represented by each row. The identical gene sets in figure 2A were used as representative data. (F–G) Multiplex immunohistochemistry (IHC) staining of TME from the acquired tumor tissue. (F) Immune cell frequency per area (mm²) were quantified using Inform software and R statistical analysis (n=3). (G) Representative images of multiplex IHC. Each data point indicates means with error bars for SEM (B) or each column displays group means with individual data points and error bars with SEM (C, D, F). Statistical significance was determined using Student’s unpaired two-tailed t-test (C, D, F), or evaluated with tumor volumes at day 10 postinitial injection (B). P values indicate significant differences (*p<0.05; **p<0.01; ***p<0.001).
Figure 4
Figure 4. Paclitaxel (PTX) amplifies the antitumor effects of PD-1 blockade in triple-negative breast cancer (TNBC) through toll-like receptor 4 (TLR4)-dependent mechanisms. (A) EO771 tumor-bearing mice were intraperitoneally injected with clodronate liposome (CLO) for TAM depletion. The control liposome (Con) was injected for comparison. For CD8+ or CD4+ T cell depletion, an anti-mouse CD8 or CD4 antibody was injected as the described schedule. (B) The tumor growth suppression of PTX was abrogated when tumor-associated macrophage (TAM) was depleted at EO771 tumor-bearing mice (n=6) (left). CD8+ T cell depletion abolished PTX-induced antitumor efficacy, which was retained on CD4+ T cell depletion (n=6 or 8) (right). (C–D) Multiplex immunohistochemistry (IHC) staining of TME from the acquired tumor tissue. (C) Representative multiplex IHC images of TME from control and PTX-treated mice. (D) PD-L1 expression profile of TME on PTX treatment was quantified through Inform & R, assessed by the cell count per area (mm2) of PD-L1+ myeloid cells in TME (left) (n=3) and the mean fluorescence intensity (MFI) of PD-L1 from total myeloid cells (right) (n=3). (E) The PTX and αPD-1 treatment combination was analyzed on EO771 tumor-bearing mice. PTX was injected accordingly, and αPD-1 was intraperitoneally injected on day 2, day 4, day 6, and day D 8. (F) The tumor volume of EO771 tumor-bearing mice on PTX and αPD-1 treatment was measured every other day from the day of initial injection on TLR4 WT (n=6) (left) and TLR4 KO (n=5) (right) mice. (G) The survival rate of EO771 tumor-bearing mice on PTX and αPD-1 treatment was monitored for 16 days (n=10). Representative images of multiplex IHC. Each data point indicates means with error bars for SEM (B, F) or each column displays group means with individual data points and error bars with SEM (D). Statistical significance was determined using Student’s unpaired two-tailed t-test (D), evaluated with tumor volumes at day 10 postinitial injection (B, F), or determined using Mantel-Cox test. P values indicate significant differences (*p<0.05; **p<0.01; ***p<0.001). (H) Schematic illustration of immunotherapeutic effect by enhancing antigen cross-presentation of TAM with PTX treatment combined with αPD-1. The schematic was created with BioRender.com.

References

    1. Tzikas A-K, Nemes S, Linderholm BK. A comparison between young and old patients with triple-negative breast cancer: biology, survival and metastatic patterns. Breast Cancer Res Treat. 2020;182:643–54. doi: 10.1007/s10549-020-05727-x. - DOI - PMC - PubMed
    1. Deepak KGK, Vempati R, Nagaraju GP, et al. Tumor microenvironment: challenges and opportunities in targeting metastasis of triple negative breast cancer. Pharmacol Res. 2020;153:104683. doi: 10.1016/j.phrs.2020.104683. - DOI - PubMed
    1. Yuan Z-Y, Luo R-Z, Peng R-J, et al. High infiltration of tumor-associated macrophages in triple-negative breast cancer is associated with a higher risk of distant metastasis. Onco Targets Ther. 2014;7:1475–80. doi: 10.2147/OTT.S61838. - DOI - PMC - PubMed
    1. Medrek C, Pontén F, Jirström K, et al. The presence of tumor associated macrophages in tumor stroma as a prognostic marker for breast cancer patients. BMC Cancer. 2012;12 doi: 10.1186/1471-2407-12-306. - DOI - PMC - PubMed
    1. Zhang Y, Chen H, Mo H, et al. Single-cell analyses reveal key immune cell subsets associated with response to PD-L1 blockade in triple-negative breast cancer. Cancer Cell. 2021;39:1578–93. doi: 10.1016/j.ccell.2021.09.010. - DOI - PubMed

MeSH terms

LinkOut - more resources