. 2024 Jul 16;14(1):289.
doi: 10.1038/s41398-024-03010-x.

Prenatal immune activation in mice induces long-term alterations in brain mitochondrial function

Affiliations

Prenatal immune activation in mice induces long-term alterations in brain mitochondrial function

Edith M Schneider Gasser et al. Transl Psychiatry. .

Abstract

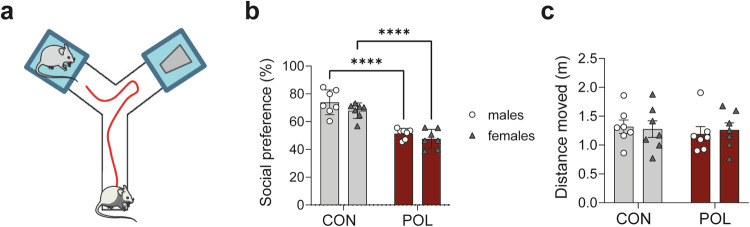
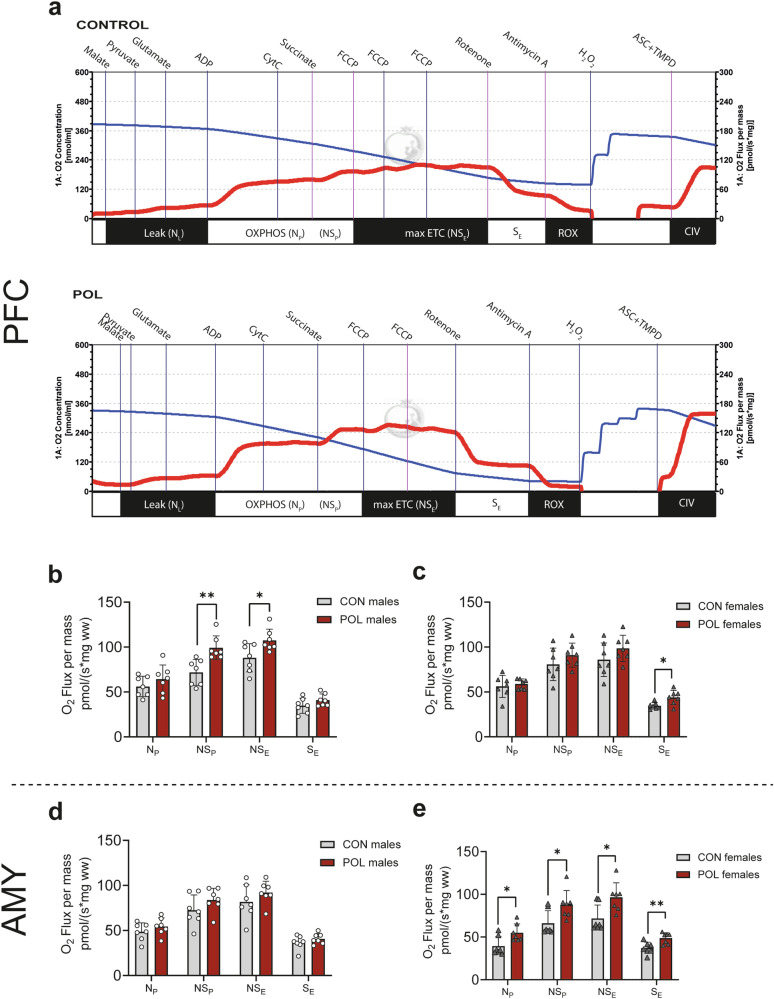
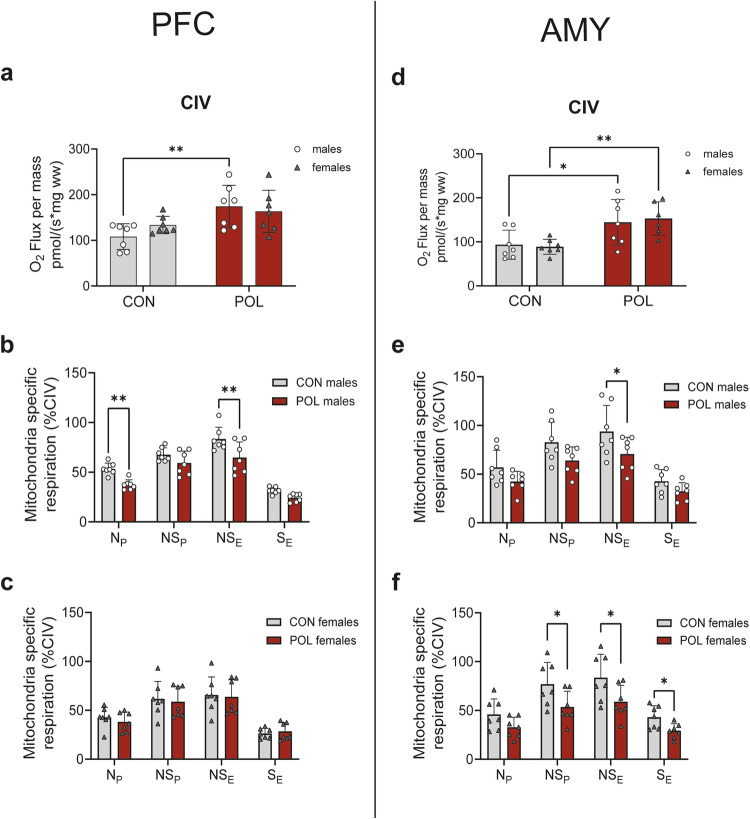
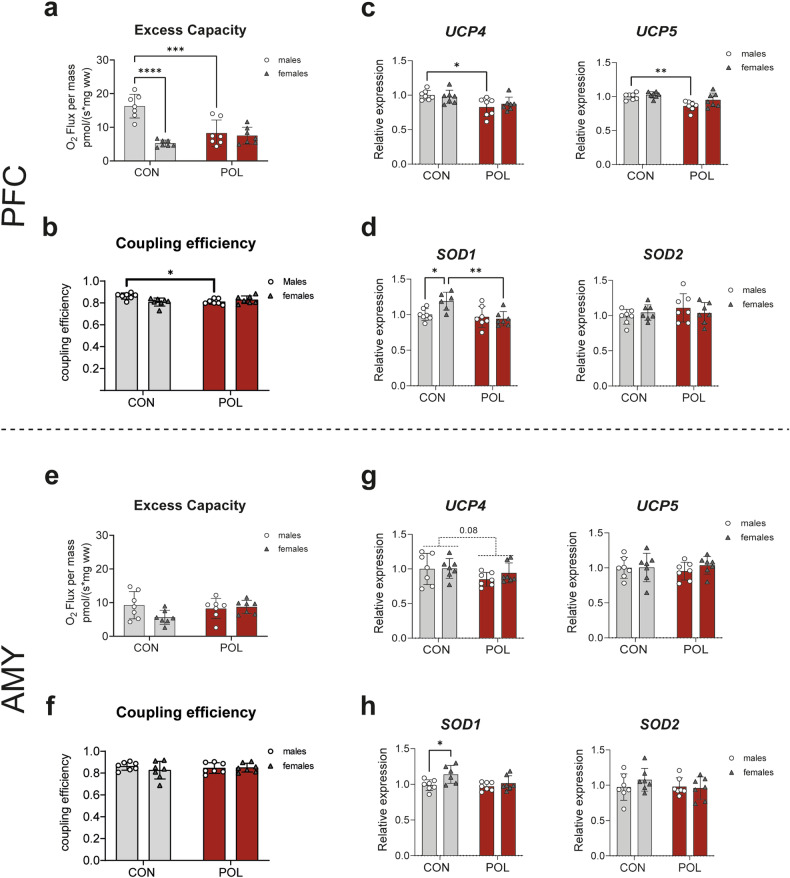
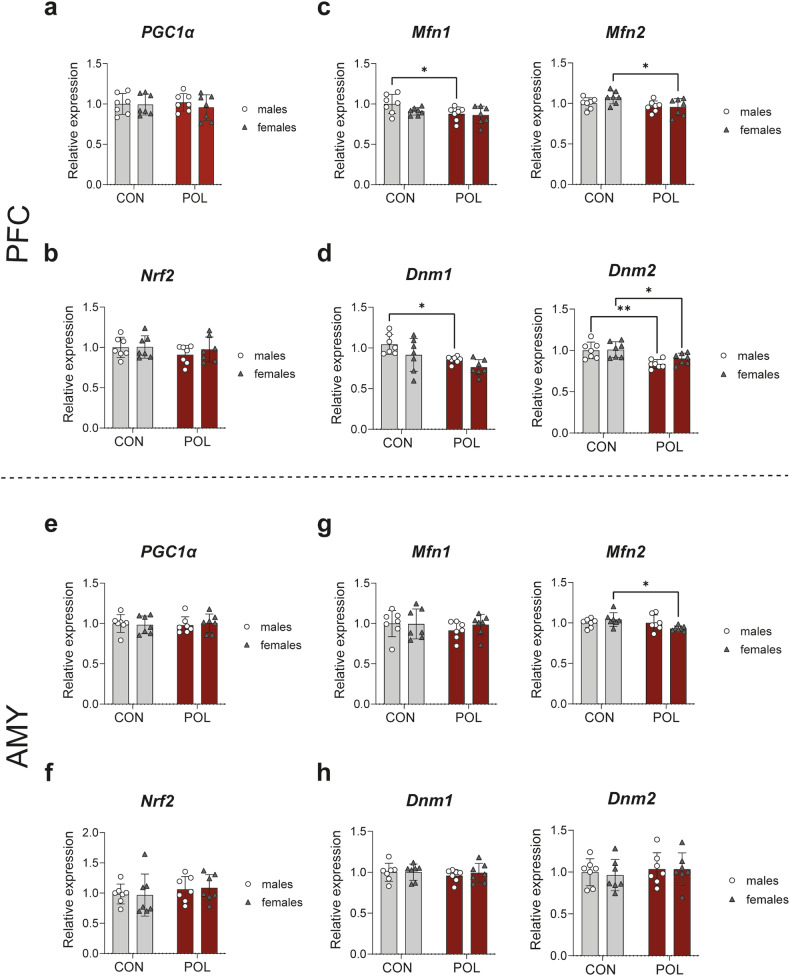
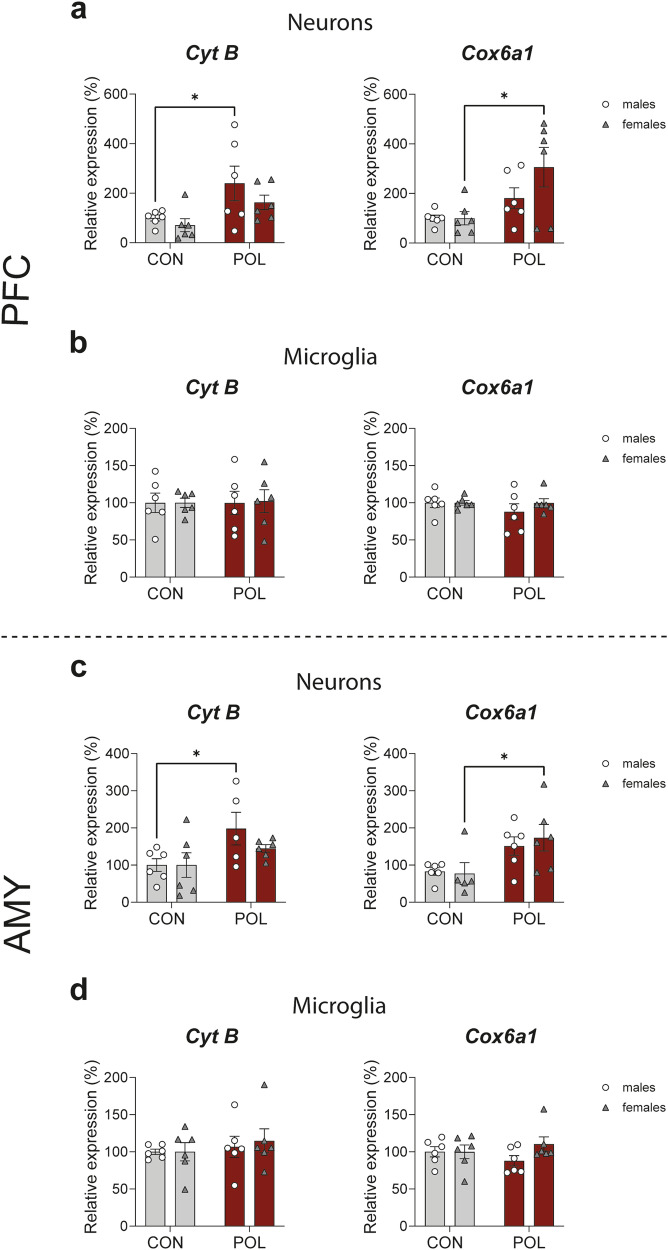
Prenatal exposure to infections is a risk factor for neurodevelopmental disorders in offspring, and alterations in mitochondrial function are discussed as a potential underlying factor. Here, using a mouse model of viral-like maternal immune activation (MIA) based on poly(I:C) (POL) treatment at gestational day (GD) 12, we show that adult offspring exhibit behavioral deficits, such as reduced levels of social interaction. In addition, we found increased nicotinamidadenindinucleotid (NADH)- and succinate-linked mitochondrial respiration and maximal electron transfer capacity in the prefrontal cortex (PFC) and in the amygdala (AMY) of males and females. The increase in respiratory capacity resulted from an increase in mitochondrial mass in neurons (as measured by complex IV activity and transcript expression), presumably to compensate for a reduction in mitochondrion-specific respiration. Moreover, in the PFC of control (CON) male offspring a higher excess capacity compared to females was observed, which was significantly reduced in the POL-exposed male offspring, and, along with a higher leak respiration, resulted in a lower mitochondrial coupling efficiency. Transcript expression of the uncoupling proteins (UCP4 and UCP5) showed a reduction in the PFC of POL male mice, suggesting mitochondrial dysfunction. In addition, in the PFC of CON females, a higher expression of the antioxidant enzyme superoxide dismutase (SOD1) was observed, suggesting a higher antioxidant capacity as compared to males. Finally, transcripts analysis of genes involved in mitochondrial biogenesis and dynamics showed reduced expression of fission/fusion transcripts in PFC of POL offspring of both sexes. In conclusion, we show that MIA causes alterations in neuronal mitochondrial function and mass in the PFC and AMY of adult offspring with some effects differing between males and females.


Conflict of interest statement

The authors declare no competing interests.

Figures

Fig. 1
Fig. 1. Social interaction of POL-exposed and control male and female adult offspring.
a Social behavior test diagram. The relative exploration time between an unfamiliar congenic mouse and an inanimate dummy object is assessed. b Social interaction behavior in both sexes of the POL offspring compared to CON. Multiple comparisons: ****P < 0.0001. c Locomotor activity in both sexes of POL offspring compared to CON. Data points show the performance of individual animals (n = 7 per sex from 7 litter per group). Bar plots with individual values represent means ± SEM.
Fig. 2
Fig. 2. Oxidative phosphorylation (OXPHOS)-linked respiration in the PFC and AMY from POL-exposed and control male and female adult offspring.
a Representative respirometry traces from a control (CON) (top panel) and a poly(I:C) (POL) (bottom panel) prefrontal cortex (PFC) tissue, which illustrates the change in oxygen concentration (nmol/ml, left y-axis, blue line) and oxygen flux per mass (pmol O2/(s*mg ww, right y-axis, red line)) in adult male mice. Respiratory states were achieved following the SUIT protocol (Substrate, Uncoupling, Inhibition, Titration), consisting of (left-to-right): LEAK (NL) without adenylates (maleate, pyruvate, glutamate); coupled respiration with maximal electron input specific to mitochondrial complex I (NP; addition of ADP); maximal electron input specific to mitochondrial complex I and II (NSP; addition of succinate); maximal uncoupled respiration with electron input from complexes I and II (NSE, step addition of carbonyl cyanide p-trifluoromethoxy phenylhydrazone (FCCP) until maximal increase); uncoupled respiration with maximal electron input specific to mitochondrial complex II (SE, addition of rotenone); and non-mitochondrial residual oxygen consumption (ROX; addition of antimycin A). Following respiratory state analysis, peroxide (H2O2) was added to reoxygenate the chambers to 350 nmol/ml O2 and ascorbate (ASC) and N′, N′, N′, N′-tetramethyl-1,4-phenylendiamine, (TMPD) were simultaneously added to assess cytochrome c oxidase (complex IV, CIV) activity. Mass-specific OXPHOS coupled respiration (NP, NSP), maximal ETC (NSE), and maximal CII-respiration (SE) in: (b) PFC of male mice offspring. Multiple comparisons: **P = 0.003 and *P = 0.026, (c) PFC of female mice offspring. Multiple comparisons: *P = 0.02, (d) AMY of male mice offspring, and (e) AMY of female mice offspring. Multiple comparisons: *P ≤ 0.02, **P = 0.0067. Bar plots with individual values represent means ± SD. n = 7 per sex from 7 litter per group.
Fig. 3
Fig. 3. Cytochrome c oxidase (CIV) activity and mitochondrion-specific respiration in the PFC and AMY from POL-exposed and control male and female adult offspring.
a Cytochrome c oxidase activity (CIV, pmol O2 /(s*mg ww)) in the PFC of male and female adult offspring. POL-exposed mice offspring show higher CIV activity. Multiple comparisons: **P = 0.0052. b Mitochondrion-specific respiration for NP, NSP, NSE, and SE in the PFC of male offspring. Multiple comparisons: **P = 0.003. c Mitochondrion-specific respiration for NP, NSP, NSE, and SE in the PFC of female offspring. d Cytochrome c oxidase activity (CIV, pmol O2/(s*mg ww)) in the AMY of male and female adult offspring. Multiple comparisons: *P < 0.05, **P = 0.0036. e Mitochondrion-specific respiration for NP, NSP, NSE, and SE in the AMY of male offspring. Multiple comparisons: *P = 0.05. f Mitochondrion-specific respiration for NP, NSP, NSE, and SE in the AMY of female offspring. Multiple comparisons: *P ≤ 0.05. Bar plots with individual values represent means ± SD. n = 7 per sex from 7 litter per group.
Fig. 4
Fig. 4. Excess capacity, coupling eficiency, and transcript expression of uncoupling proteins (UCP)s and antioxidant enzymes superoxide dismutase (SODs) in PFC and AMY from POL-exposed and control male and female offspring.
a Excess ETC in the PFC. A significantly higher excess ETC is observed in control males than in control females and POL-exposed mice. Multiple comparisons: ****P < 0.0001 and ***P = 0.0002. b Coupling efficiency in the PFC. A reduction in coupling efficiency is observed in POL-exposed males. Multiple comparisons: *P = 0.03. c Transcript expression analysis of the uncoupling proteins 4 (UCP4) and 5 (UCP5) in the PFC with significantly less transcripts in the POL-exposed offspring. Multiple comparisons: UCP4 *P = 0.026, and UPC5 **P = 0.0066. d Transcript expression analysis of the antioxidant enzymes superoxide dismutase 1 (SOD1) and 2 (SOD2) in the PFC with significantly higher SOD1 expression in control females than in control males and POL-exposed offspring. Multiple comparisons: *P = 0.049, **P = 0.0058. e Excess ETC in the AMY. No significant differences in excess ETC are detected across experimental groups. f Coupling efficiency in the AMY. No alterations were observed. g Transcript expression analysis of UCPs in the AMY. POL-exposed male and female offspring mice show an apparent (but non-statistically significant) reduction in UCP4 and no alterations in UPC5. h Transcript expression analysis of SODs in the AMY. Higher SOD1 expression in control females than in control males is observed. Multiple comparisons: *P = 0.046. Bar plots with individual values represent means ± SD. n = 7 per sex from 7 litter per group.
Fig. 5
Fig. 5. Transcriptional analysis of mitochondria biogenesis in PFC and AMY of control and POL-exposed male and female offspring.
a PGC-1α mRNA expression in the PFC. There is no alteration across groups. b Nrf2 mRNA expression in the PFC. There is no alteration across groups. c Pro-fusion: mitofusin 1 (Mfn1) and mitofusin 2 (Mfn2) mRNA expression in the PFC. Reduced expression in POL-exposed offspring mice. Multiple comparisons: Mfn1, *P = 0.044 and Mfn2, *P = 0.023. d Pro-fission: dynamin 1 (DRP1/Dnm1) and dynamin 2 (Dnm2) mRNA expression in the PFC. Reduced expression in POL-exposed offspring mice. Multiple comparisons: Dnm1, *P = 0.02 and Dnm2, *P = 0.02, **P = 0.002. e PGC-1α mRNA expression in the AMY. There is no alteration across groups. f Nrf2 mRNA expression in the AMY. There is no alteration across groups. g Pro-fusion: Mfn1 and Mfn2 mRNA expression in the AMY. There is no alteration across groups in Mfn1 but a reduction in Mfn2 in POL-exposed females. Multiple comparisons: *P = 0.01. h Pro-fission: Dnm1 and Dnm2 mRNA expression in the AMY. There is no alteration across groups. Bar plots with individual values represent means ± SD. n = 7 per sex from 7 litter per group.
Fig. 6
Fig. 6. RNA scope in situ hybridization of cytochrome B (Cyt B) and cytochrome c oxidase subunit 6a1 (Cox6a1) in neurons and microglia of PFC and AMY from control and POL-exposed male and female offspring.
a Neuronal CytB and Cox6a1 mRNA expression in the PFC. Transcriptional expression is increased in neurons from POL-exposed offspring. Multiple comparisons: CytB: *P = 0.049, Cox6a1: *P = 0.012. b Microglia CytB and Cox6a1 mRNA expression in the PFC. Transcriptional expression is unaltered. c Neuronal CytB and Cox6a1 mRNA expression in the AMY. Transcriptional expression is increased in neurons from POL-exposed offspring. Multiple comparisons: CytB: *P = 0.049, Cox6a1: *P = 0.04. d Microglia CytB and Cox6a1 mRNA expression in the AMY. Transcriptional expression is unaltered. Bar plots with individual values represent means ± SEM. n = 6 per sex from 6 litter per group.

Similar articles

Cited by

References

    1. Banik A, Kandilya D, Ramya S, Stunkel W, Chong YS, Dheen ST. Maternal factors that induce epigenetic changes contribute to neurological disorders in offspring. Genes. 2017;8:150. doi: 10.3390/genes8060150. - DOI - PMC - PubMed
    1. Brown AS, Meyer U. Maternal immune activation and neuropsychiatric illness: a translational research perspective. Am J Psychiatry. 2018;175:1073–83. doi: 10.1176/appi.ajp.2018.17121311. - DOI - PMC - PubMed
    1. Han VX, Patel S, Jones HF, Dale RC. Maternal immune activation and neuroinflammation in human neurodevelopmental disorders. Nat Rev Neurol. 2021;17:564–79. doi: 10.1038/s41582-021-00530-8. - DOI - PubMed
    1. Iwata R, Casimir P, Erkol E, Boubakar L, Planque M, Gallego Lopez IM, et al. Mitochondria metabolism sets the species-specific tempo of neuronal development. Science. 2023;379:eabn4705. doi: 10.1126/science.abn4705. - DOI - PubMed
    1. Xavier JM, Rodrigues CM, Sola S. Mitochondria: major regulators of neural development. Neuroscientist. 2016;22:346–58. doi: 10.1177/1073858415585472. - DOI - PubMed

LinkOut - more resources