. 2024 Jul 15;15(1):5937.
doi: 10.1038/s41467-024-50171-w.

Single-cell multiomics reveals ENL mutation perturbs kidney developmental trajectory by rewiring gene regulatory landscape

Affiliations

Single-cell multiomics reveals ENL mutation perturbs kidney developmental trajectory by rewiring gene regulatory landscape

Lele Song et al. Nat Commun. .

Abstract

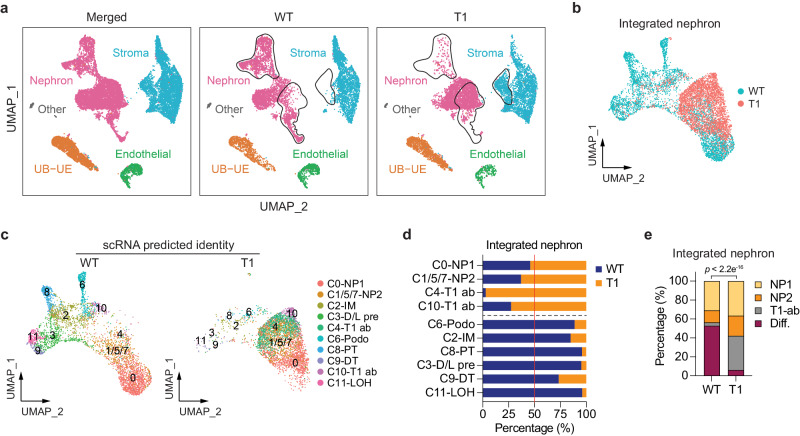
How disruptions to normal cell differentiation link to tumorigenesis remains incompletely understood. Wilms tumor, an embryonal tumor associated with disrupted organogenesis, often harbors mutations in epigenetic regulators, but their role in kidney development remains unexplored. Here, we show at single-cell resolution that a Wilms tumor-associated mutation in the histone acetylation reader ENL disrupts kidney differentiation in mice by rewiring the gene regulatory landscape. Mutant ENL promotes nephron progenitor commitment while restricting their differentiation by dysregulating transcription factors such as Hox clusters. It also induces abnormal progenitors that lose kidney-associated chromatin identity. Furthermore, mutant ENL alters the transcriptome and chromatin accessibility of stromal progenitors, resulting in hyperactivation of Wnt signaling. The impacts of mutant ENL on both nephron and stroma lineages lead to profound kidney developmental defects and postnatal mortality in mice. Notably, a small molecule inhibiting mutant ENL's histone acetylation binding activity largely reverses these defects. This study provides insights into how mutations in epigenetic regulators disrupt kidney development and suggests a potential therapeutic approach.


Conflict of interest statement

L.W. is a co-inventor on a patent filed (US No. 62/949,160) related to the inhibitor used in this manuscript and is a consultant for Bridge Medicines. All other authors declare no competing interests.

Figures

Fig. 1
Fig. 1. Heterozygous expression of mutant ENL disrupts embryonic kidney development and leads to postnatal mortality in mice.
a Schematic of nephrogenesis. Cap mesenchyme (CM), ureteric bud (UB), peritubular aggregate (PA), renal vesical (RV). b Schematic of the mouse breeding and experimental strategy. c Brightfield images of the E15.5 (top) and E18.5 (bottom) kidneys. Scale bar, 1 mm. d, f Hematoxylin and eosin-stained sections showing the histology of E15.5 (d) and E18.5 (f) kidneys from Enl-WT and Enl-T1 embryos. The red star indicates S-shape body, the red arrows indicate tubules, the black dashed circle indicates a region of blastema-like structure (B), and the yellow arrows indicate glomeruli structures. Scale bar in the first column images, 250 µm (d) and 500 µm (f); scale bar in the zoom-in images, 20 µm. e, g Immunostaining for SIX2, KRT8, WT1, E-cadherin (E-cad), LTL, and SLC12a3 at E15.5 (e) and E18.5 (g) kidney sections. Scale bar in the first column images, 150 µm (e) and 100 µm (g); scale bar in the zoom-in images, 50 µm. SB, S-shape body; CB, Comma-shape body; G, glomerulus; PT, proximal tubule; DT, distal tubule. hk Quantification for the numbers of nephron structures per field. h Comma/S-shape body (E15.5, n = 9 WT and 10 T1 kidneys; E18.5, n = 6 WT and 6 T1 kidneys); i glomerulus (E15.5, n = 7 WT and 9 T1 kidneys; E18.5, n = 9 WT and 7 T1 kidneys); j proximal tubule (E15.5, n = 7 WT and 4 T1 kidneys; E18.5, n = 7 WT and 3 T1 kidneys); k distal tubule (E15.5, n = 7 WT and 4 T1 kidneys; E18.5, n = 6 WT and 5 T1 kidneys). Dots represent the number of indicated structures per field. Date represent mean ± s.d.; two-tailed unpaired Student’s t-test. Source data are provided as a Source Data file.
Fig. 2
Fig. 2. Mutant ENL alters the cellular composition, differentiation trajectories, and gene expression programs in the developing kidney.
a UMAP embedding of scRNA-seq data labeled with four main embryonic kidney lineages. UE, ureteric epithelium. b The percentage of four main embryonic kidney compartments within samples. c, d UMAP embedding of integrated scRNA-seq cells from Enl-WT and T1 nephrons. Cells are colored and labeled by annotated cell types (c) or samples (d). D/L pre, distal tubule/loop-of-Henle precursor; T1 ab, T1-abnormal; Podo, podocyte; LOH, loop-of-Henle. e, f The relative distribution of indicated cell clusters between Enl-WT and T1 nephrons (e) or within Enl-WT or T1 nephron (f). Diff., differentiation, including RV, Podo, PT, D/L pre, DT, and LOH cell types. g UMAP embedding represents Enl-WT and T1 scRNA-seq nephron differentiation trajectory. Cells are colored by pseudotime scores. Trajectories are depicted in red. Two distinct trajectories in Enl-T1 nephron are highlighted as “1” and “2”. h The log2 fold change of differentially expressed genes (DEGs) between Enl-WT and T1 within the indicated nephron cell types. T1-UP (or T1-DN), upregulated (or downregulated) in Enl-T1 cells. i, m Gene ontology (GO) term analysis for the union T1-UP (i) and DN (m) DEGs shown in (h). j The log2 fold change of embryonic development-related T1-UP DEGs identified in (i) within the indicated nephron cell types. k Pearson correlation analysis of the Gene Set Variation Analysis (GSVA) scores evaluated by human and mouse ENL_MUT_UP signatures for the Wilms tumor patients from the TARGET dataset. See Supplementary Data 4. Each dot represents the GSVA scores of one TARGET_Wilms tumor patient. R, Pearson correlation coefficient. l The UCell score evaluated by human ENL_MUT_UP signature for the indicated nephron cell types within Enl-WT and T1 datasets, respectively. n Schematic illustrating the impaired nephrogenesis in the Enl-T1 nephron revealed by scRNA-seq. b, f Two-tailed Chi-Square test. i, m One-sided Fisher’s Exact test adjusted by Benjamini–Hochberg procedure. k Two-side t-test. l Two-side Wilcoxon rank-sum test.
Fig. 3
Fig. 3. snATAC-seq reveals changes in the open chromatin landscape in Enl-mutant kidneys during nephrogenesis.
a UMAP embedding of snATAC-seq data labeled with four main embryonic kidney lineages. The dramatically altered clusters between Enl-WT and T1 kidneys are highlighted with black circles. b UMAP embedding of integrated snATAC-seq cells from Enl-WT and T1 nephrons, colored by sample. c UMAP embedding of integrated snATAC-seq cells from Enl-WT (left) and T1 (right) nephrons, respectively. Cells are colored and labeled by the cell types predicted by corresponding scRNA-seq data. d Stacked bar plot showing the percentage of scRNA-seq predicted cell types between Enl-WT and T1 nephrons. e Stacked bar plot showing the percentage of scRNA-seq predicted cell types within Enl-WT and T1 nephrons. Two-tailed Chi-Square test p-value is shown. Diff., differentiation, including RV, Podo, PT, D/L pre, DT, and LOH cell types.
Fig. 4
Fig. 4. Mutant ENL promotes premature commitment of nephron progenitors while restricting their differentiation through misregulation of specific TF regulons.
a, d snATAC data in NP1 (a) and NP2 (d) are plotted as average occupancies and heatmap across the differentially accessible regions (DARs) between Enl-WT and T1 cells. The ATAC signal is normalized by reads per million (RPM). All regions are defined as gained (upregulated in Enl-T1) and lost (down-regulated in Enl-T1). See Supplementary Data 7. b, e GREAT analysis of T1-gained DARs in NP1 (b) and NP2 (e). Binomial test p-values are shown. c, f Dot plot showing the top 20 most significant TFs identified from the motif enrichment analysis for T1 gained or lost DARs in NP1 (c) and NP2 (f). The size of the circles represents the expression level in Enl-WT (blue) or Enl-T1 (red) cells. Binomial test p-values are shown. FC, fold-change. Exp., expression. g Stacked bar plots indicating the percentage of T1-UP DEGs associated with Hox motif enriched T1 gained DAR. h Violin plots showing the expression level of Wnt4 and Cdh6 for NP1, NP2, T1-ab, and IM cell types in Enl-WT or T1 nephrons. i Stacked bar plots indicating the percentage of NP1 cells with or without Wnt4 expression in Enl-WT or T1 nephrons. One-side Fisher’s exact test p-value is shown. j Stacked bar plots indicating the percentage of NP2 cells with or without Cdh6 expression in Enl-WT or T1 nephrons. One-side Fisher’s exact test p-value is shown. k, l The genome browser view of ATAC signals at Wnt4 (k) and Cdh6 (l) gene loci in indicated cell types from Enl-WT (top) or T1 (bottom) nephrons. m Representative images of SIX2/Hoxc9 mRNA co-staining in E15.5 kidneys. CM, cap mesenchyme; UB, ureteric bud; PA, pretubular aggregate. Scale bar = 20 µm. n Representative images of SIX2/Wnt4 mRNA co-staining in E15.5 kidneys. CM cap mesenchyme, UB ureteric bud, PA peritubular aggregate. Scale bar = 20 µm. Data shown in (m, n) are representative of three Enl-WT or T1 kidneys. o Schematic illustrating impaired nephrogenesis phenotypes and potential molecular mechanism we identified in the Enl-T1 NP1 and NP2.
Fig. 5
Fig. 5. An abnormal progenitor state losing nephron chromatin identity emerges in Enl-mutant kidney.
a UMAP embedding of integrated Enl-WT (left) or T1 (right) snATAC-seq nephron differentiation trajectory. Cells are colored by pseudotime. Trajectories are depicted by red arrows. b snATAC data in Enl-T1 for NP1 (left) and T1-ab (right) are plotted as average occupancies (top) and heatmap (bottom) across the DARs between NP1 and T1-ab cells. The ATAC signal is normalized by RPM. All regions are defined as gained (up-regulated in T1-ab, red) and lost (down-regulated in T1-ab, blue), and the corresponding numbers are shown on the left. See Supplementary Data 9. c snATAC data in Enl-T1 for NP2 (left) and T1-ab (right) are plotted as average occupancies (top) and heatmap (bottom) across the T1-ab lost DARs. The ATAC signal is normalized by RPM. The corresponding DAR numbers are shown on the left. See Supplementary Data 9. df Bar plots showing GREAT analysis for T1-ab vs. NP1 lost (d), T1-ab vs. NP2 lost (e), and T1-ab vs. NP1 gained (f) DARs in Enl-T1 cells. g, h, Heatmap showing the motif enrichment p-values of the top TF candidates identified from the motif analysis for the DARs indicated in (b, c). Binomial test p-values are shown. i Heatmap showing the expression level of TFs identified in (g, h) in Enl-WT and Enl-T1 NP1, NP2, and T1-ab scRNA-seq cells. j, k Bar plots showing GO term analysis for T1-ab vs. NP1 DN DEGs (j) and T1-ab vs. NP2 DN DEGs (j) in the Enl-T1 nephron. One-sided p-values for Fisher’s Exact test are shown. l Heatmap showing the expression levels of NPC markers in indicated cell types of Enl-T1 nephron. m Schematic summarizing the GO term analyses performed in (j, k), and Supplementary Fig. 8g–i.
Fig. 6
Fig. 6. Enl-mutant Foxd1+ stromal progenitors exhibit altered chromatin accessibility and might affect stroma-nephron interactions through aberrant activation of Wnt signaling.
a UMAP embedding of integrated scRNA-seq cells from Enl-WT and T1 stroma. SP, stromal progenitor; CS, cortical stroma; Ren/Mes, renin/mesangial cells; MS, medullary stroma; prolif., proliferation; US, ureteric stroma. bd UMAP embedding of integrated scRNA-seq (b) and snATAC-seq (c, d) cells from Enl-WT and T1 stroma. In (c) C0 and C5 are highlighted with black circles. e Schematic illustrating the spatial arrangement of Foxd1+ SP and CM-like population NP1 within the kidney. f snATAC data in Enl-WT and T1 stroma C0 are plotted as average occupancies and heatmap across the DARs between Enl-WT and T1 cells. The ATAC signal is normalized by RPM. All regions are defined as gained and lost. See Supplementary Data 12. g Dot plot showing the top 20 most significant TFs identified from the motif enrichment analysis for T1 gained or lost DARs in stroma C0. The size of the circles represents the expression level in Enl-WT (blue) or Enl-T1 (red) cells. Binomial test p-values are shown. FC, fold-change. Exp., expression. h Scatter plot showing the expression level of the whole mouse genome in Enl-WT and T1 stroma C0. 28 stroma-nephron interaction-related genes implicated or predicted previously are highlighted. See Supplementary Data 13. i The expression level of indicated DEGs highlighted in (h) in Enl-WT and T1 stroma C0. j The UCell score evaluated by nephron specific β-catenin activation signature for the integrated cell types of NP1, NP2, and T1-ab within Enl-WT and T1 nephrons. Two-side Wilcoxon rank-sum test p-values are shown. k UMAP embedding of scRNA-seq NP1, NP2, and T1-ab cells showing the nephron specific β-catenin signature in Enl-WT or T1. Cells are colored by the UCell score of the signature. l ATAC signals at Wnt5a gene locus in stroma C0 from Enl-WT or T1. T1-gained DARs are highlighted and numbered, in which DAR containing Hox TF motif is indicated with star. m Schematic illustrating the model that the nephrogenesis defects in Enl-T1 kidney may be partially attributed to the hyper-activation of nephrogenic β-catenin due to Hox-driven upregulation of Wnt5a in Foxd1+ SP.
Fig. 7
Fig. 7. Blocking the acyl-binding activity of mutant ENL via a small-molecule inhibitor compromises its function on chromatin.
a ITC assay showing TDI-11055 directly binds to ENL-WT and ENL mutants (T1-T3) YEATS domains. b Immunoblots and quantification showing the levels of Flag-ENL T1 and Flag-ENL T1(Y78A) after heat treatment in HEK293 cells at increasing temperatures. Temp, temperature. The experiments have been independently repeated three times with similar results. c mRNA expression (normalized to GAPDH) of HOXA genes in HEK293 cells expressing endogenous levels of Flag-ENL transgenes with indicated treatment. DMSO was used as the vehicle control. The experiments have been independently repeated three times with similar results. Date represent mean ± s.d.; two-tailed unpaired Student’s t-test. d GSEA using custom gene set of upregulated genes in T1 or T2 vs. WT performed in cells treated with DMSO or TDI-11055. See Supplementary Data 14. e NGS plot and heatmap of Flag-ENL ChIP-seq signals at peaks with increased ENL-T1 occupancy in the ENL-T1 DMSO vs. ENL-WT DMSO comparison. See Supplementary Data 16, 17. f The genome browser view of Flag-ENL signals at select ENL-T1 target genes under DMSO or TDI-11055 treatment in HEK293 cells. gj IF staining of Flag-ENL (g) and quantification (hj) in HEK293 cells under DMSO or TDI-11055 treatment. h, Percentage of nuclei with and without Flag-ENL condensates. i the number of condensates in each nucleus (left to right: n = 29, 43, 44, 22). j size of condensates (left to right: n = 173, 180, 342, 210). i, j Center lines indicate median and box limits are set to the 25th and 75th percentiles. Two-tailed unpaired Student’s t-test. kn Representative images of RNA-FISH (k, l) and quantification (m, n) showing the percentage of cells with indicated number of HOXA11 nascent RNA FISH foci and the percentage of cells containing HOXA11 nascent RNA FISH foci overlapped with Flag-ENL condensates (n). Two tailed Chi-square test (m, n). g, k, l Scale bar, 10 µm. Source data are provided as a Source Data file.
Fig. 8
Fig. 8. Transient treatment with TDI-11055 partially rescues mutant ENL-induced developmental and transcriptional defects in the developing kidney.
a Schematic showing the experimental strategy. b E15.5 kidneys. Scale bar, 2 mm. c Left, Histology of E15.5 kidneys as described in (b). The red star indicates S-shape body (SB) and the yellow arrows indicate glomerulus (G) structures. Right, Immunostaining for indicated proteins on E15.5 kidney sections. E-cad, E-cadherin. Scale bar in the first column images: H&E, 500 µm; IF, 100 µm. Scale bar in the zoom-in images, H&E, 20 µm, IF, 50 µm. dg The number of nephron structures per field. d Comma/S-shape body (n of Enl-WT DMSO, Enl-T1 DMSO, Enl-WT TDI, and Enl-T1 TDI = 9, 10, 7, 6 kidneys); e glomerulus (n of Enl-WT DMSO, Enl-T1 DMSO, Enl-WT TDI, and Enl-T1 TDI = 7, 9, 7, 6 kidneys); f proximal tubule (n of Enl-WT DMSO, Enl-T1 DMSO, Enl-WT TDI, and Enl-T1 TDI = 4, 4, 7, 5 kidneys); g distal tubule (n of Enl-WT DMSO, Enl-T1 DMSO, Enl-WT TDI, and Enl-T1 TDI = 4, 4, 3, 3 kidneys). Dots represent the number of indicated structure per field. Date represent mean ± s.d.; Two-tailed unpaired Student’s t-test. h, i UMAP embedding of integrated scRNA-seq cells from Enl-WT, T1, and T1-TDI nephrons. i T1-ab clusters (C2/5) are highlighted in green; Differentiated structures (C3/4/6/7/8) are highlighted in purple. Diff., differentiated. j The percentage of main nephron cell types within Enl-WT, T1, and T1-TDI nephrons. Two-tailed Chi-Square test p-values are shown. k The percentage of all nephron clusters within Enl-WT, T1, and T1-TDI nephrons. l The expression of embryonic development-related T1-UP DEGs identified in Fig. 2k in NP1, NP2, and T1-ab cells from Enl-WT, T1, and T1-TDI nephrons. Gene expression is normalized by Z-score. Hox genes rescued by TDI-11055 treatment are highlighted in red text and those not rescued are highlighted in blue. m The percentage of NP1 cells with or without Wnt4 expression in Enl-WT, T1, or T1-TDI nephrons. One-side Fisher’s exact test p-values are shown. Source data are provided as a Source Data file.
Fig. 9
Fig. 9. Overall summary of the study.
Schematic showing normal nephrogenesis (left box) and that ENL mutation impairs kidney development trajectory by rewiring gene regulatory landscape (right box). The mutant ENL (ENLmut) disrupts kidney development by driving nephron progenitors (NPC) into a committed state while concurrently impeding their further differentiation. This dysregulation involves the misregulation of critical transcription factor regulons, particularly the HOX clusters. ENLmut forms transcriptional condensates at HOX clusters and hyper-activates HOX genes, which in turn, leads to increased expression of priming factors such as Wnt4 and Cdh6 in NPCs. Additionally, ENLmut induces the emergence of abnormal NPCs that lose the chromatin identity typically associated with kidney development. Furthermore, ENLmut might disrupt stroma-nephron interactions through hyperactivation of paracrine Wnt5a signaling. These multifaceted effects resulting from the mutation lead to severe developmental defects in the kidney and early postnatal mortality in mice. Inhibition of the acetylation binding activity of ENLmut with a small molecule (TDI-11055) displaces ENLmut condensates from target genes and abolishes its gene activation function. This intervention effectively restores developmental defects in mice.

Update of

References

    1. Atlasi Y, Stunnenberg HG. The interplay of epigenetic marks during stem cell differentiation and development. Nat. Rev. Genet. 2017;18:643–658. doi: 10.1038/nrg.2017.57. - DOI - PubMed
    1. Yadav T, Quivy J-P, Almouzni G. Chromatin plasticity: a versatile landscape that underlies cell fate and identity. Science (1979) 2018;361:1332–1336. - PubMed
    1. Bibikova M, Laurent LC, Ren B, Loring JF, Fan J-B. Unraveling epigenetic regulation in embryonic stem cells. Cell Stem Cell. 2008;2:123–134. doi: 10.1016/j.stem.2008.01.005. - DOI - PubMed
    1. Mirabella AC, Foster BM, Bartke T. Chromatin deregulation in disease. Chromosoma. 2016;125:75–93. doi: 10.1007/s00412-015-0530-0. - DOI - PMC - PubMed
    1. Treger TD, Chowdhury T, Pritchard-Jones K, Behjati S. The genetic changes of ilms tumour. Nat. Rev. Nephrol. 2019;15:240–251. doi: 10.1038/s41581-019-0112-0. - DOI - PubMed

MeSH terms

LinkOut - more resources