. 2024 Jul 16;15(1):5956.
doi: 10.1038/s41467-024-50098-2.

PRC2-AgeIndex as a universal biomarker of aging and rejuvenation

Affiliations

PRC2-AgeIndex as a universal biomarker of aging and rejuvenation

Mahdi Moqri et al. Nat Commun. .

Abstract

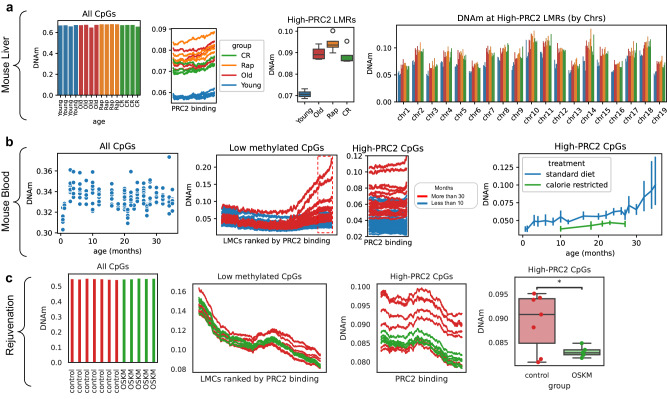
DNA methylation (DNAm) is one of the most reliable biomarkers of aging across mammalian tissues. While the age-dependent global loss of DNAm has been well characterized, DNAm gain is less characterized. Studies have demonstrated that CpGs which gain methylation with age are enriched in Polycomb Repressive Complex 2 (PRC2) targets. However, whole-genome examination of all PRC2 targets as well as determination of the pan-tissue or tissue-specific nature of these associations is lacking. Here, we show that low-methylated regions (LMRs) which are highly bound by PRC2 in embryonic stem cells (PRC2 LMRs) gain methylation with age in all examined somatic mitotic cells. We estimated that this epigenetic change represents around 90% of the age-dependent DNAm gain genome-wide. Therefore, we propose the "PRC2-AgeIndex," defined as the average DNAm in PRC2 LMRs, as a universal biomarker of cellular aging in somatic cells which can distinguish the effect of different anti-aging interventions.


Conflict of interest statement

V.S. is a co-founder, SAB Chairman, Head of Research, and shareholder of Turn Biotechnologies. S.H. is a founder of the non-profit Epigenetic Clock Development Foundation. M.M., A.C., V.S., M.P.S., and V.N.G. have filed patents on measuring aging. V.N.G. is supported by NIA grants. The remaining authors declare no competing interests.

Figures

Fig. 1
Fig. 1. Low-methylated regions are common across different cell types.
a Venn diagram showing the overlap between the low-methylated regions (LMRs) identified in epidermis (GSE52972), CD4+ T-cells (GSE31263), and hESCs (H1, GSE16256). b Genome browser visualization of ELOVL2 gene locus showing the DNA methylation tracks of old and young epidermis (GSE52972), old and young CD4+ T-cells (GSE31263), and the ChIP-Seq coverage of SUZ12 and EZH2 in hESCs from ENCODE (see “Methods” section and Supplementary Data 1). c Dotplot showing predominantly positive Δ DNAm (DNAm old - DNAm young) at LMRs with high-PRC2 binding (top 1000, highlighted in red) in CD4+ T-cells (left panel, mean: 0.08., variance: 0.008) and epidermis (right panel, mean: 0.05, variance: 0.007).
Fig. 2
Fig. 2. PRC2 targets gain DNA methylation by age.
a Average DNAm levels at CpGs across the whole genome (left panel) and at the LMRs ranked by the level of PRC2 binding in hESCs or mESCs (right panels). Data were obtained by analyzing WGBS datasets from human CD4+ T-cells (6 samples 18–86 years old, GSE79798 and 2 samples 0 and 103 years old, GSE31263), human epidermis (12 samples from 6 different ages, each age including a sun-exposed and sun-protected sample averaged for this analysis, GSE52972), and mouse hepatocytes (8 samples, 4 2 months vs 4 22 months, GSE89274). PRC2 binding was evaluated using EZH2 and SUZ12 ChIP-Seq data from ENCODE in H1 hESCs and in mESCs (see Supplementary Data 1). One outlier sample was removed (see “Methods” section). b Average DNAm levels at high-PRC2 LMRs shown for each autosomal chromosome. c Average DNAm levels at high-PRC2 LMRs in skin-exposed versus skin-protected samples derived from donors of different ages. Each sample of the same age (skin protected and skin exposed) derives from the same donor. Data are from the same human epidermis WGBS datasets shown in a. High-PRC2 LMRs (top 1000 PRC2-binding LMRs in a given tissue) are highlighted with dotted red boxes.
Fig. 3
Fig. 3. Gain of DNAm at PRC2 targets is measurable using different assays.
a Average DNAm levels at CpGs across the whole genome (left panel) and at low-methylated CpGs (LMCs) ranked by the level of their PRC2 binding in hESCs (right panels). Data were obtained by analyzing DNA methylation microarray data from human PBMC samples. Data from four different HM450 datasets (GSE40279, n = 656, GSE42861, n = 689, GSE152027, n = 471, and GSE55763, n = 2711) are shown in each panel. PRC2 binding was estimated by using EZH2 and SUZ12 ChIP-Seq data from ENCODE in the H1 cell line (see “Methods” section). b Average DNAm levels in different mouse tissues at LMCs ranked by the level of their PRC2 binding in mESCs (left panel). The right panel shows the same data represented as averages. Data were obtained from an RRBS dataset (GSE120137). One outlier sample was removed from all analyses (see “Methods” section). One-sided independent t-tests were performed between young and old for each tissue (adipose p = 1.4e−09, blood p = 2.2e−04, kidney p = 7.6e−03, liver p = 1.5e−16, lung p = 1.1e−09, muscle p = 4.9e−04). c Average DNAm levels at LMCs with high-PRC2 binding in mESCs, in mouse hepatocytes from scWGBS dataset (SRP069120). One outlier sample was removed from each category according to Trapp et al. (see “Methods” section). One-sided independent t-tests were performed between young and old samples (p = 4.9e−04). p-value cutoffs for all boxplots are represented graphically by *<0.05, **<0.01, ***<0.001, ****<0.0001. For boxplots, boxes show the quartiles of the dataset with median bar in the center of the box, whiskers represent the range of data (excluding any outliers which are represented as black circles).
Fig. 4
Fig. 4. PRC2 targets DNAm as a marker of rejuvenation.
a Average DNAm levels at CpGs across the whole genome (left panel), at the high-PRC2 LMRs (middle panel), in liver samples from young, old, calorie-restricted (CR), and rapamycin-treated (Rap) mice. The boxplot (right), shows the average DNAm levels between the 4 biological replicates (WGBS dataset GSE89274, n = 16). b Average DNAm levels at CpGs across the whole genome (left panel) and at LMCs ranked by the level of their PRC2 binding in mESCs (middle panels), average DNAm levels in high-PRC2 LMCs at different ages in blood samples from control and calorie-restricted mice (right panel, error bars represent 95% CI for aggregated samples at each timepoint) (RRBS dataset GSE80672, n = 110). c Average DNAm levels at CpGs across the whole genome (left panel), and at the LMCs ranked by the level of their PRC2 binding in mESCs from long-term partial reprogramming experiments profile with HorvathMammalianMethylChip40 microarrays (dataset GSE190665, n = 12) (middle and left panels; right panel displays difference as a boxplot). One-sided independent t-tests were performed between control and OSKM-treated samples (p = 4.8e−02), with p-value cutoffs represented graphically by *<0.05. For boxplots, boxes show the quartiles of the dataset with median bar in the center of the box, whiskers represent the range of data (excluding any outliers which are represented as black circles).
Fig. 5
Fig. 5. PRC2 targets gain DNA methylation by cell division.
a Average DNAm levels at CpGs across the whole genome (left panel), at LMRs ranked by the level of their PRC2 binding in hESCs (center panel) and within high-PRC2 regions (right panel) from 8 different tumor and normal samples. Data were obtained from TCGA WGBS datasets, (see Supplementary Data 1). Error bars on the right show 95% confidence intervals for average DNAm across high-PRC2 LMRs for each sample. b Average DNAm levels at CpGs across the whole genome (left panel) and at LMRs ranked by the level of their PRC2 binding in hESCs (right panel) from young vs old human oligodendrocytes. (WGBS dataset, GSE107729, n = 6). c Average DNAm levels at CpGs across the whole genome (left panel) and at LMRs ranked by the level of their PRC2 binding in hESCs (middle panel), correlation between average DNAm at high-PRC2 LMRs and the number of passages (right panel, shaded area of line plot represents 95% CI) in in vitro cultured fibroblasts (GSE79798, n = 5). High-PRC2 LMRs are highlighted with dotted red boxes.
Fig. 6
Fig. 6. PRC2 complex is also associated with high-PRC2 LMRs in fully differentiated tissues.
a Average DNAm levels of neonatal and old passaged fibroblasts, and CD4 T-cells, at CpGs across the whole genome (left panel) and at the LMRs ranked by the level of EZH2-binding data of the same respective tissue (middle panels). Bottom panels show heatmaps of LMR rank number, ordered by EZH2 binding in their respective tissue (top heatmap) and in hESCs (bottom heatmap). Heatmaps are colored by EZH2 binding in the same respective tissue, i.e. purple/orange represents high and low-ranked neonatal/old LMRs ordered by neonatal/old fibroblasts PRC2 binding, respectively, and red/blue represent high and low-ranked CD4 T-cells LMRs ordered by CD4 T-cells PRC2 binding, respectively. Right panel shows the correlation of mean methylation of high-PRC2 LMRs against age or passage number. b Average methylation levels at LMRs ranked by PRC2 binding in hESCs for neonatal fibroblasts (left panels) and old fibroblasts (right panels). c Average DNAm levels of LMRs calculated from neonatal and old samples merged (all passages), ranked by PRC2 binding in hESCs (left panel) and correlation between methylation and age for high-PRC2 LMRs of both neonatal and old in vitro passaged fibroblasts (right panel). d Heatmap of normalized read density of the high-PRC2 neonatal/old LMRs in neonatal and old fibroblasts (passage 2). WGBS Neonatal and old fibroblasts were generated by our lab (GSE253987, n = 3 for neonatal samples (one donor) and n = 3 for old samples (one donor)), CD4 T-cell samples are the same as used in Fig. 2 (6 samples 18–86 years old, GSE79798 and 2 samples 0 and 103 years old, GSE31263). ChIP data for fibroblast and CD4 T-cells were generated by our lab (GSE253987, two donors pooled at passage 2 for neonatal fibroblasts, three donors pooled at passage 2 for old fibroblasts, three donors pooled for CD4 T-cells). High-PRC2 LMRs are highlighted with dotted red boxes. Line plots with >3 samples plotted have a shaded area representing 95% CI.

References

    1. Moqri, M. et al. Biomarkers of aging for the identification and evaluation of longevity interventions. Cell.186, 3758–3775 (2023). - PMC - PubMed
    1. Moqri, M. et al. Validation of biomarkers of aging. Nat. Med.30, 360–372 (2024). - PMC - PubMed
    1. Jylhava J, Pedersen NL, Hagg S. Biological age predictors. EBioMedicine. 2017;21:29–36. doi: 10.1016/j.ebiom.2017.03.046. - DOI - PMC - PubMed
    1. Horvath S, Raj K. DNA methylation-based biomarkers and the epigenetic clock theory of ageing. Nat. Rev. Genet. 2018;19:371–384. doi: 10.1038/s41576-018-0004-3. - DOI - PubMed
    1. Dabrowski, J. K. et al. Probabilistic inference of epigenetic age acceleration from cellular dynamics. Preprint at bioRxiv10.1101/2023.03.01.530570 (2023).