. 2024 Jul 15;15(1):5949.
doi: 10.1038/s41467-024-50283-3.

Single-cell transcriptomics analysis of bullous pemphigoid unveils immune-stromal crosstalk in type 2 inflammatory disease

Affiliations

Single-cell transcriptomics analysis of bullous pemphigoid unveils immune-stromal crosstalk in type 2 inflammatory disease

Tingting Liu et al. Nat Commun. .

Abstract

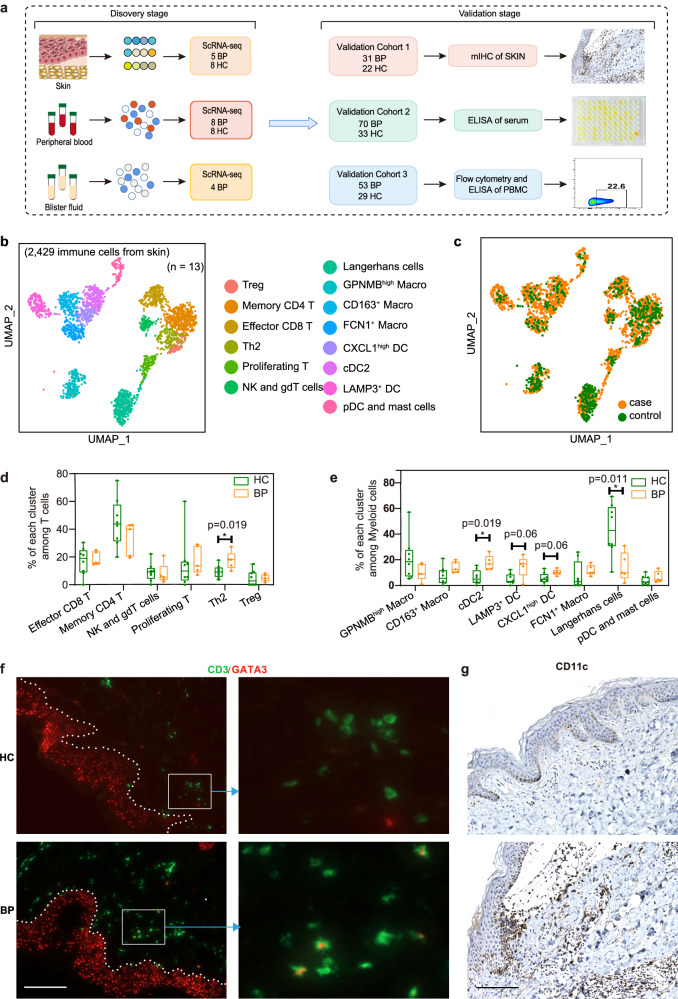
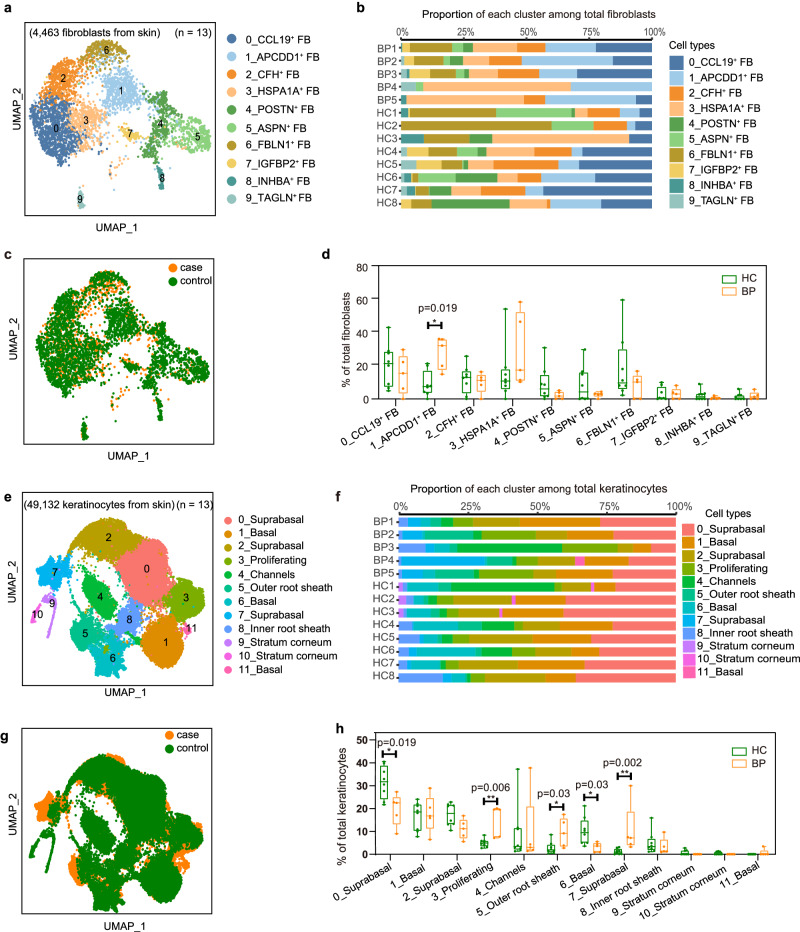
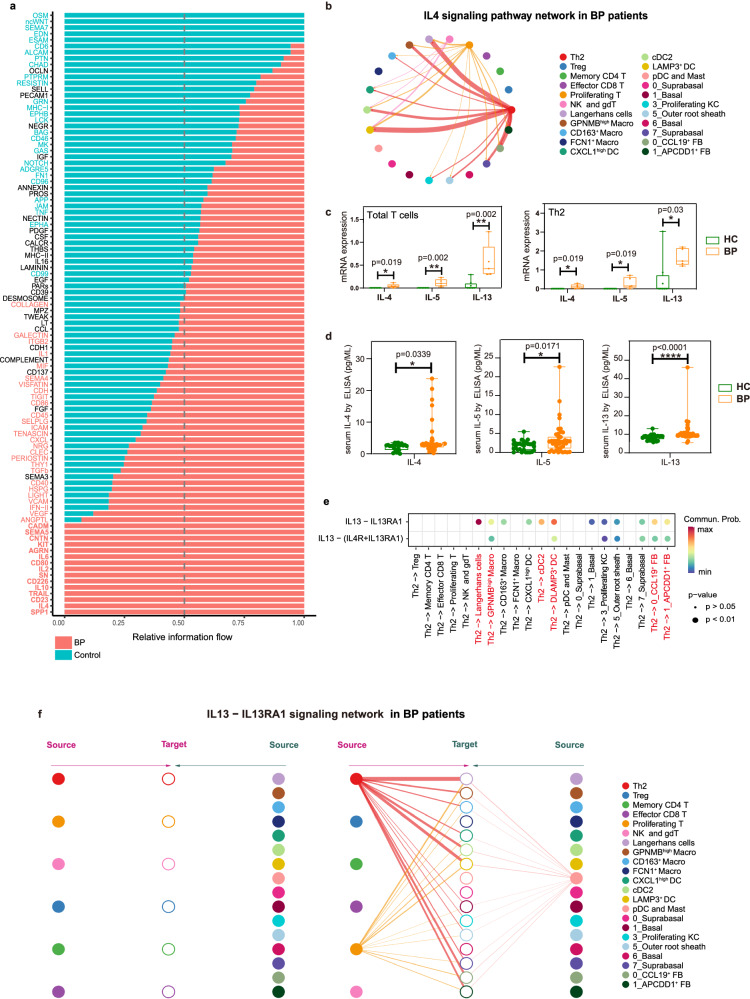
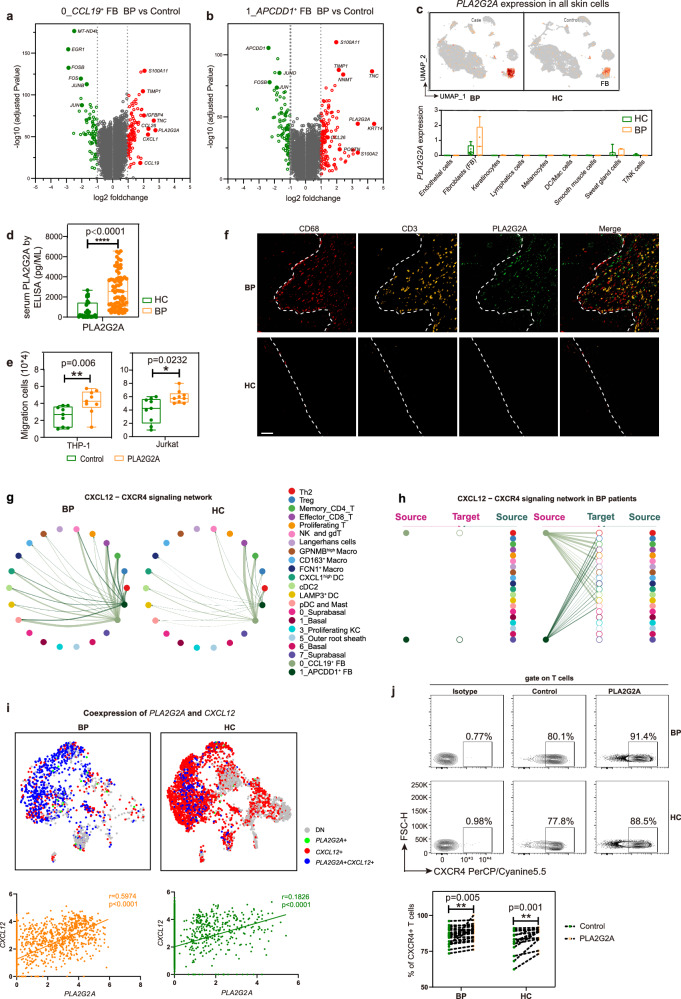
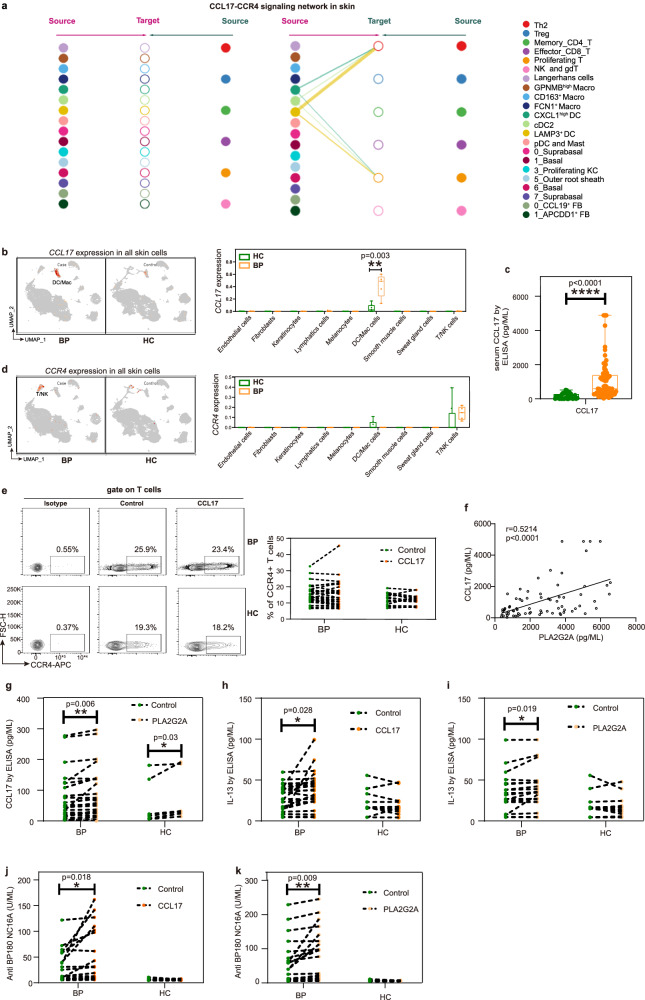
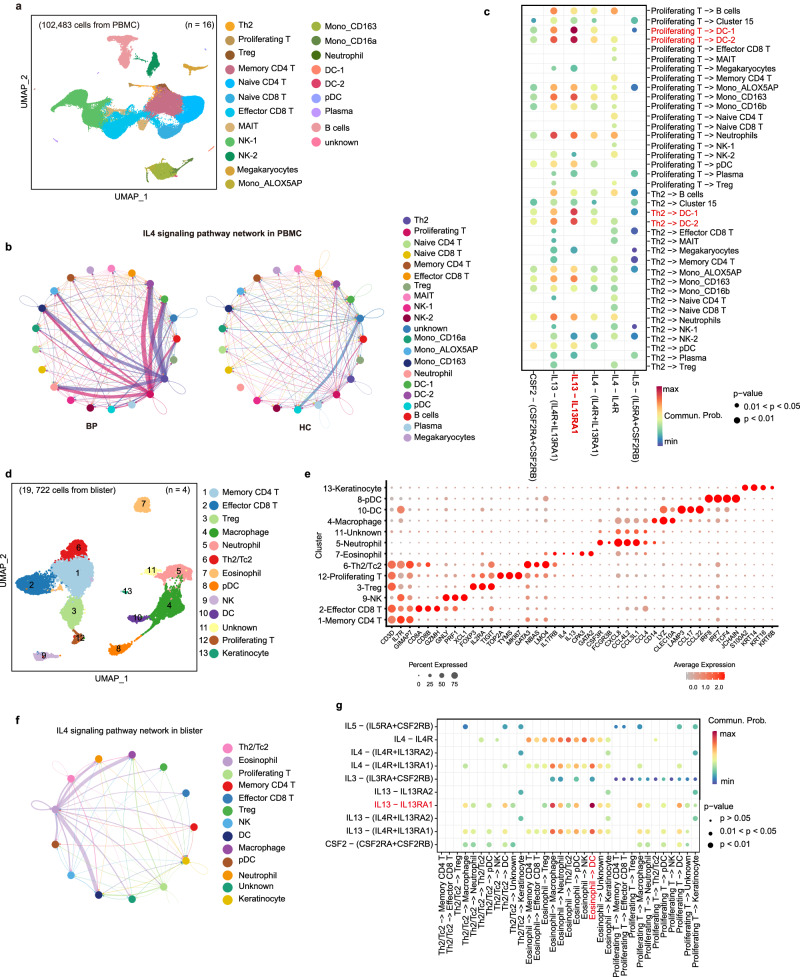
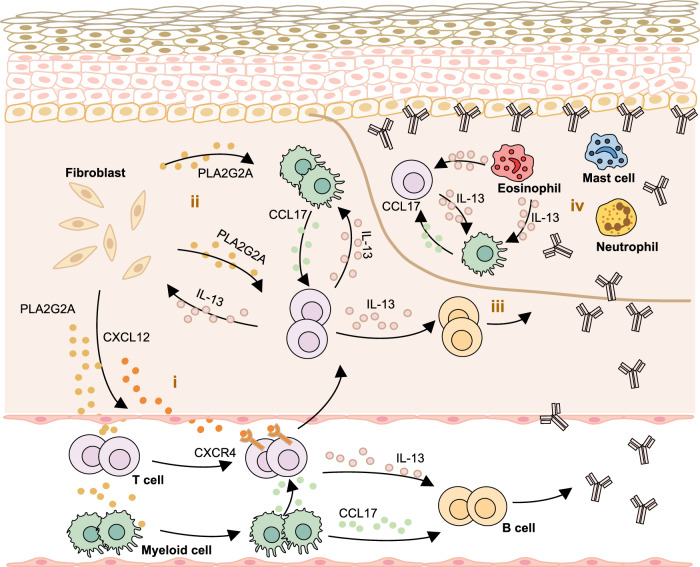
Bullous pemphigoid (BP) is a type 2 inflammation- and immunity-driven skin disease, yet a comprehensive understanding of the immune landscape, particularly immune-stromal crosstalk in BP, remains elusive. Herein, using single-cell RNA sequencing (scRNA-seq) and in vitro functional analyzes, we pinpoint Th2 cells, dendritic cells (DCs), and fibroblasts as crucial cell populations. The IL13-IL13RA1 ligand-receptor pair is identified as the most significant mediator of immune-stromal crosstalk in BP. Notably, fibroblasts and DCs expressing IL13RA1 respond to IL13-secreting Th2 cells, thereby amplifying Th2 cell-mediated cascade responses, which occurs through the specific upregulation of PLA2G2A in fibroblasts and CCL17 in myeloid cells, creating a positive feedback loop integral to immune-stromal crosstalk. Furthermore, PLA2G2A and CCL17 contribute to an increased titer of pathogenic anti-BP180-NC16A autoantibodies in BP patients. Our work provides a comprehensive insight into BP pathogenesis and shows a mechanism governing immune-stromal interactions, providing potential avenues for future therapeutic research.


Conflict of interest statement

The authors declare no competing interest.

Figures

Fig. 1
Fig. 1. Sub-clustering of immune cells from the skin scRNA-seq dataset.
a Flowchart depicting the overall experimental design of this study. The number of patients with bullous pemphigoid (BP) and healthy controls (HC) for the discovery cohort and each validation cohort were indicated. b UMAP visualization of the sub-clustering of skin immune cells of the discovery cohort. c UMAP plot for skin immune cells split by BP patients and HC. Cells from patients with BP are shown in orange, whereas cells from HC are shown in green. d Percentage of each T cell subset among all T cells between BP patients (n = 5) and HC (n = 8). e Frequency of each myeloid subset among all myeloid cells between BP patients (n = 5) and HC (n = 8). P-values in d and e were calculated using two-sided Mann–Whitney U-test. Each sample is represented as one dot. *P < 0.05. In the box plot d and e: Minima: Lower limit of the whisker. Maxima: Upper limit of the whisker. Center: Median line inside the box. The upper and lower box bounds represent the 25% and 75% percentile of data. f Immunofluorescence co-staining showing the co-localization of GATA3 and T cell marker CD3 in BP lesions. scale bar = 150 μm. g Immunochemistry staining showing the CD11c-expressed DC cells within the lesions of BP patients. scale bar = 150 μm. Data are from three independent experiments in f and g. DC, Dendritic Cells.
Fig. 2
Fig. 2. Heterogeneity of fibroblasts and keratinocytes from the skin scRNA-seq dataset.
a UMAP plot of the fibroblasts (FB) colored by major cell clusters. b Bar plots illustrate the relative contributions of fibroblasts cell types in each sample. c UMAP plot for fibroblasts split by BP patients and HC. Cells from patients with BP are shown in orange, whereas cells from HC are shown in green. d Percentage of each fibroblast subset among all fibroblasts between BP (n = 5) and HC (n = 8). e UMAP visualization of the sub-clustering of keratinocytes of the discovery cohort. f Bar plots illustrate the relative contributions of keratinocytes cell types in each sample. g UMAP plot for keratinocytes split by BP patients and HC. h Frequency of each keratinocyte subset among all keratinocytes between BP (n = 5) and HC (n = 8). P-values in d and h were calculated using two-sided Mann–Whitney U-test, only P-values < 0.05 are shown. In the box plot d and h: Minima: Lower limit of the whisker. Maxima: Upper limit of the whisker. Center: Median line inside the box. The upper and lower box bounds represent the 25% and 75% percentile of data. Each sample is represented as one dot. *P < 0.05, **P < 0.01.
Fig. 3
Fig. 3. The IL13-IL13RA1 mediates the interaction between Th2 and fibroblasts/myeloid cells.
a Significant signaling pathways were ranked based on differences in the overall information flow within the inferred networks between BP and HC skin scRNA-seq dataset. We have added the abbreviations in Supplementary data 15. b Circle plot of the inferred IL4 signaling pathway among major cell types in the BP group. c Bar charts showing IL4, IL5 and IL13 mRNA expression within total T cells (left) and Th2 subpopulation (right) between BP (n = 5) and HC (n = 8). d Protein levels of IL-4, IL-5 and IL-13 in serum from BP (n = 43) and HC (n = 29) examined by ELISA. In the box plot c and d: Minima: Lower limit of the whisker. Maxima: Upper limit of the whisker. Center: Median line inside the box. The upper and lower box bounds represent the 25% and 75% percentile of data. Each sample is represented as one dot. e Comparison of the multiple ligand–receptor pairs among IL4 signaling pathway originated from Th2 cells. P-values were computed from one-sided permutation test (CellChat 1.5.0). f Hierarchical plot showing inferred intercellular communication network of IL13-IL13RA1 signaling in BP skin. Left and right portions show autocrine and paracrine signaling, respectively. In the left part: The six T cell clusters in the middle acted as the signal-receiving cells. The left half of the diagram depicts autocrine signal, which refers to IL13 signal released by the six T cell clusters that act on themselves. Correspondingly, the right half shows paracrine signal, which IL13 signal released by other types of cells that act on the six T cell clusters. In the right part: The non-T cell clusters acted as the signal-receiving cells. The left half of the diagram depicts paracrine signal, which IL13 released by six T cell clusters that act on these non-T cell clusters. While, the right half shows autocrine signals, which are signals released by these non-T cell clusters that act on themselves. P-values in c and d were calculated using two-sided Mann–Whitney U-test. *P < 0.05, **P < 0.01, ****P < 0.0001.
Fig. 4
Fig. 4. The immune-stromal cell crosstalk recruits immune cells via CXCL12/CXCR4 axis mediated by PLA2G2A in BP patients.
a Volcano plot of gene features of the CCL19+ FB cluster in BP patients compared to HC. b Volcano plot of gene features of the APCDD1+ FB cluster in BP patients compared to HC. P-values in a and b were obtained using the two-sided Likelihood-ratio test and Bonferroni corrected (Seurat 4). c The feature plot and the bar chart showing PLA2G2A mRNA expression within total skin cells between BP (n = 5) and HC (n = 8). d Protein level of PLA2G2A in serum from BP (n = 73) and HC (n = 31) examined by ELISA. e Transwell assays were used to measure cell migration of THP1 (n = 9) and Jurkat (n = 9) cells treated by PLA2G2A recombinant protein. P-values in ce were calculated using two-sided Mann–Whitney U-test. *P < 0.05, **P < 0.01, ****P < 0.0001. In the box plot ce: Minima: Lower limit of the whisker. Maxima: Upper limit of the whisker. Center: Median line inside the box. The upper and lower box bounds represent the 25% and 75% percentile of data. f Representative images of a BP patient and HC stained by multicolored IHC; green represents PLA2G2A+ fibroblasts, red represents macrophages, and yellow represents CD3 T cells. scale bar = 50 μm. Data are from three independent experiments. g Circle plots of the inferred CXCL12-CXCR4 pathway among major cell types in the BP and HC groups. h Hierarchical plot showing inferred intercellular communication network of CXCL12-CXCR4 signaling in BP skin. i The PLA2G2A/CXCL12 gene pair co-expression (upper panel), and the gene expression correlation analysis in expressing both genes (lower panel) in fibroblasts. The correlation was measured using the Pearson correlation coefficient. P-values were calculated using two-sided Pearson correlation test. j Flow plots of CD3+ T cells from PBMCs showing the expression of CXCR4 treated by PLA2G2A recombinant protein (upper panel), and the frequency of CXCR4 (lower panel) in BP (n = 21) and HC (n = 13) groups. P-values were calculated using paired two-sided Student’s t-test. **P < 0.01. Each sample is represented as one dot.
Fig. 5
Fig. 5. CCL17 is increased in IL-13-responsive myeloid cells in BP patients, and CCL17 and PLA2G2A promote the secretion of IL-13 and pathogenic anti-BP180-NC16A autoantibody.
a Hierarchical plot showing inferred intercellular communication network of CCL17-CCR4 signaling. b The feature plot and the bar chart showing CCL17 mRNA expression within total skin cells between BP (n = 5) and HC (n = 8). c Protein level of CCL17 in serum from BP (n = 73) and HC (n = 32) by ELISA. d The feature plot and the bar chart showing CCR4 mRNA expression within total skin cells between BP (n = 5) and HC (n = 8). In the box plot bd: Minima: Lower limit of the whisker. Maxima: Upper limit of the whisker. Center: Median line inside the box. The upper and lower box bounds represent the 25% and 75% percentile of data. e Flow plots of CD3+ T cells from PBMCs showing the expression of CCR4 treated by CCL17 recombinant protein (left panel), and the frequency of CCR4 (right panel) in BP (n = 30) and HC (n = 16) groups. f The positive correlation between the level of PLA2G2A and CCL17 in serum from in BP patients (n = 73). P-value was calculated using two-sided Pearson correlation test. r-value was Pearson correlation coefficient. g The level of CCL17 in PBMC from BP patients (n = 26) and HC (n = 7) treated with PLA2G2A recombinant protein. h Effect of CCL17 treatment on the IL-13 secretion from BP patients (n = 26) and HC (n = 13). i Effect of PLA2G2A treatment on the IL-13 secretion from BP patients (n = 20) and HC (n = 13). j, k ELISA analysis of anti-BP180-NC16A antibody titers in supernatants of CCL17 (j) or PLA2G2A (k) stimulated PBMCs from BP patients (n = 26) and HC (n = 22). P-values in b–d were calculated using two-sided Mann–Whitney U-test. P-values in e and gk were calculated using paired two-sided Student’s t-test. *P < 0.05, **P < 0.01, ****P < 0.0001, only P-values < 0.05 are shown. Each sample is represented as one dot.
Fig. 6
Fig. 6. IL13-IL13RA1 is the most significant ligand–receptor pair among IL4 signaling pathways in PBMC and blister scRNA-seq datasets.
a UMAP visualization of the PBMCs scRNA-seq profile. b Circle plot of the inferred IL4 signaling pathway in PBMC samples from the BP and HC groups. c Comparison of the multiple ligand–receptor pairs among IL4 signaling pathway in PBMCs. d UMAP visualization of the cells from blister scRNA-seq profile. e Expressions of major discriminative marker genes for cell types identification of blister scRNA-seq dataset. f Circle plot of the inferred IL4 signaling pathway in blister samples from the BP group. g Comparison of the multiple ligand–receptor pairs among IL4 signaling pathway in blister cells. P-values in c and g were computed from one-sided permutation test (CellChat 1.5.0).
Fig. 7
Fig. 7. Schematics of the immune-stromal crosstalk in BP patients.
It illustrates a positive feedback loop where fibroblasts respond to Th2 cells through the IL13RA1-IL13 pair, leading to increased secretion of PLA2G2A and CXCL12. This, in turn, amplifies the Th2-mediated response. (i) The lesional fibroblasts respond to IL-13 and induce the overexpression of PLA2G2A, which promotes the expression of CXCR4 on the surface of immune cells to recruit the immune cells from peripheral blood into skin lesions. (ii) Fibroblasts-derived PLA2G2A and myeloid cells-derived CCL17 elevate the secretion of IL-13, and fibroblast and myeloid cells further respond to IL-13, forming a positive feedback loop between immune cells and fibroblasts. (iii) IL-13 activates B cells to secrete autoantibodies. (iv) In blister, the secretion of autoantibodies recruits T cells, myeloid cells, mast cells, neutrophils and eosinophils. T cell-derived IL-13 activates eosinophils to secrete various cytokines (including IL-13), which further promotes Th2 polarization and mediates the crosstalk between immune cells.

Similar articles

Cited by

References

    1. Kridin K, Ludwig RJ. The Growing incidence of bullous pemphigoid: overview and potential explanations. Front Med (Lausanne) 2018;5:220. doi: 10.3389/fmed.2018.00220. - DOI - PMC - PubMed
    1. Lu L, Chen L, Xu Y, Liu A. Global incidence and prevalence of bullous pemphigoid: A systematic review and meta-analysis. J. Cosmet. Dermatol. 2022;21:4818–4835. doi: 10.1111/jocd.14797. - DOI - PubMed
    1. Yan T, Zhang Z. Adaptive and innate immune pathogenesis of bullous pemphigoid: A review. Front Immunol. 2023;14:1144429. doi: 10.3389/fimmu.2023.1144429. - DOI - PMC - PubMed
    1. Persson MSM, et al. The global incidence of bullous pemphigoid: a systematic review and meta-analysis. Br. J. Dermatol. 2022;186:414–425. doi: 10.1111/bjd.20743. - DOI - PubMed
    1. Schmidt E, Zillikens D. Pemphigoid diseases. Lancet. 2013;381:320–332. doi: 10.1016/S0140-6736(12)61140-4. - DOI - PubMed

MeSH terms

LinkOut - more resources