. 2024 Jul 15;15(1):5954.
doi: 10.1038/s41467-024-50305-0.

Investigating grey matter volumetric trajectories through the lifespan at the individual level

Collaborators, Affiliations

Investigating grey matter volumetric trajectories through the lifespan at the individual level

Runye Shi et al. Nat Commun. .

Abstract

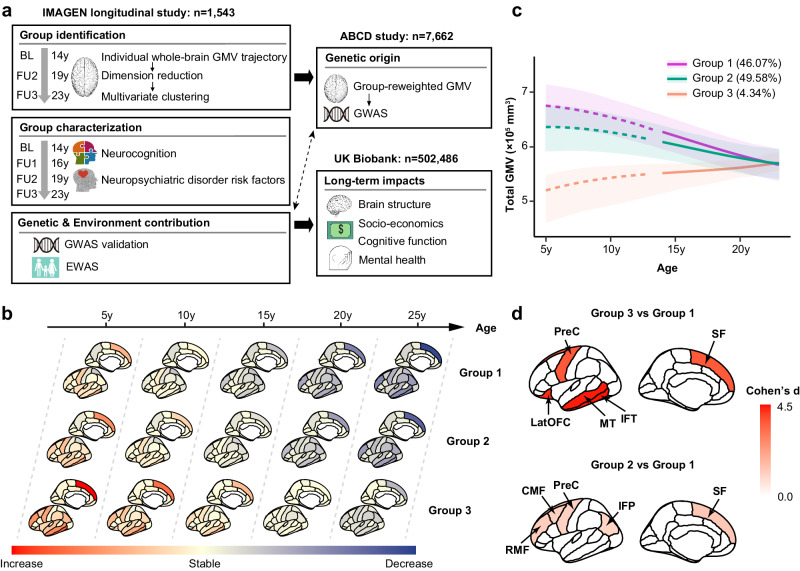
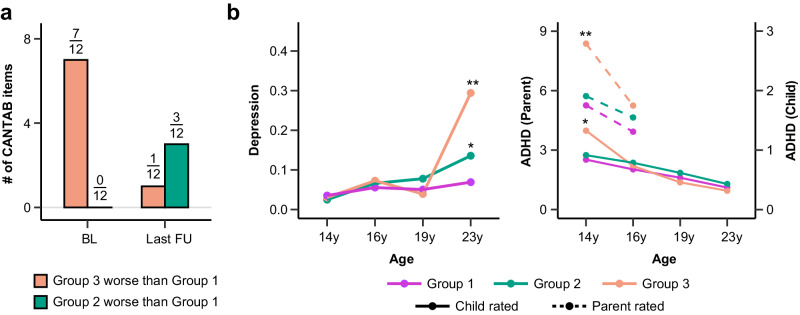
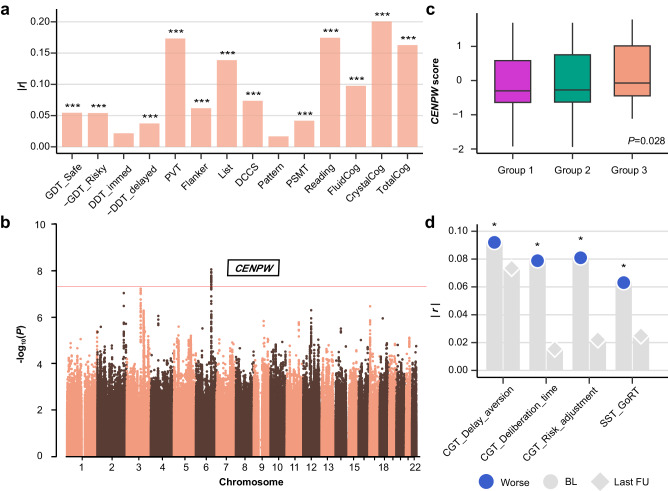
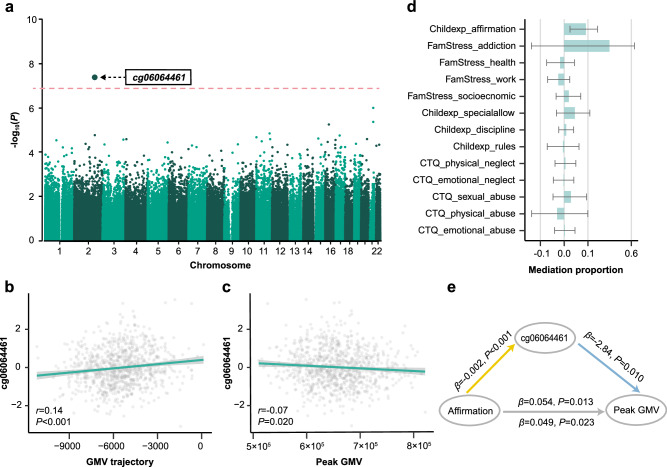
Adolescents exhibit remarkable heterogeneity in the structural architecture of brain development. However, due to limited large-scale longitudinal neuroimaging studies, existing research has largely focused on population averages, and the neurobiological basis underlying individual heterogeneity remains poorly understood. Here we identify, using the IMAGEN adolescent cohort followed up over 9 years (14-23 y), three groups of adolescents characterized by distinct developmental patterns of whole-brain gray matter volume (GMV). Group 1 show continuously decreasing GMV associated with higher neurocognitive performances than the other two groups during adolescence. Group 2 exhibit a slower rate of GMV decrease and lower neurocognitive performances compared with Group 1, which was associated with epigenetic differences and greater environmental burden. Group 3 show increasing GMV and lower baseline neurocognitive performances due to a genetic variation. Using the UK Biobank, we show these differences may be attenuated in mid-to-late adulthood. Our study reveals clusters of adolescent neurodevelopment based on GMV and the potential long-term impact.


Conflict of interest statement

Dr Banaschewski served in an advisory or consultancy role for Lundbeck, Medice, Neurim Pharmaceuticals, Oberberg GmbH, Shire. He received conference support or speaker’s fee by Lilly, Medice, Novartis and Shire. He has been involved in clinical trials conducted by Shire & Viforpharma. He received royalties from Hogrefe, Kohlhammer, CIP Medien, Oxford University Press. The present work is unrelated to the above grants and relationships. Dr Barker receives honoraria for teaching from GE Healthcare. Dr Poustka served in an advisory or consultancy role for Roche and Viforpharm and received speaker’s fee by Shire. She received royalties from Hogrefe, Kohlhammer and Schattauer. The present work is unrelated to the above grants and relationships. The other authors declare no competing interests.

Figures

Fig. 1
Fig. 1. Whole-brain gray matter volume (GMV) developmental patterns define three neurodevelopmental groups.
a Schematic workflow of the analytic methodologies. GMV trajectory in 44 ROIs spanning the whole brain was estimated for adolescents in the IMAGEN study (n = 1543). Multivariate clustering was conducted to identify groups with distinct neurodevelopmental patterns, followed by group characterization. Genome-wide association study (GWAS) was conducted in the ABCD study (n = 7662) using the proxy phenotype, and epigenome-wide association study (EWAS) was conducted in IMAGEN (n = 909). Last, long-term impacts of the polygenic risk for delayed neurodevelopment were investigated among participants in UK Biobank (n = 502,486). BL, baseline; FU, follow-up. b Whole-brain GMV growth rates (ranging from increase, stable to decrease) at age 5 y, 10 y, 15 y, 20 y and 25 y were estimated for each group, adjusting for sex, imaging site, handedness, and intracranial volume. Group 3 showed delayed GMV development compared to Group 1 and 2. c Total GMV developmental trajectories (with 95% confidence bands; the center of the band represents the estimated mean total GMV trajectories within each group) for the three groups (purple for Group 1; green for Group 2; orange for Group 3). These trajectories were estimated adjusting for sex, imaging site, handedness, and intracranial volume. Group 1 and 2 exhibited similar GMV developmental trend, while Group 3 had opposite GMV developmental trend. d Top 5 discriminating ROIs with largest t values comparing the GMV trajectories between Group 3 (n = 67) and Group 1 (n = 711) (top), and between Group 2 (n = 765) and Group 1 (n = 711) (bottom), adjusting for sex, imaging site, handedness and intra-cranial volume. Two sample two-tailed t-test: Group 3 vs Group1, IFT (d = 4.43, t = 20.13, Padj < 0.001), MT (d = 4.38, t = 20.07, Padj < 0.001), LatOFC (d = 4.26, t = 18.31, Padj < 0.001), PreC (d = 3.63, t = 18.11, Padj < 0.001), SF (d = 3.61, t = 17.92, Padj < 0.001); Group 2 vs Group 1, SF (d = 1.28, t = 24.50, Padj < 0.001), RMF (d = 1.14, t = 21.95, Padj < 0.001), CMF (d = 1.09, t = 20.77,Padj < 0.001), PreC (d = 1.05, t = 20.14, Padj < 0.001), IFP (d = 1.00, t = 19.07, Padj < 0.001). LatOFC lateral orbitofrontal cortex, RMF rostral middle frontal, CMF caudal middle frontal, SF superior frontal, PreC precentral, MT middle temporal, IFT inferior temporal, IFP inferior parietal. Relevant source data were provided in the Source Data file.
Fig. 2
Fig. 2. Structural neurodevelopment predicts neurocognition and risk factors for neuropsychiatric disorders.
a Comparison of neurocognitive performances between Group 3 and Group 1 (orange), and between Group 2 and Group 1 (green) at baseline (BL) and the last follow-up (FU). Total number of neurocognitive tests in CANTAB where Group 3 performed worse than Group 1 decreased from 7/12 at BL to 1/12 at the last FU, while the number of tests where Group 2 performed worse than Group 1 increased from 0 to 3/12. Full results with item-specific comparisons among these groups are provided in Supplementary Fig. 7. CANTAB, Cambridge Neuropsychological Test Automated Battery. b Longitudinal trajectories of Depression (Left) and ADHD symptoms (Right) among adolescents in three groups (purple for Group 1; green for Group 2; orange for Group 3). Group-specific means at each visit were plotted and * indicated significant differences relative to Group 1 adjusting for sex, handedness, stie and ICV. Baseline mental health score was also adjusted for comparison at the last follow-up. Two-tailed t-tests were conducted at baseline (14 y) and the last follow-up. BH-FDR method was used for multiple correction. Depression, Group 2 vs Group 1 at 14 y (d = −0.05, Padj = 0.256), Group 2 vs Group 1 at 23 y (d = 0.13, *Padj = 0.023), Group 3 vs Group 1 at 14 y (d = −0.01, Padj = 0.566), Group 3 vs Group 1 at 23 y (d = 0.70, **Padj = 0.001); Parent rated ADHD (dashed line), Group 2 vs Group 1 at 14 y (d = 0.04, Padj = 0.220), Group 2 vs Group 1 at 16 y (d = −0.03, Padj = 0.574), Group 3 vs Group 1 at 14 y (d = 0.34, **Padj = 0.004), Group 3 vs Group 1 at 16 y (d = 0.01, Padj = 0.954); Child rated ADHD (solid line), Group 2 vs Group 1 at 14 y (d = −0.03, Padj = 0.321), Group 2 vs Group 1 at 23 y (d = 0.02, Padj = 0.758), Group 3 vs Group 1 at 14 y (d = 0.34, Padj = *0.042), Group 3 vs Group 1 at 23 y (d = −0.10, Padj = 0.579). ADHD, attention-deficit/hyperactivity disorder. Relevant source data were provided in the Source Data file.
Fig. 3
Fig. 3. Genome-wide association study (GWAS) identified one significant locus associated with delayed neurodevelopment in Group 3.
a Correlation between Group3-reweighted GMV and neurocognition in ABCD (n = 11,101) indicated the validity of using the proxy phenotype for delayed neurodevelopment in the GWAS. One sample two-sided t test was used with FDR for multiple correction. The neurocognition measures and corresponding abbreviations are defined in the Methods and Supplementary Table 10 with exact p values. ***P < 0.001. b GWAS Manhattan plot for Group3-reweighted GMV in the ABCD population (n = 7662). Group3-reweighted GMV was calculated for each adolescent (details in Methods) and used as the proxy phenotype for delayed neurodevelopment. Multiple SNPs on chromosome 6 achieved genome-wide significant effects (two-sided t-test: P < 5 × 10−8), mapped to the intronic region of CENPW. Results from gene-based association analysis (Supplementary Fig. 11) confirmed the significant effect of CENPW on delayed neurodevelopment. Box plot in (c) showed that CENPW score of delayed neurodevelopment was higher in Group 3 (n = 60) compared to Group 1 and 2 (n = 1338) (two-sided t-test: P = 0.028). The upper and lower boundaries of each boxplot represented the first (Q1) and third (Q3) quantiles, respectively. Hence, the box body covered 50% of the central data, with the median marked by a central line. The top/bottom whiskers represented the maximum or minimum, respectively without outliers. d indicated that CENPW score of delayed neurodevelopment was negatively correlated with baseline (BL) neurocognitive performance, and became non-significant at the last follow-up (FU). Here, Worse indicated higher CGT Delay aversion score, lower CGT risk adjustment score, longer CGT Deliberation time and SST GoRT. One-sided P values were reported (one sample t test) and BH-FDR method was used for multiple correction within scales. CGT Delay aversion, BL (r = 0.09, *Padj = 0.027), FU3 (r = −0.07, Padj = 0.239); CGT Deliberation time, BL (r = 0.08, *Padj = 0.027), FU3 (r = 0.02, Padj = 0.983); CGT risk adjustment, BL (r = −0.08, *Padj = 0.027), FU3 (r = 0.02, Padj = 0.983); SST GoRT, BL (r = −0.06, *Padj = 0.038), FU3 (r = −0.02, Padj = 0.472). CGT, Cambridge Gambling Task; SST GoRT, reaction time for ‘Go’ trials in Stop Signal Task. c, d confirmed the relationship between CENPW and delayed neurodevelopment identified in (b). Relevant source data were provided in the Source Data file.
Fig. 4
Fig. 4. Epigenome-wide association study (EWAS) identified significant signals associated with lowered neurodevelopment in Group 2.
a EWAS Manhattan plot in the IMAGEN population. Group 2 (n = 463) (relative to Group 1, n = 446) status was used as the phenotype, adjusting for potential confounders. One hypermethylated site cg06064461 achieved genome-wide significant effect (one sample two-sided t-test: P < 5 × 10−8, BH-FDR corrected Padj < 0.05) and was mapped to ATF2 and MIR933 on chromosome 2. Validation of EWAS results in IMAGEN (n = 909). cg06064461 methylation was positively correlated with total GMV trajectory (b; r = 0.14, P = 6.85 × 10−6) and negatively correlated with peak gray matter volume (GMV) (c; r = −0.07, P = 0.020), adjusting for potential confounders. The error bands in (b, c) represent the pointwise 95% confidence intervals of the corresponding estimated correlations. One sample t-test was used. d Proportion of the mediation effects through cg06064461 methylation in the environmental exposure - peak GMV pathway, adjusting for potential confounders (n = 750 independent samples; the estimates and standard deviation of mediation proportion were estimated using the 1000-iteration bootstrap approach). The bar, also the central of the error bars, represents the point-wise estimated mediation proportion, while error bars indicate 95% confidence intervals of the estimated mediation proportion. Thus, the left/right whiskers represent the lower bound and upper bound of the confidence interval, respectively. Environmental factors were sorted by P values of the corresponding mediation effects. No mediation effects of cg06064461 methylation showed statistical significance (one sample two-sided t-test) after correcting for multiple testing using BH-FDR method, although uncorrected significance was observed between family affirmation and peak GMV. Childexp, child’s experience of family life; FamStress, family stressors; CTQ, Childhood Trauma Questionnaire. e Mediation model was conducted to analyse the direct and indirect effect of family affirmation on peak GMV, with cg06064461 methylation as the mediator. Results showed that cg06064461 methylation mediated the relationship between family affirmation and peak GMV with an unadjusted p value of 0.048 (one sample two-sided t-test: β = 0.005, mediation proportion = 9.26%, Punadj = 0.048, Padj = 0.191). Relevant source data were provided in the Source Data file.
Fig. 5
Fig. 5. Genetically-predicted neurodevelopment had limited impact on socio-economic, cognitive and mental health outcomes in mid-to-late adulthood.
a Correlation between polygenic score (PGS) and CENPW score of delayed neurodevelopment and total gray matter volume (GMV) for participants in UK Biobank (n = 337,199). Marginal distributions of PGS and total GMV were both normal. PGS and CENPW score both showed negative correlation with total GMV (r = −0.08, P < 2.2 × 10−16 for PGS and r = −0.09, P < 2.2 × 10−16 for CENPW score). One sample t-test was used. PGS were averaged over different P value thresholds. b Correlation between averaged PGS of delayed neurodevelopment and CENPW score and regional GMV for participants in UK Biobank. Rostral middle frontal (r = −0.07, Padj < 0.001), fusiform (r = −0.07, Padj < 0.001), lateral orbitofrontal (r = −0.07, Padj < 0.001), medial orbitofrontal (r = −0.06, Padj < 0.001) and rostral anterior cingulate (r = −0.06, Padj < 0.001) were among the ROIs with the strongest correlation with PGS, while lateral orbitofrontal (r = −0.06, Padj < 0.001), caudal middle frontal (r = −0.05, Padj < 0.001), rostral middle frontal (r = −0.05, Padj < 0.001), insula (r = −0.05, Padj < 0.001) and superior frontal (r = −0.05, Padj < 0.001) were ROIs having the strongest correlation with CENPW score. These were consistent with the results that participants with higher PGS of delayed neurodevelopment also had worse performance in spatial working memory in UK Biobank. One sample t test was used with FDR for multiple correction. c Inferiority test of the correlation between averaged PGS and socio-economic, cognitive and mental health outcomes indicated that polygenic risk of delayed neurodevelopment had limited effect on the long-term socio-economic, cognitive and mental health outcomes. Full results were displayed in Supplementary Fig. 15. Similar results were observed between CENPW score and these long-term outcomes (Supplementary Fig. 16). IMD, Indices of Multiple Deprivation; Scot, Scotland; Edu, the highest educational attainment; IQ, intelligence. Relevant source data were provided in the Source Data file.

References

    1. Giedd JN, et al. Brain development during childhood and adolescence: a longitudinal MRI study. Nat. Neurosci. 1999;2:861–863. doi: 10.1038/13158. - DOI - PubMed
    1. Lenroot RK, Giedd JN. Brain development in children and adolescents: insights from anatomical magnetic resonance imaging. Neurosci. Biobehav. Rev. 2006;30:718–729. doi: 10.1016/j.neubiorev.2006.06.001. - DOI - PubMed
    1. Tamnes CK, et al. Development of the Cerebral Cortex Across Adolescence: A Multisample Study Of Inter-related Longitudinal Changes In Cortical Volume, Surface Area, And Thickness. J. Neurosci. 2017;37:3402–3412. doi: 10.1523/JNEUROSCI.3302-16.2017. - DOI - PMC - PubMed
    1. Paus T, Keshavan M, Giedd JN. Why do many psychiatric disorders emerge during adolescence? Nat. Rev. Neurosci. 2008;9:947–957. doi: 10.1038/nrn2513. - DOI - PMC - PubMed
    1. Blakemore SJ. Adolescence and mental health. Lancet. 2019;393:2030–2031. doi: 10.1016/S0140-6736(19)31013-X. - DOI - PubMed

LinkOut - more resources