. 2024 Jul 15;15(1):5935.
doi: 10.1038/s41467-024-49692-1.

Whole genome sequencing refines stratification and therapy of patients with clear cell renal cell carcinoma

Collaborators, Affiliations

Whole genome sequencing refines stratification and therapy of patients with clear cell renal cell carcinoma

Richard Culliford et al. Nat Commun. .

Abstract

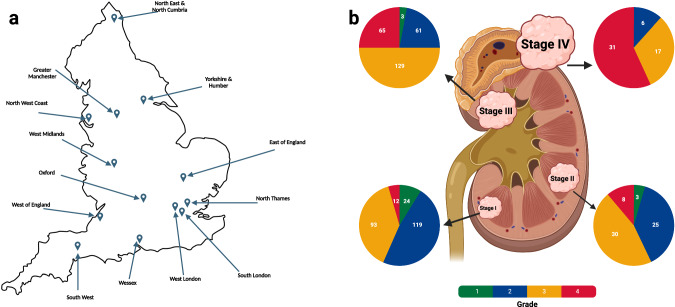
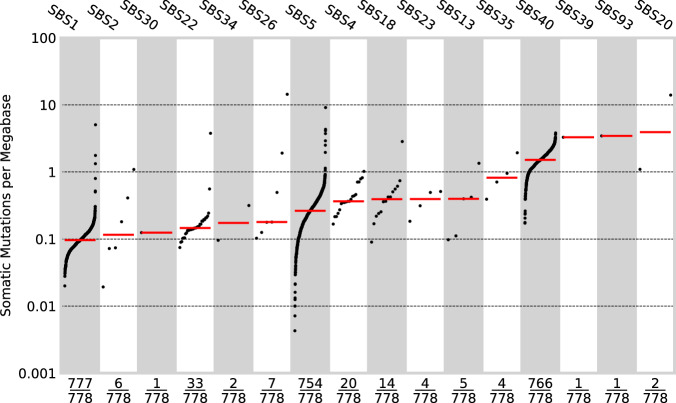
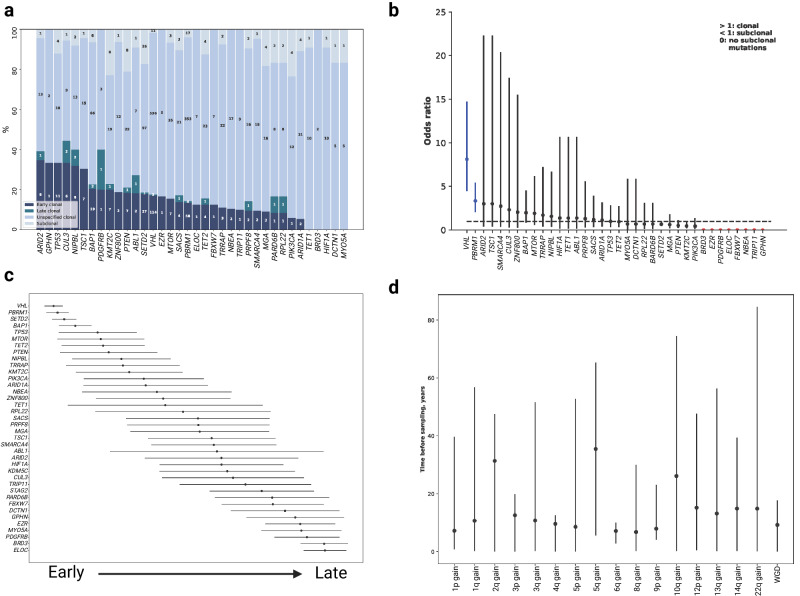
Clear cell renal cell carcinoma (ccRCC) is the most common form of kidney cancer, but a comprehensive description of its genomic landscape is lacking. We report the whole genome sequencing of 778 ccRCC patients enrolled in the 100,000 Genomes Project, providing for a detailed description of the somatic mutational landscape of ccRCC. We identify candidate driver genes, which as well as emphasising the major role of epigenetic regulation in ccRCC highlight additional biological pathways extending opportunities for therapeutic interventions. Genomic characterisation identified patients with divergent clinical outcome; higher number of structural copy number alterations associated with poorer prognosis, whereas VHL mutations were independently associated with a better prognosis. The observations that higher T-cell infiltration is associated with better overall survival and that genetically predicted immune evasion is not common supports the rationale for immunotherapy. These findings should inform personalised surveillance and treatment strategies for ccRCC patients.


Conflict of interest statement

S.T. has received speaking fees from Roche, AstraZeneca, Novartis and Ipsen. S.T. has the following patents filed: Indel mutations as a therapeutic target and predictive biomarker PCTGB2018/051892 and PCTGB2018/051893 and Clear Cell Renal Cell Carcinoma Biomarkers P113326GB. None of the other authors have a financial or non-financial conflict of interest.

Figures

Fig. 1
Fig. 1. Overview of the Gel cohort of ccRCC patients.
a The location of the 13 Genomic Medicine Centers (GMCs) across England from which patients were recruited. b The breakdown of the cohort by tumour grade and stage. Figure 1 created with BioRender.com released under a Creative Commons Attribution-NonCommercial-NoDerivs 4.0 International license.
Fig. 2
Fig. 2. Frequency of patients with nonsynonymous mutations in driver genes.
The cohort frequency of a driver gene reported as being above (blue) or below (red) 1% in other ccRCC cohorts is indicated.
Fig. 3
Fig. 3. Biological pathways in ccRCC.
a The SWI/SNF pathway. b The PI3K/AKT/MTOR signalling pathway. c The TP53 pathway. d The RAS/ERK pathway. e The VHL/HIF1A and hypoxia pathway. Driver genes identified shown in blue, non-ccRCC driver genes in green and other pathway genes in grey. Non-ccRCC driver genes are defined as those identified in any other cancer. The number in the bottom left is the nonsynonymous mutational frequency and the number in the bottom right the copy number alteration (CNA) frequency. Figure 3 created with BioRender.com released under a Creative Commons Attribution-NonCommercial-NoDerivs 4.0 International license.
Fig. 4
Fig. 4. Copy number alterations and structural variants.
a Frequency of copy number alterations across the ccRCC cohort. Copy number losses are coded in blue shades and copy number gains shown in red. The focal copy number alterations, as identified by GISTIC, are annotated along with predicted target gene. b The distribution of structural variants across the ccRCC cohort. Structural variants are classified as deletions, tandem duplications or unclassified structural variants. The black ticks on the y axis correspond to the chromosome start, centromere and end position while the orange ticks represent identified structural variant hotspot regions.
Fig. 5
Fig. 5. Mutational signatures.
The mutational burden of single base substitution signatures (n = 778), as defined in COSMIC. The x axis indicates the number of samples for which each signature was active. The y axis is the mutational burden of the given signature. SBS1, SBS5 and SBS40, present in the majority of samples, are clock-like signatures. The higher average mutational burden of SBS40 signifies that it is the predominant signature active in the majority of samples.
Fig. 6
Fig. 6. Mutational timing.
a The proportion of clonal and subclonal nonsynonymous mutations (n = 775) in driver genes. b Odds ratio (OR) with 95% confidence intervals that a mutation in a driver gene is clonal relative to mutations in the other driver genes; OR > 1.0 indicates a mutation is more likely to be clonal. The genes in blue are significantly more likely to be clonal or subclonal. Genes in red have no subclonal mutations. c The relative ordering of nonsynonymous mutations in driver genes. The error bars correspond to the 95% confidence intervals of the average finishing position in the league model. The ordering was determined based on the distributions in (a) (Supplementary Methods). d Estimates, with 95% confidence intervals, of the real time at which copy number gains occur during tumour evolution.
Fig. 7
Fig. 7. Immune landscape of ccRCC.
a Neoantigen burden and immune escape mutations. Lower bars show antigen processing genes (APG) and human leucocyte antigens (HLA) alterations present in each cancer. b Somatic mutations in each of the antigen presentation pathway genes. The number in the bottom left is the truncating mutation count and the number in the bottom right is the number of biallelic nonsynonymous mutations. APGs in purple, IFN-γ pathway genes in blue, epigenetic modifier genes in brown, CD274 comprises the PD-L1 receptor and CD58 receptor is encoded by CD58. Figure 7b created with BioRender.com released under a Creative Commons Attribution-NonCommercial-NoDerivs 4.0 International license.
Fig. 8
Fig. 8. Kaplan–Meier survival curves of overall survival (OS).
Relationship between OS and a VHL mutation status (n = 605); b PBRM1 mutation status (n = 605); c structural variant count (n = 605); (d) TCRA T-cell fraction (n = 605); e sarcomatoid (n = 167). Log-Rank P and Cox P refers to the Log Rank test and Cox Regression (two-sided z-test), respectively.

Update of

References

    1. Bukavina L, et al. Epidemiology of renal cell carcinoma: 2022 update. Eur. Urol. 2022;82:529–542. doi: 10.1016/j.eururo.2022.08.019. - DOI - PubMed
    1. Post nephrectomy management of localized renal cell carcinoma. From risk stratification to therapeutic evidence in an evolving clinical scenario. Cancer Treat. Rev. 2023;115:102528. doi: 10.1016/j.ctrv.2023.102528. - DOI - PubMed
    1. Choueiri TK, et al. Adjuvant pembrolizumab after nephrectomy in renal-cell carcinoma. N. Engl. J. Med. 2021;385:683–694. doi: 10.1056/NEJMoa2106391. - DOI - PubMed
    1. Pal SK, et al. Adjuvant atezolizumab versus placebo for patients with renal cell carcinoma at increased risk of recurrence following resection (IMmotion010): a multicentre, randomised, double-blind, phase 3 trial. Lancet. 2022;400:1103–1116. doi: 10.1016/S0140-6736(22)01658-0. - DOI - PubMed
    1. Motzer RJ, et al. Adjuvant nivolumab plus ipilimumab versus placebo for localised renal cell carcinoma after nephrectomy (CheckMate 914): a double-blind, randomised, phase 3 trial. Lancet. 2023;401:821–832. doi: 10.1016/S0140-6736(22)02574-0. - DOI - PMC - PubMed

Substances