. 2024 Jul 15;15(1):5929.
doi: 10.1038/s41467-024-50224-0.

Efficient and reproducible generation of human iPSC-derived cardiomyocytes and cardiac organoids in stirred suspension systems

Affiliations

Efficient and reproducible generation of human iPSC-derived cardiomyocytes and cardiac organoids in stirred suspension systems

Maksymilian Prondzynski et al. Nat Commun. .

Abstract

Human iPSC-derived cardiomyocytes (hiPSC-CMs) have proven invaluable for cardiac disease modeling and regeneration. Challenges with quality, inter-batch consistency, cryopreservation and scale remain, reducing experimental reproducibility and clinical translation. Here, we report a robust stirred suspension cardiac differentiation protocol, and we perform extensive morphological and functional characterization of the resulting bioreactor-differentiated iPSC-CMs (bCMs). Across multiple different iPSC lines, the protocol produces 1.2E6/mL bCMs with ~94% purity. bCMs have high viability after cryo-recovery (>90%) and predominantly ventricular identity. Compared to standard monolayer-differentiated CMs, bCMs are more reproducible across batches and have more mature functional properties. The protocol also works with magnetically stirred spinner flasks, which are more economical and scalable than bioreactors. Minor protocol modifications generate cardiac organoids fully in suspension culture. These reproducible, scalable, and resource-efficient approaches to generate iPSC-CMs and organoids will expand their applications, and our benchmark data will enable comparison to cells produced by other cardiac differentiation protocols.


Conflict of interest statement

The authors declare no competing interests.

Figures

Fig. 1
Fig. 1. Optimized stirred bioreactor cardiac differentiation protocol.
a Schematic of the optimized bioreactor cardiac differentiation protocol. b, c Characteristics of successful bioreactor differentiations. Runs were categorized as failed when they yielded <90% TNNT2+ hiPSC-CMs. Runs were categorized as failed when they yielded <90% TNNT2+ hiPSC-CMs. Cultures with low frequency of SSEA4 by flow cytometry (b; n = 31 differentiations) or out of range mean EB diameter (c; n = 24 differentiations) had higher failure likelihood. d, e hiPSC-CM yield (d) and purity (e) at dd15 (bioreactor, n = 25 differentiations; monolayer, n = 8 differentiations). Percentage of cells positive for cardiomyocyte marker TNNT2 was measured by flow cytometry. f Spontaneous beating frequency of bCMs and mCMs at dd15 (n=number of differentiations; number of EBs or wells: bCM (n = 3; 71); mCM (n = 3; 46). g Timeline of bioreactor and monolayer cardiac differentiation monitored using TNNI1-GFP hiPSCs (bar: 200 µm). hp. RT-qPCR analysis of marker gene expression during bioreactor and monolayer cardiac differentiation. Marker genes were: ACTN2, cardiomyocytes; VIM, non-cardiomyocytes; MYH7, MYL2 and MYL3, ventricular cardiomyocytes; MYL4 and MYL7, atrial cardiomyocytes; HCN4, developmentally repressed pacemaker channel. Expression is relative to dd5 bCM (h; n=number of differentiations: bCMs, n = 3; mCMs, n = 3) or dd15 bCM (ip: bCMs, n = 3–4; mCMs, n = 3). Data are expressed as mean ± SEM. Points represent biological replicates for each independent differentiation, except for i‘-i“ in which points represent technical replicates from separate batches. df, h, i, jp: two-tailed Welch’s unpaired t test. i‘-i“: one-way ANOVA with Tukey´s post-test. MCB, Master cell bank; hiPSC, human induced pluripotent stem cells; CM, cardiomyocyte; BF, bright field.
Fig. 2
Fig. 2. scRNAseq reveals higher cardiomyocyte content and degree of cellular specification in bCMs.
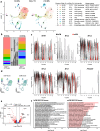
a scRNA-seq UMAP clustering of mCM and bCM cultures showing 11 clusters, marker genes, assigned cell types, and distribution in bCM and mCM cultures. b Stacked bar graph showing cellular composition of mCM (right) and bCM (left) cultures. Clusters are divided into cardiomyocytes (top) and non-cardiomyocytes (bottom). Color coding is the same as in a. c Violin-plots showing the relative expression of a subset of cardiac and non-cardiac marker genes (y-axis) across all clusters for bCMs (grey) and mCMs (red). d Composite ventricular and atrial cardiomyocyte (vCM, aCM) scores derived from multiple marker genes. Clusters 0 and 1 and greater vCM score, and cluster 2 had greater aCM score. e Differentially expressed genes (DEGs) between cardiomyocytes in bCM and mCM cultures. Significances were calculated using Wilcoxon rank-sum test (implemented by the Seurat findmarkers function), with p values adjusted using the Benjamini-Hochberg procedure (for DEGs, FDR < 0.05). f Top biological process gene ontology (GO) terms for DEGs more highly expressed in bCMs (left) or mCMs (right).
Fig. 3
Fig. 3. Comparison of bCMs and mCMs on 2D platforms.
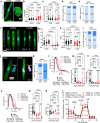
ae Morphological characteristics of unpatterned hiPSC-CMs. Cryo-recovered bCMs and mCMs were cultured for 7 days on unpatterned Geltrex-coated dishes and then stained for sarcomere Z-line marker ACTN2. a Representative images illustrate elongated shape of bCMs compared to mCMs. Bar, 20 µm. b, c Circularity and cell area were quantified from 3 independent differentiation batches of bCMs and mCMs. Grey numbers indicate cells analyzed. Two-way ANOVA with Tukey’s post-test. d Nucleation of unpatterned bCMs and mCMs after 7 days in culture. Chi-squared p < 0.0001. e Unpatterned bCMs and mCMs stained for H2AFX, a marker of DNA damage response. Chi-squared p < 0.0001. fk Cryo-recovered cells were plated on extracellular matrix rectangular islands. After 1, 3, and 7 days, samples were fixed and stained. f Representative images. Bar, 20 µm. g Quantification of single cell islands covered by bCMs or mCMs. Grey numbers indicate 10x fields analyzed. One-way ANOVA with Šidák´s post-test. h Sarcomere organization of micropatterned bCMs and mCMs measured using sarcomere packing density after 7 days on micropatterned substrates. Grey numbers indicate cells analyzed. Two-way ANOVA with Šidák´s post-test. i Nucleation of micropatterned bCMs and mCMs after 7 days in culture. Chi-squared p < 0.0001. j, k DNA damage response in micropatterned bCMs and mCMs. j Representative images. Bar, 20 µm. k Quantification of H2AFX staining in bCMs (n = 30) and mCMs (n = 41). Chi-squared p < 0.0001. ln Ca2+ transients were recorded under 1 Hz electrical pacing 7 days after plating. l Average, normalized Ca2+ transients. m Maximum upstroke velocity. n Ca2+ transient amplitude. Kruskal–Wallis with Dunn’s multiple comparison test. o Average, normalized action potentials. p Maximum upstroke velocity. q action potential duration at 90% recovery (APD90). Kruskal–Wallis with Dunn’s multiple comparison test. r Mitochondrial stress test. Cells were cultured in 96 well dishes designed to measure oxygen consumption rate (OCR). Arrows indicate addition of oligomycin, carbonyl cyanide-4 (trifluoromethoxy) phenylhydrazone (FCCP), and antimycin/rotenone (AR). Sample sizes indicate number of differentiations/number of cells (b, c, g, h) or replicates (lr). Data are expressed as mean ± SEM. Source data are provided as a Source Data file.
Fig. 4
Fig. 4. Analysis of bCM and mCM function in 3D engineered heart tissues (EHTs).
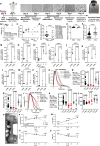
a Representative images of EHTs after 29 days in culture (Scale bar, 1 mm). be Spontaneously beating EHTs assembled from cryo-recovered bCMs or mCMs were recorded in culture medium at 37 °C 5 to 32 days after EHT fabrication. b Spontaneous beating frequency. c EHT force. d Time to 50% contraction (C50). e Time to 90% relaxation (R90). Two-way ANOVA with Šidák´s post-test at each timepoint. fh Analysis of EHTs in Tyrode solution without pacing (0 Hz) or with 1–3 Hz pacing. f EHT beat frequency in response to pacing. Only EHTs captured by pacing are shown. The percent of EHTs captured at each pacing rate is indicated. Two-way ANOVA with Šidák´s post-test. g Paced EHT force. h Paced EHT R90. i Histological characterization of bCM and mCM EHTs. After 34 days, EHT cryosections were stained for sarcomere Z-line protein ACTN2 and cardiac troponin T (TNNT2). Representative cryosections showed higher cellularity and greater sarcomere content and organization in bCM EHTs. j Sarcomere length. Quantification from 66 (bCM) or 59 (mCM) regions of interest in 4 (bCM) or 5 (mCM) EHTs from two independent differentiations. EHTs fixed at days 32, 34, and 39 were investigated and pooled for this analysis. Number of sarcomere intervals measured are indicated in the graph. Two-tailed Welch’s unpaired t-test. Data are expressed as mean ± SEM. Source data are provided as a Source Data file.
Fig. 5
Fig. 5. Optimized cardiac differentiation protocol in spinner flasks.
a Schematic of the optimized protocol applied to magnetically stirred spinner flasks. Abbreviations as in Fig. 1. b, c hiPSC-CMs with low frequency of pluripotency marker SSEA4 by flow cytometry (b) or out of range mean EB diameter (c) had higher likelihood of failure, defined as <90% TNNT2+ cells (n = 8 differentiations). d, e hiPSC-CM yield (d) and purity (e) at bCM or sCM dd15 (bioreactor, n = 25 differentiations; sCMs, n = 6 differentiations). 2.5× and 3.8× scaling indicate 250 or 380 ml cultures, respectively. TNNT2+ cell percentage was measured by flow cytometry. f Spontaneous beating frequency of bCMs and sCMs at day 15 (n = number of differentiations; number of EBs: bCMs (n = 3/71); sCMs (n = 3/57). gn RT-qPCR analysis of marker gene expression during bioreactor and spinner flask cardiac differentiation. Values are expressed as fold-change compared to bCMs day 5 or 15. n=number of differentiations: sCMs (n = 3). Points represent biological replicates for each independent differentiation, except for h‘ in which points represent technical replicates. oq sCM Ca2+ transients properties under 1 Hz electrical pacing 7 days after cryo-recovery. o Average, normalized Ca2+ transients. p Maximum upstroke velocity. q Ca2+ transient amplitude. Kruskal–Wallis with Dunn’s multiple comparison test. n=number of differentiations/ number of wells for sCMs: cryo: n = 2/58; fresh: n = 3/40). rt sCM action potential (AP) properties, optically recorded under 1 Hz electrical pacing 7 days after cryo-recovery. r Average, normalized APs. s Maximum upstroke velocity. t AP duration at 90% recovery (APD90). Kruskal–Wallis with Dunn’s multiple comparison test. u Representative image of an sCM EHT. Bar, 1 mm. Spontaneously beating EHTs were serially analyzed in culture medium. v Spontaneous beating frequency. w Force generated by EHTs. x Time for EHT 50% contraction (C50). y Time for EHT 90% relaxation (R90). Data are expressed as mean ± SEM. df two-tailed Welch’s unpaired t test. gn one-way ANOVA with Dunnett’s post-test. bCM and mCM data from by were replotted from Figs. 1b–f, h, i, k–p, 3l–q and 4b–e to facilitate comparisons. Source data are provided as a Source Data file.
Fig. 6
Fig. 6. Generation of bioreactor-derived cardiac organoids (bCOs).
a Representative image of a bCO at dd15. b EB diameter of dd15 bCMs (40 EBs from three differentiations) and bCOs (31 bCOs from two differentiations). Two-tailed Welch’s unpaired t test. c Spontaneous beating frequency of dd15 bCOs (36 bCOs from three differentiations). d Expression of cardiac marker gene ACTN2 in dd15 mCMs, bCMs, and bCOs. ACTN2 transcript level was measured by RT-qPCR. One-way ANOVA with Sidak’s post-test. Points represent biological replicates for each independent differentiation. e Hematoxylin and eosin staining of a bCO section dd15. Boxed area is enlarged in . Scale bar in e and  = 200 µm. f bCO section stained with TNNT2 antibody, wheat germ agglutinin (WGA), and nuclei (Hoechst). Scale bar = 200 μm. g, h Cellular composition of dd15 bCOs determined by scRNAseq followed by UMAP clustering (g). Stacked bar graph (h) of the percentage of each cell state in bCOs. Cell states were grouped into cardiomyocytes (top) and non-CMs (bottom). Data are shown as mean ± SEM. Non-CMs, non-cardiomyocytes. Source data are provided as a Source Data file.

Update of

References

    1. Hamad S, et al. Generation of human induced pluripotent stem cell-derived cardiomyocytes in 2D monolayer and scalable 3D suspension bioreactor cultures with reduced batch-to-batch variations. Theranostics. 2019;9:7222–7238. doi: 10.7150/thno.32058. - DOI - PMC - PubMed
    1. Lian X, et al. Directed cardiomyocyte differentiation from human pluripotent stem cells by modulating Wnt/β-catenin signaling under fully defined conditions. Nat. Protoc. 2013;8:162–175. doi: 10.1038/nprot.2012.150. - DOI - PMC - PubMed
    1. Chen VC, et al. Development of a scalable suspension culture for cardiac differentiation from human pluripotent stem cells. Stem Cell Res. 2015;15:365–375. doi: 10.1016/j.scr.2015.08.002. - DOI - PMC - PubMed
    1. Kempf H, Kropp C, Olmer R, Martin U, Zweigerdt R. Cardiac differentiation of human pluripotent stem cells in scalable suspension culture. Nat. Protoc. 2015;10:1345–1361. doi: 10.1038/nprot.2015.089. - DOI - PubMed
    1. Breckwoldt K, et al. Differentiation of cardiomyocytes and generation of human engineered heart tissue. Nat. Protoc. 2017;12:1177–1197. doi: 10.1038/nprot.2017.033. - DOI - PubMed