. 2024 Sep;26(9):1470-1481.
doi: 10.1038/s41556-024-01464-1. Epub 2024 Jul 15.

Zeb1 mediates EMT/plasticity-associated ferroptosis sensitivity in cancer cells by regulating lipogenic enzyme expression and phospholipid composition

Affiliations

Zeb1 mediates EMT/plasticity-associated ferroptosis sensitivity in cancer cells by regulating lipogenic enzyme expression and phospholipid composition

Annemarie Schwab et al. Nat Cell Biol. 2024 Sep.

Abstract

Therapy resistance and metastasis, the most fatal steps in cancer, are often triggered by a (partial) activation of the epithelial-mesenchymal transition (EMT) programme. A mesenchymal phenotype predisposes to ferroptosis, a cell death pathway exerted by an iron and oxygen-radical-mediated peroxidation of phospholipids containing polyunsaturated fatty acids. We here show that various forms of EMT activation, including TGFβ stimulation and acquired therapy resistance, increase ferroptosis susceptibility in cancer cells, which depends on the EMT transcription factor Zeb1. We demonstrate that Zeb1 increases the ratio of phospholipids containing pro-ferroptotic polyunsaturated fatty acids over cyto-protective monounsaturated fatty acids by modulating the differential expression of the underlying crucial enzymes stearoyl-Co-A desaturase 1 (SCD), fatty acid synthase (FASN), fatty acid desaturase 2 (FADS2), elongation of very long-chain fatty acid 5 (ELOVL5) and long-chain acyl-CoA synthetase 4 (ACSL4). Pharmacological inhibition of selected lipogenic enzymes (SCD and FADS2) allows the manipulation of ferroptosis sensitivity preferentially in high-Zeb1-expressing cancer cells. Our data are of potential translational relevance and suggest a combination of ferroptosis activators and SCD inhibitors for the treatment of aggressive cancers expressing high Zeb1.


Conflict of interest statement

The authors declare no competing interests.

Figures
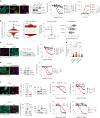
Fig. 1
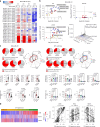
Fig. 1. Zeb1 is important for increased ferroptosis sensitivity of mesenchymal cancer cells.
a, Representative immunofluorescence and immunoblots of KPC cells, classified according to an epithelial (KPCe), mixed (KPCmix) or mesenchymal (KPCm) phenotype. Relative viability and death rate treated with ML210 (46 h) ± 1 µM ferrostatin-1 (Fer-1). Data are mean ± s.e.m. from n = 3 independent experiments, two-way analysis of variance (ANOVA) (with multiple comparisons). Scale bar, 50 µm. b, High expression of Zeb1 correlates with sensitivity to ferroptosis inducers, and inversely to the EGFR inhibitor erlotinib. ML210 sensitivity correlates with high Zeb1 and low FSP1 expression. Plotted values are z-scored Pearson’s correlation coefficients; line, median; box, 25th to 75th percentile; whiskers, 2.5th and 97.5th percentile expansion, available from the CTRP database (https://portals.broadinstitute.org/ctrp.v2.1/). CRISPR–Cas9 essentiality screens (CERES) identify Zeb1 as an important gene in MDA-MB-231 cells (marked in red), which is among the most sensitive towards ferroptosis inducers. Plotted data were mined from Dependency Map (https://depmap.org/portal). c, Left, representative immunofluorescence and immunoblots of MDA-MB-231 shCtrl and shZeb1 cells. Right, relative viability after ML210 ± 1 µM Fer-1 treatment (72 h). Data are mean ± s.e.m. from n = 6 independent experiments (n = 4 for Fer-1 treatments), two-way ANOVA (with multiple comparisons). Scale bar, 50 µm. d, Relative tumour growth of MDA-MB-231 shCtrl and shZeb1 in zebrafish larvae, ±Fer-1 pretreatment. Data are mean ± s.e.m. from n = 39 shCtrl, n = 33 shCtrl + Fer-1, n = 36 shZeb1 ± Fer-1, ordinary one-way-ANOVA. e, Representative immunofluorescence and immunoblots in control or TGFβ-treated KPCmix cells. Relative viability after ML210 ± Fer-1 treatment (72 h). Data are mean ± s.e.m. from n = 3 independent experiments, two-way-ANOVA, scale bar, 50 µm. f, Representative immunofluorescence and immunoblots of H358 lung and BxPC3 pancreatic cancer cells, before (WT) and after resistance selection against the EGFR inhibitor erlotinib (Tarceva, TR) or the chemotherapeutic agent gemcitabine (Gemzar, GR). Relative cell viability measured 72 h after indicated treatments. Data are mean ± s.e.m. from n = 3 (H358) and n = 4 (BxPC3) independent experiments; two-way- ANOVA. Scale bar, 50 µm. Source data
Fig. 2
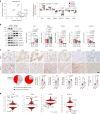
Fig. 2. Zeb1 sensitizes to phospholipid peroxidation and upregulates PUFAs.
Profiling of phospholipids and oxidized phospholipids in MDA-MB-231 cells after the indicated treatment and in various KPC cell lines. a, Time-dependent induction of the formation of oxidized phosphatidylcholine (PC) and phosphatidylethanolamine (PE) species by the GPX4 inhibitor RSL3 in MDA-MB-231 cells (wild type, WT). The colour scheme represents the mean percentage change against vehicle (Veh) from n = 3 independent experiments. b, Volcano plots show the changes in the amount of RSL3-induced oxidized phosphatidylinositol (PI), PE and PC species. Fold changes were calculated from the absolute intensities of species derived from cells treated with RSL3 (1 µM, 2 h) against Veh. n = 3 independent experiments, multiple two-tailed unpaired t-test with 5% false discovery rate. Exemplary extracted UPLC–MS/MS chromatogram for oxidized PE(18:0_20:4 + 3[O]) species from WT, shCtrl and shZeb1 upon 2 h treatment with Veh or RSL3 (1 µM). cps, counts per second. c, Effect of Zeb1 depletion (shZeb1) on the fatty acid distribution of analysed phospholipid species in MDA-MB-231 cells (left) and in KPC cell lines with different phenotypes (right). Pie charts indicate the relative abundance (% of total PE) of SFA/MUFA- and PUFA-containing PE or PI species (SFA). Bar charts show the relative abundance of exemplary PE species as well as the PUFA:MUFA ratio in phospholipids. Radar plots show the proportion of PUFA versus MUFA and SFA in PE, PC or PI. Data are given as mean (pie charts and radar plots) or mean ± s.e.m. (bar charts) from n = 6–13 (n = 6 for WT; n = 13 for shCtrl and shZeb1; n = 6 for KPCm, KPCmix and KPCe; n = 9 for KPCz) independent experiments; two-tailed unpaired Student’s t-test or ordinary one-way ANOVA. d, Heat map and scatter-plots showing the expression after a gene set variation analysis (GSVA) of Zeb1 as well as PUFA and MUFA-related gene signatures along the epithelial to mesenchymal (E–M) spectrum of 500 human metastatic cancers. Source data
Fig. 3
Fig. 3. Zeb1 regulates the expression of enzymes crucial for adjusting the PUFA:MUFA ratio in phospholipids.
a, Volcano plot showing mRNA expression changes of indicated factors in MDA-MB-231 (shZeb1 versus shCtrl) cells deduced from transcriptome analysis (left). Fold changes were calculated as shZeb1 versus shCtrl, adjusted P values were determined by multiple unpaired t-tests with 5% false discovery rate. Changes in mRNA expression are plotted as mean ± s.e.m. from n = 3 independent experiments; multiple unpaired t-test after grouping of independent clones. b, Immunoblots and quantification of lipogenic enzymes in MDA-MB-231 shCtrl and shZeb1 cells. Proteins were normalized to their respective GAPDH from the same blot, followed by normalization to MDA-MB-231 shCtrl clone no. 1, Bar charts are plotted as mean ± s.e.m. from n = 5 (except ELOVL5 n = 4), ordinary one-way ANOVA. c, Representative immunohistochemistry images showing the expression of Zeb1, the indicated lipogenic enzymes, 4-HNE as marker for lipid oxidation as well as fatty acid distribution of analysed phospholipid species in grafted KPC tumours with indicated phenotypes (KPCe, differentiated; KPCm, undifferentiated/mesenchymal) from n = 3 tumours each. Arrows indicate tumour cells, arrowheads indicate fibroblasts, specific staining is shown in brown. Scale bar, 100 µm. PE profile in KPC tumour allografts. Pie charts indicate the relative abundance (% of total PE) of SFA/MUFA- and PUFA-containing PE species. Bar charts show the relative abundance of exemplary PE species as well as the PUFA:MUFA ratio in PE. Data are given as mean or mean ± s.e.m. from n = 3 tumours; two-tailed unpaired Student’s t-test. d, High expression of the indicated lipogenic enzymes in cancer cell lines shows reciprocal correlation between sensitivity to EGFR inhibitor erlotinib and various ferroptosis-inducing compounds. Plotted values are z scored Pearson’s correlation coefficients between enzyme expression and drug resistance as the area under the curve of 481 compounds in 860 cancer cell lines, available from the CTRP database (https://portals.broadinstitute.org/ctrp.v2.1/). Line, median; box, 25th to 75th percentile; whiskers, 2.5th and 97.5th percentile expansion.
Fig. 4
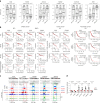
Fig. 4. Zeb1 regulates the transcription of enzymes crucial for adjusting the PUFA/MUFA ratio in phospholipids.
a, Box plots showing the expression of indicated factors after GSVA along the E–M spectrum of 500 human metastatic cancers. b, Kaplan–Meier plots (log-rank test) from survival analyses of human breast, colon and pancreatic cancers showing relapse-free survival (RFS), distant-metastasis-free survival (DMFS) and overall survival (OS) based on the expression of SCD or FADS2. Patients were not selected (all) or selected according to histological tumour grade or molecular subgroup. n = numbers with high (black) or low (red) expression (HR, hazard ratio). c, Peaks at the genomic loci of the indicated lipogenic enzymes derived from ATAC-seq and ChIP–seq for the active histone mark H3K27ac (comparing MDA-MB-231 shCtrl and shZeb1), as well as ChIP–seq for Zeb1, YAP and JUN (only in MDA-MB-231 WT). Note that Zeb1 binding peaks are detected in all loci, but ATAC-seq peaks and H3K27ac-seq peaks, indicating open chromatin and transcriptionally active regions, behave differently for repressed genes (SCD and FASN, red box) and activated genes (FADS2, ELOVL5 and ACSL4, green box). Boxes and base pair (bp) numbers indicate sizes and regions cloned in luciferase reporter constructs used in b. d, Luciferase reporter assays for the indicated regulatory elements of the SCD, FASN, FADS2, ELOVL5 and ACSL4 genes. Zeb1 expression was manipulated by overexpression in MCF7 (low endogenous expression). Reporter constructs of known Zeb1 target genes (ANKRD1 activated and LLGL2 repressed by Zeb1) were used as controls. Data are calculated as relative ratio to empty vector (Ctrl) and given as mean ± s.e.m. from n = 4 independent experiments (except for SCD n = 6 and LLGL2 n = 3), two-tailed unpaired Student’s t-test.
Fig. 5
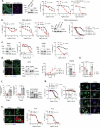
Fig. 5. Inhibition of crucial enzymes adjusting the PUFA:MUFA ratio affects ferroptosis sensitivity in a Zeb1-dependent manner.
a, Relative viability and death rate in MDA-MB-231 cells pretreated with the SCD inhibitors MF438 or CAY10566 (both 5 µM, 24 h) before ML210 treatment (72 h). Death rate was measured using 0.6 µM n = 3 independent experiments; ordinary two-way ANOVA. b, Proportion of SFAs, MUFAs and PUFAs in PE or PI, the proportion of PUFAs in PE and the relative abundance of PI(18:1/18:1) in MDA-MB-231 (shCtrl and shZeb1) cells treated with vehicle (Veh) or CAY10566 (3 µM) for 48 h. n = 5 (shCtrl) and n = 4 (shZeb1) from independent experiments; two-tailed paired Student’s t-test or ordinary two-way ANOVA. Exemplary extracted UPLC–MS/MS chromatogram for oxidized PE(18:0_20:4 + 3[O]) species in MDA-MB-231 (shCtrl) cells that were pretreated with Veh or CAY10566 (3 µM, 48 h), followed by Veh or RSL3 (1 µM, 2 h) for 2 h. cps, counts per second. c, Relative cell viability and cell death rate in MDA-MB-231 cells pretreated with Veh (dimethylsulfoxide (DMSO)/ethanol), 500 µM oleic acid and/or 5 µM MF438, followed by ML210 for 72 h. Cell death was monitored using 0.4 µM ML210 n = 3 independent experiments, ordinary two-way ANOVA. d, Relative cell viability in MDA-MB-231 (shCtrl and shZeb1) cells pretreated with MF438 (5 µM) for 24 h, followed by 72 h ML210 n = 3 independent experiments, ordinary two-way ANOVA. e, Growth of fluorescently labelled MDA-MB-231 wild-type (WT) or shZeb1 cells, pretreated with 5 µM MF438 or DMSO as control, in precision-cut tissue slices of mouse lungs. Co-cultures were treated with 0.5 µM ML210 ± 1 µM Fer-1 and surviving tumour cells were quantified 4 days later. n = 4 (WT) and n = 3 (shZeb1); one-way ANOVA. f, Relative cell viability and cell death rate in MDA-MB-231 (shCtrl and shZeb1) cells pretreated with 10 µM of 20:4 (arachidonic acid, AA) for 24 h, followed by 40 h ML210 treatment. Death rate was monitored using 1 µM ML210. n = 3 independent experiments; ordinary two-way ANOVA. g, Number and occupied area of lung metastases in mice analysed 3 weeks after intravenous injection of KPCmix cells pretreated for 12 h with 10 µM AA, 500 µM oleic acid or ethanol as control. n = 27 (9 mice per treatment, from n = 3 independent experiments); Kruskal–Wallis test with multiple comparisons. h, Relative cell viability and cell death rate in MDA-MB-231 cells pretreated with the FADS2 inhibitor sc-26196 (10 µM) for 24 h, followed by 72 h ML210 treatment. Death rate was measured using 0.37 µM ML210, n = 3 independent experiments; ordinary two-way ANOVA. i, Relative cell death rate in MDA-MB-231 cells pretreated with vehicle (Ctrl), 10 µM AA and/or 10 µM sc-26196 for 24 h before adding ML210 (3 µM) monitored for 20 h. n = 3 independent experiments; ordinary two-way ANOVA. j, Cell viability of MDA-MB-231 (shCtrl and shZeb1) cells treated with increasing doses of ML210 after pretreatment with the FADS2 inhibitor sc-26196 (10 µM) for 24 h. n = 3 independent experiments; ordinary two-way ANOVA. Data are mean ± s.e.m.
Fig. 6
Fig. 6. SCD inhibitors sensitize to ferroptosis in translationally relevant settings.
a,b, Reciprocal effect of SCD1 inhibition and FADS2 inhibition on TGFβ-induced ferroptosis sensitivity in A549 and H358 lung carcinoma cells. Relative cell viability of A549 (a) and H358 (b) cells that were stimulated with 5 ng ml−1 TGFβ for 4 and 9 days, respectively, then pretreated with 5 µM MF438 (left) or 10 µM sc-26196 (right) for 24 h, and exposed to the indicated concentrations of ML210 for 48 h (H358) or 72 h (A549). Data are presented as mean ± s.e.m. from n = 3 independent experiments; ordinary two-way ANOVA. c, Relative cell viability of control and erlotinib-resistant (TR) H358 cells treated with 5 µM MF438 (left) or 10 µM sc-26196 (right) for 24 h, followed by ML210 treatment for 72 h. Data are mean ± s.e.m. from n = 3 independent experiments; ordinary two-way ANOVA. NS, not significant.
Extended Data Fig. 1
Extended Data Fig. 1. Zeb1 is important for increased ferroptosis sensitivity of mesenchymal cancer cells.
a) Representative immunofluorescence and immunoblots for MCF7 and MDA-MB-231 breast cancer cells. Viability of MCF7 and MDA-MB-231 cells treated for 48 h with different ferroptosis inducers (FINs). n = 3 independent experiments, ordinary two-way ANOVA. b) Viability of MDA-MB-231 (shCtrl and shZeb1) cells treated for 48 h with indicated FINs. n = 3 (ML210), n = 5 (RSL3, shCtrl), n = 6 (RSL3, shZeb1; Erastin). Representative immunoblot in 143B osteosarcoma cells (shCtrl and shZeb1). Relative viability after ML210 treatment (72 h) ± Fer-1, from n = 6 independent experiments (n = 3 for Fer-1 treatments), ordinary two-way ANOVA. c) Representative immunoblots and ML210 viability assays (72 h) in control- or TGFβ-treated A549 and H358 cells, for 4 and 9 days respectively. n = 3 independent experiments, ordinary two-way ANOVA. d) Representative immunofluorescence and immunoblots in control or Zeb1ko KPCe cells. Cell death for syngeneic KPCe clones (sgCtrl and sgZeb1) after ML210 treatment (3 µM), n = 3 independent experiments, ordinary two-way ANOVA. TGFβ-induced ferroptosis sensitization (relative change of IC50 for ML210) in control or Zeb1ko KPCmix cells. n = 3 independent experiments, two-tailed unpaired student t-test (bar graph). e) Viability assay of shCtrl or shZeb1 MDA-MB-231 cells after treatment with either the chemotherapeutic agent etoposide (10 µM, n = 4) or ML210 (5 µM, n = 6) for 48 h, independent experiments, ordinary two-way ANOVA. f) mRNA and protein expression of EMT-TFs in the indicated MDA-MB-231 clones. n = 4 for Snail, n = 3 for Twist, ordinary one-way ANOVA. g) Representative immunofluorescence in control KPCe cells or after CRISPR-mediated knockout of indicated EMT-TFs treated with TGFβ (5 ng/ml, 5 days). Relative viability measured after 72 h ML210 treatment ± Fer-1. n = 3 independent experiments, ordinary two-way ANOVA. h) Representative immunofluorescence cells derived from tumours with a conditional knockout for Zeb1 (KPCZ) or Snail (KPCS) ± TGFβ (5 ng/ml, 5 days). Relative viability 72 h after ML210 treatment (72 h). n = 3 independent experiments, ordinary two-way ANOVA. All data are presented as mean ± SEM, scale bar of all presented fluorescence images is 50 µM.
Extended Data Fig. 2
Extended Data Fig. 2. Zeb1 and enhances phospholipid peroxidation and modulates lipid metabolism.
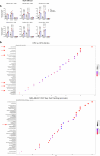
a) Zeb1 is critical for RSL3-induced phospholipid peroxidation in MDA-MB-231 cells. Exemplary oxidized PE or PI(18:0_20:4) (PE, phosphatidylethanolamines; PI: phosphatidylinositol) species in MDA-MB-231 cells (WT, shCtrl, shZeb1) treated with RSL3 at the indicated concentrations for 2 h. n = 3 independent experiments, ordinary two-way ANOVA. b) Zeb1 induces massive metabolic reprogramming. GO term analysis (top 30 list) representing transcriptional changes (upper panel) and Zeb1 promoter binding (determined by Zeb1 ChIP-seq, lower panel) in control vs. Zeb1ko KPCe cells. Arrows mark GO terms related to fatty acid metabolism.
Extended Data Fig. 3
Extended Data Fig. 3. Zeb1 upregulates phospholipid PUFA ratios.
a) Zeb1 shapes the phospholipid profile in MDA-MB-231 cells. Relative abundance of individual PE or PI phospholipids (% of total PE or PI) in MDA-MB-231 (WT, shCtrl or shZeb1) cells. The colour scheme shows the percentage change of relative intensities in shCtrl and shZeb1 compared to WT. Numbers indicate the mean proportions relative to the sum of all PE or PI species analysed (100%). Individual data for n = 6 (WT) or n = 13 (shCtrl, shZeb1) independent experiments are shown. b) Total PE and PI content in MDA-MB-231 (shCtrl and shZeb1) cells. Data are presented as mean ± SEM from n = 4 individual experiments, two-tailed unpaired student t-test. c) Fatty acid distribution of PE species in H358 lung cancer cells and BxPC3 pancreatic cancer cells (WT) cells selected for resistance against the EGFR inhibitor erlotinib/Tarceva (TR) or the chemotherapeutic gemcitabine (GR). Pie charts indicate the relative abundance (% of total PE) of SFA and/or MUFA- vs. PUFA-containing PE species. Bar charts show the relative abundance of exemplary PE species as well as the PUFA/MUFA ratio in PE. The heat maps show the percentage change in the relative abundances of either PE species or the proportion of individual fatty acids in PE. Data are given as mean (pie charts), mean ± SEM (bar charts) or individual values (heat maps), from n = 3 independent experiments, two-tailed unpaired student t-test. d) Bar charts showing the relative abundance of PUFA-containing PE species and the PUFA/MUFA ratio PE species in the indicated KPCe CRISPR-knockout cells with or without TGFβ treatment for 5 days and are given as mean ± SEM from n = 3 independent experiments, repeated measures, two-way ANOVA.
Extended Data Fig. 4
Extended Data Fig. 4. Zeb1 regulates the expression of lipogenic enzymes crucial for adjusting the PUFA/MUFA ratio.
a) Simplified scheme of fatty acid biosynthesis pathways including relevant lipogenic enzymes. Note that most PUFAs, including those considered most relevant for the execution of ferroptosis (in bold) are not generated de novo, but are derived from essential fatty acids (C18:3 (ω-3) / linolenic acid and C18:2 (ω-6) / linoleic acid) taken up by the cell. b) Correlation of lipogenic enzymes with Zeb1 expression in 732 solid cancer cell lines from the CCLE database using cBioPortal (http://www.cbioportal.org/; https://sites.broadinstitute.org/ccle/). Shown are Spearman and Pearson correlations, derived from two-tailed t-test. c) IHC scores of indicated factors in allograft mouse tumours. Tumours were grouped in three different ways: 1. Zeb1-IHC Score (Zeb1low ≤ 1 vs Zeb1high > 1), 2. Zeb1 genotype (KPC, Zeb1 wt vs KPCZ, Zeb1ko), 3. histological tumour grade (low ≤ 2 vs high > 2). Bar graphs are presented as mean ± SD from n = 17 individual tumours, two-tailed unpaired student t-test.
Extended Data Fig. 5
Extended Data Fig. 5. Zeb1 regulates the transcription of enzymes crucial for adjusting the PUFA/MUFA ratio in phospholipids.
a) Schemes of genomic regions with predicted binding sites for indicated factors of Zeb1 repressed and activated genes (TSS = transcriptional start site). b) Luciferase reporter assays for the indicated regulatory elements of Zeb1 activated genes (ELOVL5, FADS2, and ACSL4) after co-transfection of the indicated transcription factors in MCF7 (low endogenous expression). A reporter constructs of the known Zeb1 activated target gene ANKRD1 was used as positive control. Data are given as relative ratio to empty vector (ev) and are presented as mean ± SEM from n = 3–6 independent experiments, two-tailed unpaired student t-test.
Extended Data Fig. 6
Extended Data Fig. 6. Manipulation of crucial enzymes adjusting the PUFA/MUFA ratio affects ferroptosis sensitivity.
a) Relative viability and death rate in A549 cells treated with 5 µM of the SCD inhibitors CAY10566 or MF438 for 24 h, followed by ML210 treatment for 72 h. Death rate is displayed for 24 h at 0.6 µM ML210. n = 3 independent experiments, ordinary two-way ANOVA. b) Absolute amounts (pmol/1×106 cells) and relative abundances (% of total phosphatidylethanolamine, PE) of PE(18:1/18:1) isomers (Δ9: SCD1-specific isomer; Δ6: FADS2-specific isomer) in MDA-MB-231 (shCtrl and shZeb1) cells treated with vehicle or the SCD inhibitor CAY10566 (3 µM) for 48 h. n = 5 independent experiments, two-tailed paired student t-test or ordinary two-way ANOVA. c) Relative viability of MDA-MB-231 (shCtrl and shZeb1) cells treated with vehicle (Veh), the GPX4 inhibitors RSL3 (1 µM) or ML210 (3 µM) in the absence (Veh) or presence of CAY10566 (3 µM) for 48 h. n = 3 independent experiments, repeated measures two-way ANOVA. d, e) Proportions of saturated (SFA), monounsaturated (MUFA) and polyunsaturated fatty acids (PUFA) in PE, the proportion of PUFA in PE, and absolute amounts (pmol/1×106 cells) and relative abundances (% of total PE) of PE(18:1/18:1) isomers (Δ9: SCD1-specific isomer; Δ6: FADS2-specific isomer) in MDA-MB-231 (WT) cells treated with sc-26196 (10 µM) for 24 h. n = 3 independent experiments, two-tailed paired student t-test. f, g) Immunoblots and SCD inhibition-induced ferroptosis sensitization after siRNA mediated depletion of Zeb1 in A549 (f) and H358TR (g) cancer cells. Bar graphs show relative death rates of cells pretreated with DMSO or 5 µM MF438, followed by ML210 treatment (0.3 µM for A549, 0.63 µM for H358TR) for 16 h. n = 3 independent experiments, ordinary two-way ANOVA. h) Relative viability of U2OS and doxorubicin-resistant U2OS (U2OS-Dox) cells treated with ML210 (10 µM), the SCD inhibitor CAY10566 (10 µM) or the indicated combinations for 48 h. n = 3 independent experiments, ordinary two-way ANOVA. All data are presented as presented as mean ± SEM.

References

    1. Brabletz, S., Schuhwerk, H., Brabletz, T. & Stemmler, M. P. Dynamic EMT: a multi-tool for tumor progression. EMBO J.40, e108647 (2021). 10.15252/embj.2021108647 - DOI - PMC - PubMed
    1. Yang, J. et al. Guidelines and definitions for research on epithelial–mesenchymal transition. Nat. Rev. Mol. Cell Biol.21, 341–352 (2020). 10.1038/s41580-020-0237-9 - DOI - PMC - PubMed
    1. Dongre, A. & Weinberg, R. A. New insights into the mechanisms of epithelial–mesenchymal transition and implications for cancer. Nat. Rev. Mol. Cell Biol.20, 69–84 (2019). 10.1038/s41580-018-0080-4 - DOI - PubMed
    1. Nieto, M. A., Huang, Ruby, Y.-J., Jackson, R. A. & Thiery, J. P. EMT: 2016. Cell166, 21–45 (2016). 10.1016/j.cell.2016.06.028 - DOI - PubMed
    1. Pastushenko, I. & Blanpain, C. EMT transition states during tumor progression and metastasis. Trends Cell Biol.29, 212–226 (2019). 10.1016/j.tcb.2018.12.001 - DOI - PubMed

Publication types

MeSH terms