. 2024 Jul 15;14(1):16251.
doi: 10.1038/s41598-024-66780-w.

Integrating plasma proteomics with genome-wide association data to identify novel drug targets for inflammatory bowel disease

Affiliations

Integrating plasma proteomics with genome-wide association data to identify novel drug targets for inflammatory bowel disease

Zhongyuan Bai et al. Sci Rep. .

Abstract

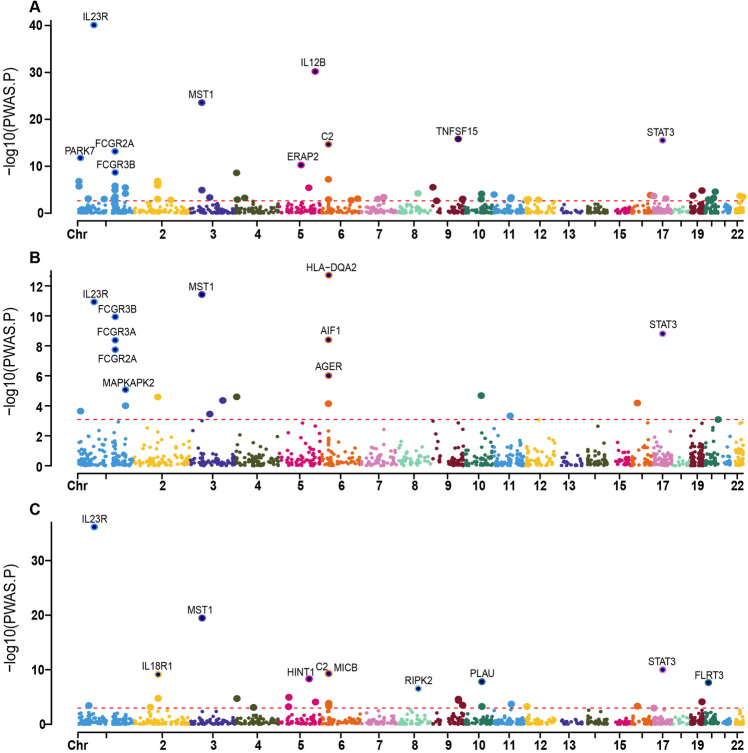
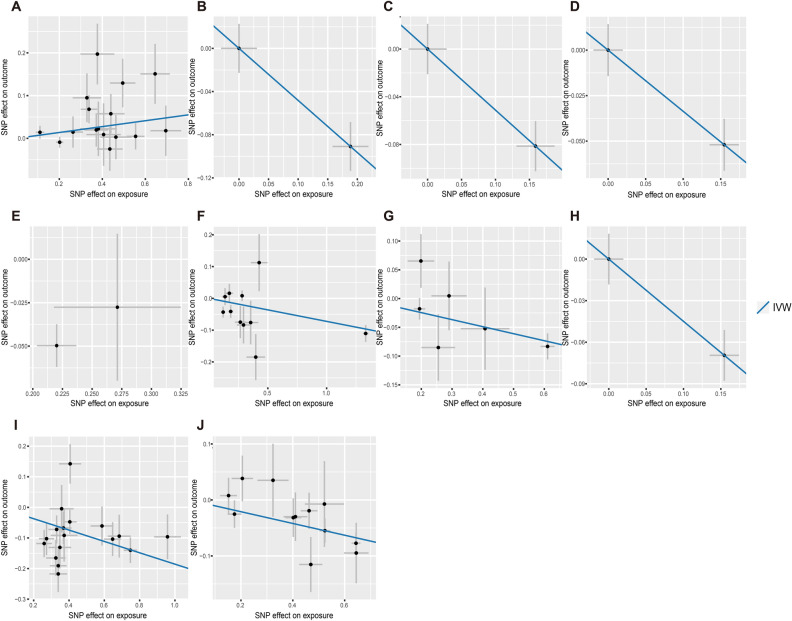
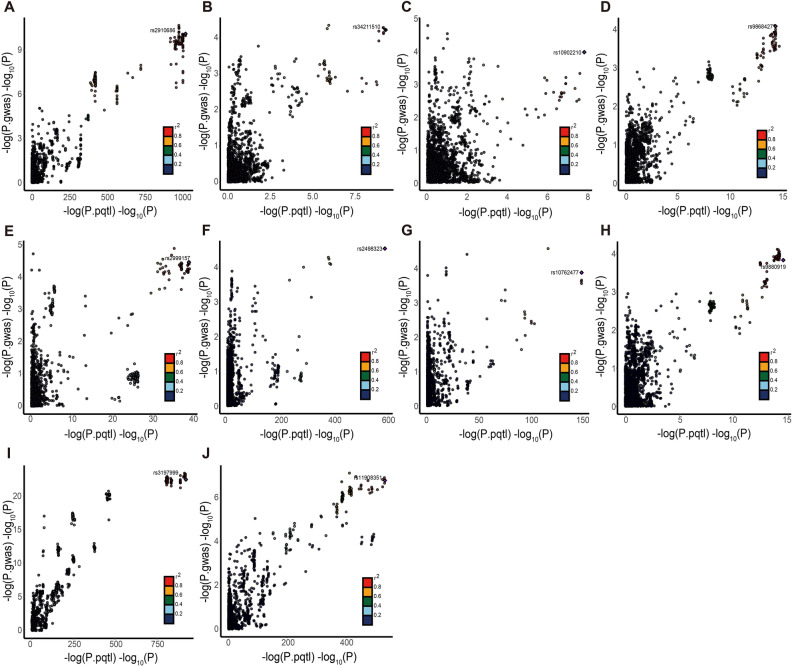
Inflammatory bowel disease (IBD) is a chronic disease that includes Crohn's disease (CD) and ulcerative colitis (UC). Although genome-wide association studies (GWASs) have identified many relevant genetic risk loci, the impact of these loci on protein abundance and their potential utility as clinical therapeutic targets remain uncertain. Therefore, this study aimed to investigate the pathogenesis of IBD and identify effective therapeutic targets through a comprehensive and integrated analysis. We systematically integrated GWAS data related to IBD, UC and CD (N = 25,305) by the study of de Lange KM with the human blood proteome (N = 7213) by the Atherosclerosis Risk in Communities (ARIC) study. Proteome-wide association study (PWAS), mendelian randomisation (MR) and Bayesian colocalisation analysis were used to identify proteins contributing to the risk of IBD. Integrative analysis revealed that genetic variations in IBD, UC and CD affected the abundance of five (ERAP2, RIPK2, TALDO1, CADM2 and RHOC), three (VSIR, HGFAC and CADM2) and two (MST1 and FLRT3) cis-regulated plasma proteins, respectively (P < 0.05). Among the proteins identified via Bayesian colocalisation analysis, CADM2 was found to be an important common protein between IBD and UC. A drug and five druggable target genes were identified from DGIdb after Bayesian colocalisation analysis. Our study's findings from genetic and proteomic approaches have identified compelling proteins that may serve as important leads for future functional studies and potential drug targets for IBD (UC and CD).

Keywords: Crohn’s disease; Inflammatory bowel disease; Mendelian randomisation; Proteome-wide association study; Ulcerative colitis.


Conflict of interest statement

The authors declare no competing interests.

Figures

Figure 1
Figure 1
PWAS of IBD (A), UC (B) and CD (C) with the plasma proteomes (N = 1348) and GWAS were integrated in Manhattan plot using FUSION Each point in the plot indicates a single association test between a plasma protein and IBD, UC and CD as the -log10 (P) of a z-score test result which ordered by genomic position on the x axis and the association strength on the y axis. 62, 21 and 30 proteins were identified whose cis-regulated plasma protein abundance correlated with IBD, UC and CD, respectively, and the top 10 proteins with the highest correlation are illustrated in the figure. The red horizontal line represents the significant threshold for Bonferroni correction of the FDR P < 0.05 which was set at the highest unadjusted P value that is below that in IBD, UC and CD, seperately.
Figure 2
Figure 2
Association of protein expression in the blood with IBD (A), UC (B) and CD (C) risk The forest map for estimates of the relationship between genetically predicted protein levels and IBD, UC and CD.
Figure 3
Figure 3
Scatter plots for the MR analysis Scatter plots for IVW highlighting the effect of protein level on IBD, UC and CD. (A) ERAP2 (B) RIPK2 (C) TALDO1 (D) CADM2 (E) RHOC (F) HGFAC (G) VSIR (H) CADM2 (I) MST1 (J) FLRT3.
Figure 4
Figure 4
Genetic colocalization of IBD (A-E), UC (F–H) and CD (I-J) (A) ERAP2 (B) RIPK2 (C) TALDO1 (D) CADM2 (E) RHOC (F) HGFAC (G) VSIR (H) CADM2 (I) MST1 (J) FLRT3. In this view, each dot is a genetic variant. The SNP with the most notable P value with IBD, UC and CD is marked, and the colors of other SNPs depends on the digit size ordering of linkage disequilibrium (r2). SNPs with missing linkage disequilibrium information are also coded dark blue. In the LocusZoom plots, -log10 (P.gwas) for links with IBD, UC and CD risk are on the x-axes, and -log10 (P.pqtl) for relationship with the protein levels on the y-axes.

References

    1. Annese V. Genetics and epigenetics of IBD. Pharmacol. Res. 2020;159:104892. doi: 10.1016/j.phrs.2020.104892. - DOI - PubMed
    1. Graham DB, Xavier RJ. Pathway paradigms revealed from the genetics of inflammatory bowel disease. Nature. 2020;578:527–539. doi: 10.1038/s41586-020-2025-2. - DOI - PMC - PubMed
    1. Khor B, Gardet A, Xavier RJ. Genetics and pathogenesis of inflammatory bowel disease. Nature. 2011;474:307–317. doi: 10.1038/nature10209. - DOI - PMC - PubMed
    1. McGovern DP, Kugathasan S, Cho JH. Genetics of inflammatory bowel diseases. Gastroenterology. 2015;149:1163–1176.e2. doi: 10.1053/j.gastro.2015.08.001. - DOI - PMC - PubMed
    1. de Lange KM, Moutsianas L, Lee JC, et al. Genome-wide association study implicates immune activation of multiple integrin genes in inflammatory bowel disease. Nat. Genet. 2017;49:256–261. doi: 10.1038/ng.3760. - DOI - PMC - PubMed

MeSH terms

LinkOut - more resources