. 2024 Sep;9(9):2244-2261.
doi: 10.1038/s41564-024-01761-3. Epub 2024 Jul 15.

Gut microbial factors predict disease severity in a mouse model of multiple sclerosis

Affiliations

Gut microbial factors predict disease severity in a mouse model of multiple sclerosis

Alex Steimle et al. Nat Microbiol. 2024 Sep.

Abstract

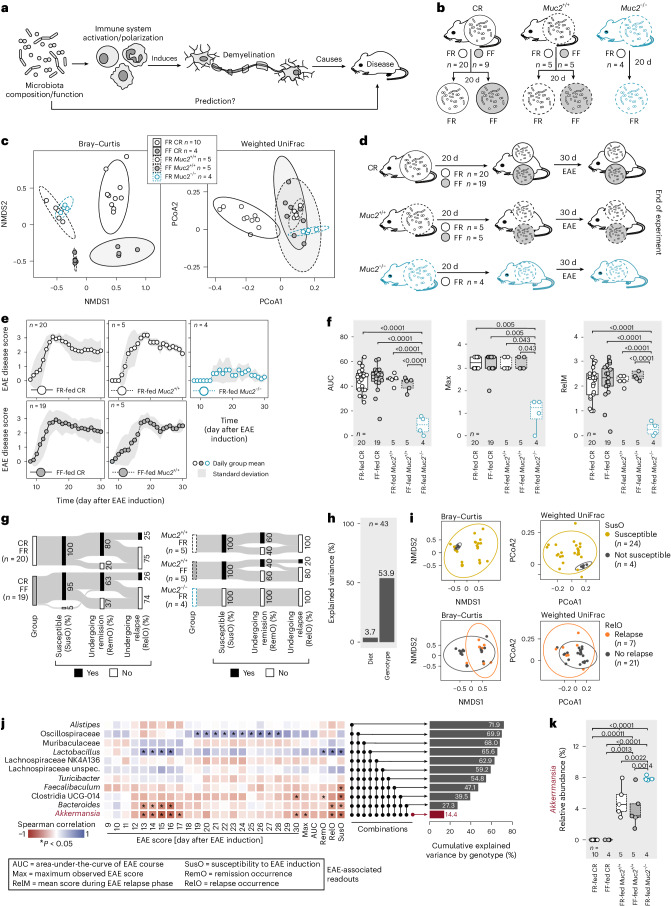
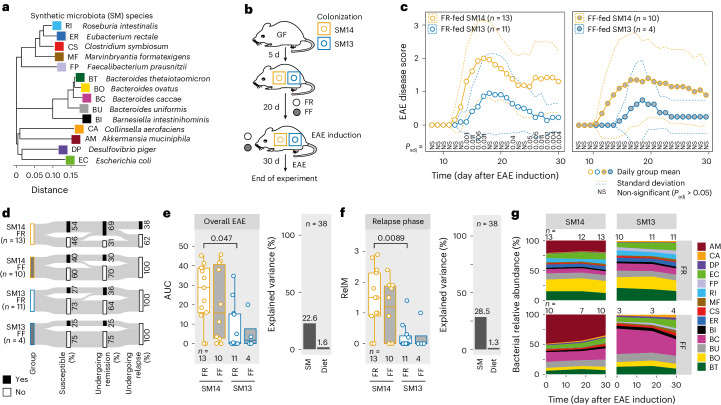
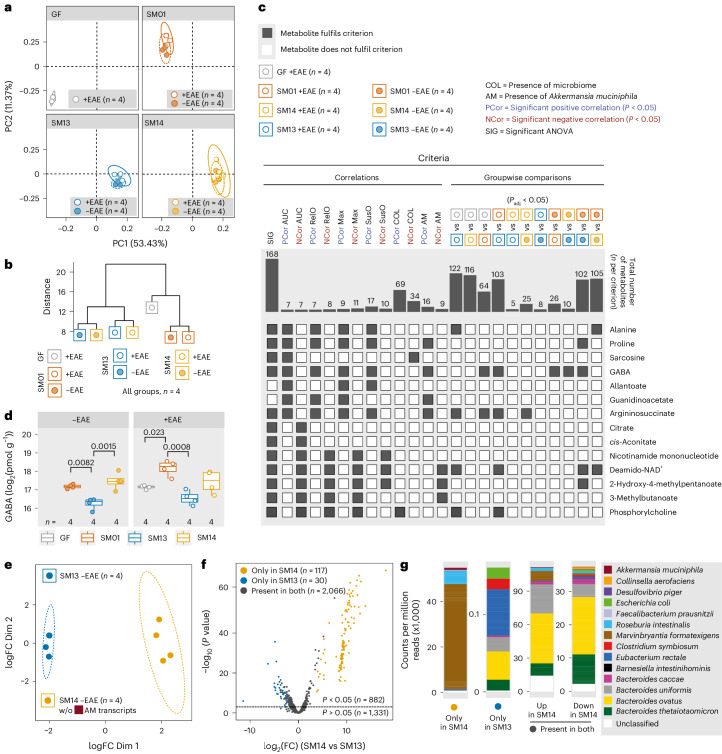
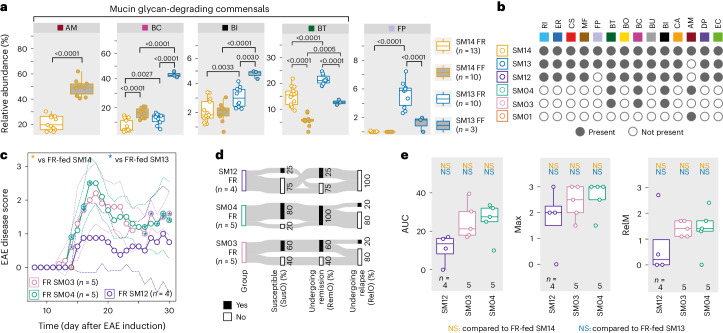
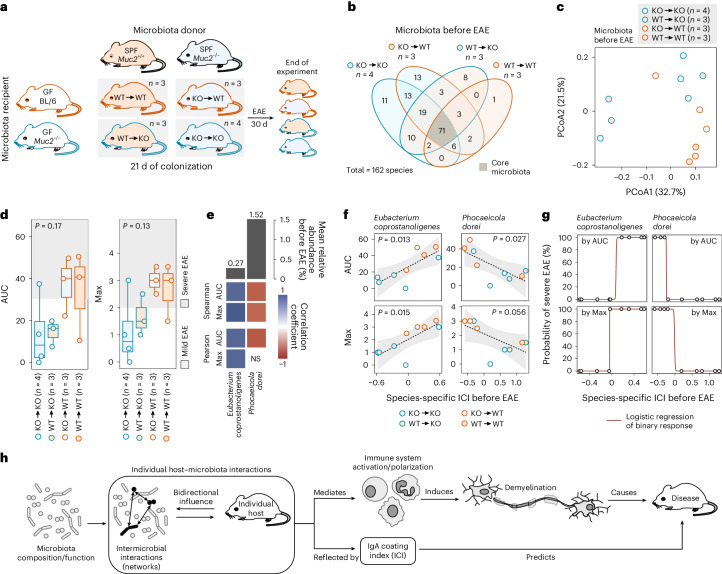
Gut bacteria are linked to neurodegenerative diseases but the risk factors beyond microbiota composition are limited. Here we used a pre-clinical model of multiple sclerosis (MS), experimental autoimmune encephalomyelitis (EAE), to identify microbial risk factors. Mice with different genotypes and complex microbiotas or six combinations of a synthetic human microbiota were analysed, resulting in varying probabilities of severe neuroinflammation. However, the presence or relative abundances of suspected microbial risk factors failed to predict disease severity. Akkermansia muciniphila, often associated with MS, exhibited variable associations with EAE severity depending on the background microbiota. Significant inter-individual disease course variations were observed among mice harbouring the same microbiota. Evaluation of microbial functional characteristics and host immune responses demonstrated that the immunoglobulin A coating index of certain bacteria before disease onset is a robust individualized predictor of disease development. Our study highlights the need to consider microbial community networks and host-specific bidirectional interactions when aiming to predict severity of neuroinflammation.


Conflict of interest statement

M.S.D. works as a consultant and an advisory board member at Theralution GmbH, Germany. S.F. is a founder and CEO of Metagen, Inc., Japan, focused on the design and control of the gut environment for human health. The other authors declare no competing interests.

Figures

Fig. 1
Fig. 1. Increased abundance of Akkermansia associated with lower neuroinflammation in mice with complex microbiota.
a, Summary of the central study objective. b, C57BL/6J mice from Charles River Laboratories (CR), Muc2+/+ and Muc2−/− littermates housed under SPF conditions were fed a fibre-rich (FR, standard chow) or a fibre-free (FF) diet for 20 d. c, β-diversity analyses of faecal microbial communities after 20 d feeding on FR or FF diet. Left: non-metric multidimensional scaling (NMDS) plot based on a Bray–Curtis distance matrix. Right: principal coordinates analysis (PCoA) using a weighted UniFrac distance matrix. Ellipses show 95% confidence intervals. d, Mice depicted in b were subjected to EAE induction and observed for 30 d with daily scoring. e, EAE disease scores as a function of time. f, EAE-associated readouts analysed by one-way ANOVA followed by Tukey’s post-hoc test (AUC and RelM) or Wilcoxon rank-sum tests (Max), with P-value adjustment using the Benjamini–Hochberg method. g, Sankey diagram of key event occurrence (in % of all mice within one group) during EAE. h, Variance explained by diet and genotype (CR and Muc2+/+ versus Muc2−/−) comparing AUC among all five diet–genotype combinations (n = 43) as determined by eta-squared (η2) calculation. i, Projections from e grouped by SusO and RelO, as defined in g. j, Spearman correlations between relative abundances of the indicated genera before EAE induction, with EAE-associated readouts (as defined in f and g) for each mouse across all five groups (n = 28). Statistically significant (P < 0.05) correlations by linear regression are indicated by asterisks (*). Horizontal bars (right) depict cumulative explained variance by genotype (CR and Muc2+/+ versus Muc2−/−) using the Bray–Curtis dissimilarity index for combinations of 11 genera ordered from highest single contribution (bottom) to lowest single contribution (top). k, Akkermansia relative abundance before EAE induction. One-way ANOVA followed by Tukey’s post-hoc test. Mouse numbers are indicated on the respective panels and treated as biological replicates. Boxplots (f,k) show median, quartiles and 1.5 × IQR. Source data
Fig. 2
Fig. 2. A synthetic microbiota (SM) without A. muciniphila results in reduced neuroinflammation.
a, Neighbour-joining phylogenetic tree based on full-length 16S rRNA gene sequences of the SM14 strains (see Supplementary Table 1 for full strain designation and accession numbers for sequences to build tree). b, GF C57BL/6N mice were colonized with either SM14 or SM13 (SM14 without A. muciniphila) communities. After 5 d, both groups were switched to FR (standard chow) or FF diet. After 20 d feeding, EAE was induced in all mice and disease course was observed for 30 d. c, EAE disease scores as a function of time. Dashed lines represent s.d. Daily EAE scores were compared using a Wilcoxon rank-sum test with P-value adjustment using the Benjamini–Hochberg method. Left: FR-fed SM14- and SM13-colonized mice. Right: FF-fed mice harbouring the same SM combinations. Daily EAE scores for mice harbouring the same SM and fed different diets were statistically non-significant (P > 0.05) for all timepoints. d, Sankey diagram of key event occurrence (in % of all mice within one group) during EAE. e, Left: AUC analysis of the disease course depicted in c. One-way ANOVA followed by Tukey’s post-hoc test. Right: variance explained by diet or colonization (SM) when comparing AUC among all four groups, as determined using η2 calculation. f, Left: mean EAE score during relapse phase (RelM, day 26 to day 30 after EAE induction). One-way ANOVA followed by Tukey’s post-hoc test. Right: variance explained by diet or colonization (SM) when comparing RelM among all four groups, as determined using η2 calculation. g, Mean relative abundances of SM strains over time (day after EAE induction), faceted by group. Species abbreviations are depicted in a. Missing values reflect times when faecal samples could not be collected. Mouse numbers are indicated on the respective panels and treated as biological replicates. FR-fed SM14 and SM13 data are from three independent experiments; FF-fed SM14 data are from two independent experiments; FF-fed SM13 data are from one experiment. Boxplots (e,f) show median, quartiles and 1.5 × IQR. All statistical tests were two-sided. Source data
Fig. 3
Fig. 3. A. muciniphila-mediated neuroinflammation is associated with increased caecal concentrations of γ-amino butyric acid.
ad, GF C57BL/6N mice were colonized with A. muciniphila only (SM01), SM13, SM14 or remained GF. Caecal contents were collected 25 d after colonization (−EAE) or 30 d after EAE induction (+EAE) and subjected to CE–TOF/MS-based metabolomics analysis. a, Principal component analysis (PCA) of log2-normalized metabolite concentrations, faceted by colonization. b, Ward hierarchical clustering based on scaled group means of log2-normalized metabolite concentrations. c, Statistically significant positive (PCor) or negative (NCor) Spearman correlations by linear regression across all samples (both −EAE and +EAE mice) and groupwise comparison criteria. Correlations referring to EAE-associated readouts (abbreviations as in Fig. 1) were calculated from +EAE mice only. Groupwise comparisons include significantly different metabolites based on unpaired t-tests of log2-normalized concentrations with P-value adjustment using the Benjamini–Hochberg method. Barplots indicate the total number of metabolites that fulfil each criterion. Of 175 measured metabolites, only the 14 metabolites that demonstrate a significant correlation with AUC are displayed. Grey squares indicate that a given metabolite fulfilled a specific criterion, while white squares indicate failure to fulfil a given criterion. d, Boxplots showing median, quartiles and 1.5 × IQR of log2-concentrations of GABA −EAE or +EAE conditions. One-way ANOVA followed by Tukey’s post-hoc test. e, Multidimensional reduction of caecal metatranscriptome profiles of −EAE SM14- and SM13-colonized mice. In SM14-colonized mice, transcripts attributed to A. muciniphila were removed and counts were renormalized to allow for fair comparison with metatranscriptome profiles of SM13-colonized mice. Two dots from SM13 −EAE overlap in the plot. f, Volcano plot showing log2(fold change, FC) of gene product-annotated transcript abundances in SM14- vs SM13-colonized mice (x axis) and −log10(P value) (y axis), calculated using an exact test in edgeR. Dashed line represents significance threshold. Yellow and blue dots represent transcripts found only in SM14- or SM13-colonized mice, respectively, while grey dots represent transcripts found in both groups. g, Two left columns: transcripts found only in SM14-colonized or SM13-colonized mice. Two right columns: transcripts up- or downregulated in SM14- vs SM13-colonized mice but present in both groups. Mouse numbers are indicated on the respective panels and treated as biological replicates. All statistical tests were two-sided. Source data
Fig. 4
Fig. 4. Microbial mucin degradation is disconnected from EAE disease course.
a, Relative abundances of strains that provided statistically significant differences between FR-fed SM14-colonized mice and FR-fed SM13-colonized mice on the day of EAE induction, as determined using one-way ANOVA followed by multiple comparisons with P-value adjustment using the Benjamini–Hochberg method. Only biologically meaningful multiple comparisons made (same SM, different diet; different SM, same diet). b, Constituent strains of the SM communities. Strain abbreviations as in Fig. 2a. c, EAE disease scores as a function of time. Daily EAE scores were compared using Wilcoxon rank-sum tests with P-value adjustment using the Benjamini–Hochberg method. Blue asterisks represent comparison with FR-fed SM13-colonized mice, while yellow asterisks represent comparison with FR-fed SM14-colonized mice. *P < 0.05. d, Sankey diagram of key event occurrence (in % of all mice within one group) during EAE. e, Left: AUC analysis of the disease course depicted in c. Each mouse is depicted by a separate dot. Middle: maximum EAE score per mouse (Max). Right: mean EAE score during relapse phase (RelM, day 26 to day 30 after EAE induction). Analysed using one-way ANOVA followed by Tukey’s post-hoc test for groupwise comparisons (AUC and RelM) or Wilcoxon rank-sum tests with P-value adjustment using the Benjamini–Hochberg method (Max). Blue text indicates comparison with FR-fed SM13-colonized mice, while yellow text indicates comparison with FR-fed SM14-colonized mice. NS, not significant. Mouse numbers are indicated on the respective panels and treated as biological replicates. FR-fed SM14 and SM13 data are from three independent experiments; FF-fed SM14 data are from two independent experiments; all other groups are from one experiment. Boxplots (a,e) show median, quartiles and 1.5× IQR. All statistical tests were two-sided. Source data
Fig. 5
Fig. 5. Groupwise and individual prediction of EAE based on microbiota characteristics.
a, Heat map of EAE disease course of all tested colonization–diet combinations. b, Horizontal barplots summarizing EAE-associated readouts of all tested colonization–diet combinations. c, Cluster dendrogram of scaled group means of EAE-associated readouts based on a Euclidian distance matrix. Group phenotypes (moderate, intermediate and severe) classified according to the three clusters. d, Variance explained by diet or SM when comparing EAE-associated readouts among all colonization–diet combinations (n = 65) using η2 calculation. e, Individual-level EAE phenotype classification by t-SNE analysis (perplexity of 20 with 6 initial dimensions) of EAE-associated readouts across all tested colonization–diet combinations. f, Proportion of mice in Cluster 1 (strong EAE symptoms) per SM–diet combination, with groupwise EAE phenotype classification indicated at the bottom. g, Colour codes and abbreviations of SM14 constituents. h, Pearson correlation between strain relative abundance before EAE induction and EAE-associated readouts for mice fed both diets. AUC–strain correlations as barplots; Max–strain and RelM–strain correlations as colour-coded squares. Significant correlations (P < 0.05) by linear regression in colour; non-significant correlations in grey. Correlations calculated for four different SM combinations: SM13 only; SM14 only; SM13 and SM14; and SM12, SM13 and SM14. i, Variance of EAE-associated readouts explained by strain relative abundance before EAE induction, performed by combining SM12-, SM13- and SM14-colonized mice irrespective of diet (n = 40). j, Linear mixed model regression for predicted AUC, with strain presence as an independent variable and SM as a random intercept effect (n = 40). k, Variance in ICI explained by high- (SM12, SM13, SM14) versus low- (SM03, SM04) diversity background microbiota compositions in two strains providing the highest explained variance using η2 calculation. l, Individual-based Pearson (top) and Spearman (bottom) correlations of key EAE-associated readouts with ICIs of SM14-constituent strains in SM12-, SM13- and SM14-colonized mice (n = 12) before EAE induction. *P < 0.05 by linear regression. MF strain absent due to lack of data. m, Correlation of B. ovatus ICI with AUC (left) and maximum EAE score (Max, right) by linear regression in all mice harbouring B. ovatus, irrespective of the background microbiota. Dashed line represents linear regression, with the confidence interval shaded in grey. Source data
Fig. 6
Fig. 6. IgA coating index of reporter species to predict neuroinflammation-promoting properties of complex microbiotas.
a, Microbiota from SPF-housed Muc2−/− (KO) and Muc2+/+ (WT) mice was transferred to GF C57BL/6J (BL/6) and Muc2−/− mice. After 21 d of colonization with the donor microbiota, EAE was induced and disease course monitored for 30 d. b, Venn diagram of microbiota compositions by full-length 16S rRNA gene sequencing across the four donor–recipient combinations. Numbers reflect shared species for the specified donor–recipient combination, with core microbiota, shared by all, highlighted in grey. c, β-diversity of pre-EAE microbiota compositions as determined from a Bray–Curtis distance matrix of arcsine square root-transformed relative abundance data, ordinated using principal coordinate analysis. d, AUC (left) and maximum EAE disease score (Max, right) of individual disease courses depicted in Extended Data Fig. 9d. AUC, one-way ANOVA with donor–recipient combinations as tested variable (AUC) or Kruskall–Wallis test with donor–recipient combinations as tested variable (Max). Individual EAE phenotype classification (‘mild’ vs ‘severe’) based on Extended Data Fig. 9f. Boxplots show median, quartiles and 1.5× IQR. e, Individual-based Pearson and Spearman correlations of EAE-associated readouts (AUC, Max) with ICIs of Eubacterium coprostanoligenes and Phocaeicola dorei before EAE induction. Mice of all donor–recipient combinations were included in this analysis. Significant correlations are depicted in shades of blue or red. Grey bars represent mean relative abundance across all mice before EAE induction. f, Correlation of individual ICIs for E. coprostanoligenes and P. dorei with individual values for AUC (top) and Max (bottom) by linear regression. Only mice where E. coprostanoligenes or P. dorei were detectable in both fractions after sorting are shown. Dashed line represents linear regression, with the confidence interval shaded in grey. g, Binomial regression model to predict probability of severe disease based on classification by either AUC (top panels) or Max (bottom panels) using ICI of E. coprostanoligenes or P. dorei. For definition of disease severity, see Extended Data Fig. 9f. h, Graphical summary of results. Microbiota composition alone fails to predict individual EAE susceptibility or development. However, individual host–microbiota interactions, which are reflected by the ICI of certain reporter species, were suitable for predicting individual EAE disease courses. Source data
Extended Data Fig. 1
Extended Data Fig. 1. Graphical summary of experiments, analyses and conclusion.
Step 1 (see also Fig. 1): First, we evaluated which bacterial genera were most associated with EAE disease development across genetically heterogenous mice harbouring 5 distinct complex microbiota compositions. We found that low relative abundance of Akkermansia (dark red bacteria icon) was associated with higher risk of severe EAE development (red circle), and higher abundances of this genus was associated with moderate disease and low disease risk (green circle). Step 2 (see also Figs. 2−4): Thus, we wondered whether presence or relative abundance of the Akkermansia type species Akkermansia muciniphila before induction of EAE could predict subsequent disease development. To test this, we induced EAE in mice harbouring 6 different combinations of a well-characterised 14-strain consortium under gnotobiotic conditions. In mice harbouring these microbiotas, A. muciniphila was either present or absent, and if present, A. muciniphila provided either high or low relative abundances. We found that distinct microbiota compositions resulted in ‘high risk’ and ‘low risk’ microbiota compositions, as determined by the proportion of mice developing severe disease. However, disease susceptibility was not uniform across mice harbouring the same microbiota. Step 3 (see also Fig. 5): We further determined that neither relative abundance, nor the presence or absence of A. muciniphila, or any other strain of the tested consortium, could reliably predict EAE development across distinct communities in individual mice. However, we found that the pre-EAE IgA coating index (ICI) of a consortium member strain, Bacteroides ovatus, significantly correlated with individual EAE outcome after disease induction, irrespective of the microbiota composition. Step 4 (see also Fig. 6): We then successfully verified the potential for species-specific ICIs, as determined before disease induction, to predict individual disease severity in genetically distinct mice containing various complex microbiotas. Conclusion: Making predictions on EAE development based on microbiota characteristics (that is assessing the individual disease risk) is possible, however, it must take into account inter-microbial interactions (‘networks’) within a given, individual community and host-specific responses to a certain microbiota composition.
Extended Data Fig. 2
Extended Data Fig. 2. Operational taxonomic unit level-based microbiota analysis of SPF-housed mice.
All samples were analysed together using the same analysis pipeline. Only operational taxonomic units (OTUs) that provided a mean relative abundance of > 0.01% in at least one group were included in the analyses. Intersection analysis to identify taxa, which are either present or absent only in Muc2−/− mice. Taxa were considered ‘present’ within a certain group, when group mean relative abundance of a given taxon was > 0.01%. Otherwise, taxa were considered ‘absent’ in the respective group. Left panels, intersection sizes of OTUs between the five groups. Three different intersection sizes are shown (‘Distinct’, ‘Intersect’, and ‘Union’), which are explained in the lower panels. Middle panel, Venn diagram highlighting the number of shared and distinct OTUs between the groups. Dark red, taxa only present in Muc2−/− mice; teal, taxa not present in Muc2−/− mice, but in all other mice; orange, core microbiome shared by mice of all five groups. List of OTUs belonging to these three groups provided on the right side. Source data
Extended Data Fig. 3
Extended Data Fig. 3. Experimental autoimmune encephalomyelitis scoring scheme.
This decision tree depicts how daily assessment of experimental autoimmune encephalomyelitis (EAE) scores was performed. Light grey boxes indicate instructions on mouse handling and EAE phenotype-associated questions (Q) which are highlighted in bold font. Dark grey boxes indicate possible answers (A) to the questions (Q). Red circles indicate the resulting EAE score. All arrows (answer options) are mutually exclusive.
Extended Data Fig. 4
Extended Data Fig. 4. Experimental autoimmune encephalomyelitis disease course in germ-free, SM01-, SM13- and SM14-colonized mice.
a, Left, maximum achieved EAE score per individual (Max) within FR-fed SM13-colonized mice, FF-fed SM13-colonized mice, FR-fed SM14-colonized mice and FF-fed SM14-colonized mice. Wilcoxon rank-sum test with p-value adjustment using the Benjamini-Hochberg method. No statistically significant group differences were observed. Right, percentage of variance explained by diet (FR vs. FF) and SM combination (SM13 vs. SM14) as determined by eta-squared calculation when comparing the maximum achieved EAE score during the 30 d disease observation period between FR- and FF-fed SM14- and SM13-colonized mice. b–d, Germ-free (GF) C57BL/6N mice were either monocolonized with A. muciniphila (SM01) or remained GF and were fed either FR or FF diet. SM01 mice were only fed the FR diet. EAE was induced in GF mice 20 d after diet switch. EAE was induced in SM01-colonized mice 25 d after initial colonization. Disease course in all groups was observed for 30 days after EAE induction. b, EAE disease scores as a function of time (days after EAE induction) for FR-fed GF mice, FF-fed GF mice and FR-fed SM01-colonized mice. Dots represent daily group means. Dashed lines represent SD. c, Sankey diagram of key event occurrence (in % of all mice within one group) during EAE. d, AUC analysis of the disease course depicted in panel b. Each mouse is depicted by a separate dot. One-way ANOVA followed by Tukey’s post-hoc test. No statistically significant group differences were observed. Mouse numbers are indicated on the respective panels and treated as biological replicates. Boxplots (a, d) show median, quartiles, and 1.5 × interquartile range. Source data
Extended Data Fig. 5
Extended Data Fig. 5. Metabolite-of-interest analysis pipeline.
a, Pearson’s correlation of metabolite concentrations with key EAE-associated readouts (AUC, Max, RelM, and SusO). Only samples from EAE-induced mice were used for analysis. Significant correlations are shown in either blue (positive) or red (negative). Non-significant correlations are not shown. Metabolites are listed under their KEGG ID (for GABA, C00334). A list of metabolite names with corresponding KEGG IDs is provided in Supplementary Table 2. b, Volcano plots of groupwise comparisons as indicated by the colour-coded legend for log2-normalized metabolite concentrations based on unpaired t-tests with p-value adjustment using the Benjamini-Hochberg method. Each dot represents one metabolite. Metabolites with significantly different (adjusted p < 0.05) concentrations are highlighted in red. c, Criteria intersection analysis of the 175 detected metabolites that were identified in at least 50% of the samples of at least one group. Criteria were categorized into correlation criteria, summarizing the results of either statistically significant positive (PCor) or statistically significant negative (NCor) Spearman correlations across all samples of all groups (both EAE-induced and non-induced mice) and groupwise comparison criteria. Correlations referring to EAE-associated readouts were calculated using samples from EAE-induced mice only. Groupwise comparisons include metabolites found to be significantly different (adjusted p < 0.05) based on unpaired t-tests of log2-normalized concentrations with p-value adjustment using the Benjamini-Hochberg method. Source data
Extended Data Fig. 6
Extended Data Fig. 6. Analysis of barrier integrity and mucin-associated glycan degrading capacities of reduced microbiota compositions.
a, Strain relative abundances in SM03-, SM04- and SM12-colonized mice after initial colonization as detected by qPCR using strain-specific primers (Supplementary Table 1). b–e, Activities of α-fucosidase (Fuc), α-galactosidase (Gal), β-glucosidase (Gluc), β-N-acetyl-glucosaminidase (Nag), and sulfatase (Sulf) in faeces collected before EAE induction (START), during the phase with the maximum EAE score (PEAK, day 14–20, depending on the individual), and remission (REM, day 21–25 after EAE induction). b, Boxplot of faecal enzymatic activities before EAE induction (START). One-way ANOVA followed by Tukey’s post-hoc test. Statistical differences indicated by compact letter display: two groups sharing an assigned letter, non-significant; two groups not sharing an assigned letter, p < 0.05. c, Boxplot of faecal enzyme activities of EAE-induced mice, based on cluster affiliation (Fig. 5e) and phase (START, PEAK, REM). Unpaired t-test; ns, non-significant. d, Pearson correlations of faecal enzymatic activities of EAE-induced mice before EAE induction with key EAE-associated readouts after EAE-induction in the same individuals. All correlations non-significant. e, Faecal concentrations of lipocalin 2 (LCN2; 1 outlier removed from SM01 FR) and serum concentrations of lipopolysaccharide (LPS), occludin (OCLN), and zonulin (ZO-1; 1 outlier removed from SM04 FR and SM14 FR) in non-EAE-induced mice (−EAE) or EAE-induced mice at 30 d after EAE-induction (+EAE). One-way ANOVA. ns, non-significant. f, Pearson correlations between faecal LCN2 concentrations, serum OCLN concentrations, serum LPS concentrations and serum ZO-1 concentrations before induction of EAE with key EAE-associated readouts in the same individual across all tested microbiota–diet combinations. All correlations non-significant. g, Faecal concentrations of short-chain fatty acids (SCFA) in non-EAE-induced mice of certain microbiota–diet combinations. One-way ANOVA followed by a Tukey’s post-hoc test. Statistical differences indicated by compact letter display: two groups sharing an assigned letter, p > 0.05; two groups not sharing an assigned letter, p < 0.05. Mouse numbers are indicated on the respective panels and treated as biological replicates. Boxplots (b, c, e, g) show median, quartiles, and 1.5 × interquartile range. Source data
Extended Data Fig. 7
Extended Data Fig. 7. Analysis of T-cell subsets in EAE-induced and non-EAE-induced mice harbouring reduced communities.
a,b, Gating strategy to determine IL-17a and IFNγ expression in T-helper cells of EAE-induced and non-EAE-induced mice. Axes labelled with forward or side light scatter (FSC, SSC), ‘Live/Dead’, or the detected antigen. The fluorochrome coupled to the antigen-specific antibody is indicated in round brackets, with the detection channel in square brackets. Number of detected events is in blue above each plot. Numbers inside the plots refer to the percentage of gated events compared to the parental population of the previous gating step. From the fourth gating step onwards, parental populations are indicated above the plots. Gates in the ‘Live/Dead vs. SSC-H’ depiction for mesenteric lymph nodes (MLN), colonic lamina propria (CLP) and small intestinal lamina propria (SILP), include a pre-gating step for CD45+ cells, which was verified through backgating. The representative EAE-induced (panel a) and non-EAE-induced mouse (panel b) highlight differences in CD45+ cell infiltration in the spinal cords (SC) during EAE. Due to autofluorescence of non-CD45+ cells in SC (highlighted in red), gates set according to the CD45+ and CD3+ populations in other organs of the same individual. c, Proportions (% of CD45+ cells) of lymphocyte subsets in MLN, CLP, or SILP of non-EAE-induced mice. SC excluded due to insufficent CD45+ cell counts in non-EAE-induced mice. Mice grouped according to the group disease phenotype upon EAE induction (Fig. 5c). Means scaled by calculating the percentage of the highest observed value within the respective population–organ combination. ns, non-significant; *, p < 0.05 Unpaired t-test. d, Proportions (% of CD45+ cells) of lymphocyte subsets in MLN, CLP, or SILP of EAE-induced mice 30 d after EAE induction. EAE-induced mice assigned to Cluster 1 (strong EAE symptoms) or Cluster 2 (mild EAE symptoms; Fig. 5e). Scaling approach identical to panel c.: ns, non-significant; *, p < 0.05 Unpaired t-test. e, After filtering to address parental population bias (see Methods), proportions of EAE-associated lymphocyte populations as percentages of ‘Viable’ cells were compared for Cluster 1 and Cluster 2 mice. Unpaired t-test. Boxplots show median, quartiles, and 1.5 × interquartile range. All statistical tests were two-sided. Source data
Extended Data Fig. 8
Extended Data Fig. 8. Microbiota-associated predictors for experimental autoimmune encephalomyelitis development.
a, Strain relative abundances of SM12-, SM13- and SM14-colonized mice, irrespective of diet, before induction of EAE. b, Linear mixed model regression for predicted maximum score during EAE (Max) and mean score during relapse phase (RelM) with presence of the strain as an independent variable and colonization as a random intercept effect. c, Concentrations of secretory IgA (sIgA) in faecal samples samples collected 30 d after EAE induction, normalized to faecal weight. Mice grouped by individual EAE phenotype (Fig. 5e). Due to lack of available material, sIgA could not be measured for some mice. Cluster 1, strong EAE symptoms; Cluster 2, mild EAE symptoms. Wilcoxon rank-sum test. d, Concentrations of faecal sIgA, normalized to faecal weight. Mice grouped by colonization–diet combination and EAE induction status (taken after 30 d of EAE for EAE-induced mice). Kruskal-Wallis test followed by Wilcoxon rank-sum test. Statistical differences are indicated by compact letter display: two groups sharing an assigned letter, non-significant; two groups not sharing an assigned letter, p < 0.05. Right panel, variance of sIgA concentrations explained by either SM or diet. nd, not done. e, Correlation between disease susceptibility among EAE-induced mice harbouring a certain SM with mean faecal sIgA levels in non-EAE-induced mice harbouring the same SM by linear regression. Each dot represents one SM combination. f, IgA coating index (ICI) of each strain dependent on SM. One-way ANOVA. See Methods for details on ICI calculation. ICIs could not be calculated for M. formatexigens as the relative abundance was below the limit of detection for at least one of the sorted fractions across all samples (also applies for panels g and h). na, not applicable; ns, non-significant. g, Variance in IgA coating index (ICI) explained by background microbiota (SM12, SM13 and SM14; FR only) by eta-squared (η2) calculation. Variances could not be calculated for A. muciniphila, as it was only present in one microbiota combination. h, Classification of SM14-constituent strains as IgA high-coated, intermediate, or low-coated, depending on microbiota composition. Boxplots (a, c, d, f) show median, quartiles, and 1.5 × interquartile range. Source data
Extended Data Fig. 9
Extended Data Fig. 9. Experimental autoimmune encephalomyelitis in mice harbouring cross-genotype transferred complex microbiotas.
Microbiota from SPF-housed Muc2−/− (KO) and Muc2+/+ (WT) mice was transferred to germ-free (GF) C57BL/6J and Muc2−/− mice (Fig. 6a). EAE was induced after 21 d exposure to the donor microbiota. a, Faecal microbiota composition in EAE-induced mice on the day of EAE induction (d 0; ‘pre-EAE’), ordered by donor–recipient combination. Microbiota composition was determined on a species level by full-length 16S rRNA gene sequencing. The top 5 most abundant species per phylum are shown. In the case of Verrucomicrobiota, Akkermansia muciniphila was the only detected feature. b, Shannon index as a measure of α-diversity of the pre-EAE microbiota compositions. One-way ANOVA with donor–recipient combinations as tested variable. c, β-Diversity of pre-EAE microbiota compositions from a Bray–Curtis distance matrix of arcsine square root-transformed relative abundance data, ordinated using a principal coordinate analysis. Upper panel, mice coloured by genotype of the microbiota donor. Lower panel, mice coloured by genotype of the microbiota recipient. PERMANOVA using the genotype of either donor (upper panel) or recipient (lower panel) as tested variable. d, EAE disease course of mice (same mice as in panel a), separated by donor–recipient combinations, visualized as EAE disease score as a function of time (day after EAE induction). Dots represents daily mean EAE score; dashed lines represent SD. e, Evaluation of EAE disease course using AUC of the individual disease course (panel d) or the maximum achieved EAE disease score per mouse (Max). Left, mice coloured by donor genotype. Right, mice coloured by recipient genotype. Wilcoxon rank-sum test with donor (left) or recipient (right) genotype as tested variable. Boxplots show median, quartiles, and 1.5 × interquartile range. f, Distribution of individual AUC and Max values to determine ‘Severe’ and ‘Mild’ EAE; accordingly, AUC = 30 and Max = 2 were selected as thresholds to establish a binary categorization of individual EAE phenotypes. g, Individual pre-EAE microbiota composition. Same underlying Bray–Curtis distance matrix and PCoA-ordination as panel c, coloured by binary phenotype classification (panel f) based on individual AUC (left) or Max (right). PERMANOVA with the indicated phenotype classification as tested variable. Source data
Extended Data Fig. 10
Extended Data Fig. 10. Evaluation of species-specific IgA coating indices as individual disease course predictors in mice with complex microbiotas.
a–c, Separation efficiency for IgA-coated (IgA+) and non-IgA-coated (IgA) bacteria in faeces collected on the day of EAE induction (‘pre-EAE’). a, IgA+ and IgA fractions obtained from the same faecal sample were stained with a FITC-coupled anti-mouse IgA antibody and mean fluorescence intensity (MFI) was determined by flow cytometry. Unpaired t-test. Boxplots show median, quartiles, and 1.5 × interquartile range. b, β-Diversity of the microbiota composition of three distinct samples (IgA+, IgA, and unsorted) from a Bray–Curtis distance matrix obtained from arcsine square root transformed relative abundance data on a species level, determined by full-length 16S rRNA gene sequencing. Compositions of unsorted fractions are shown in Extended Data Fig. 9a. Samples of insufficient depth (n = 3) were excluded. c, β-Diversity of IgA+ and IgA fractions from a re-calculated Bray–Curtis distance matrix, after removal of unsorted samples from the analysis. Dashed lines connect IgA+ and IgA fractions from the same sample. PERMANOVA using the post-separation fraction as tested variable based on the re-calculated Bray–Curtis distance matrix. d, Individual Pearson and Spearman correlation of key EAE associated readouts (AUC, Max) with pre-EAE ICIs of species which provided at least one significant correlation. Significant correlations are shown in shades of blue or red. ns, non-significant correlation. See Methods for details on ICI calculation. e, Left, Pearson correlation of Enterocloster bolteae ICI with AUC (upper panel) and Max (lower panel) by linear regression. Right, binomial regression model to predict probability of severe disease, as defined in panel f, based on AUC (top) or Max (bottom) using E. bolteae ICI. Only those mice are shown where E. bolteae was detectable in both fractions after sorting (n = 8). Dots were jittered in case of overlap (upper left panel). f, Prevalence of SM14 species in unsorted samples at the day of EAE induction. Species were considered present when relative abundance was > 0.01%. For species abbreviations and colour coding, see Fig. 5g. g, Pearson correlation of Akkermansia muciniphila ICI with AUC (top) and Max (bottom) by linear regression. Source data

Similar articles

Cited by

References

    1. Miyauchi, E., Shimokawa, C., Steimle, A., Desai, M. S. & Ohno, H. The impact of the gut microbiome on extra-intestinal autoimmune diseases. Nat. Rev. Immunol.23, 9–23 (2022). 10.1038/s41577-022-00727-y - DOI - PubMed
    1. Berer, K. et al. Gut microbiota from multiple sclerosis patients enables spontaneous autoimmune encephalomyelitis in mice. Proc. Natl Acad. Sci. USA114, 10719–10724 (2017). 10.1073/pnas.1711233114 - DOI - PMC - PubMed
    1. Miyake, S. et al. Dysbiosis in the gut microbiota of patients with multiple sclerosis, with a striking depletion of species belonging to Clostridia XIVa and IV clusters. PLoS ONE10, e0137429 (2015). 10.1371/journal.pone.0137429 - DOI - PMC - PubMed
    1. Duscha, A. et al. Propionic acid shapes the multiple sclerosis disease course by an immunomodulatory mechanism. Cell180, 1067–1080.e16 (2020). 10.1016/j.cell.2020.02.035 - DOI - PubMed
    1. Jangi, S. et al. Alterations of the human gut microbiome in multiple sclerosis. Nat. Commun.7, 12015 (2016). 10.1038/ncomms12015 - DOI - PMC - PubMed

Substances

Supplementary concepts

LinkOut - more resources