

Genetic neurodevelopmental clustering and dyslexia
- PMID: 39009701
- PMCID: PMC11649571
- DOI: 10.1038/s41380-024-02649-8
Genetic neurodevelopmental clustering and dyslexia
Abstract
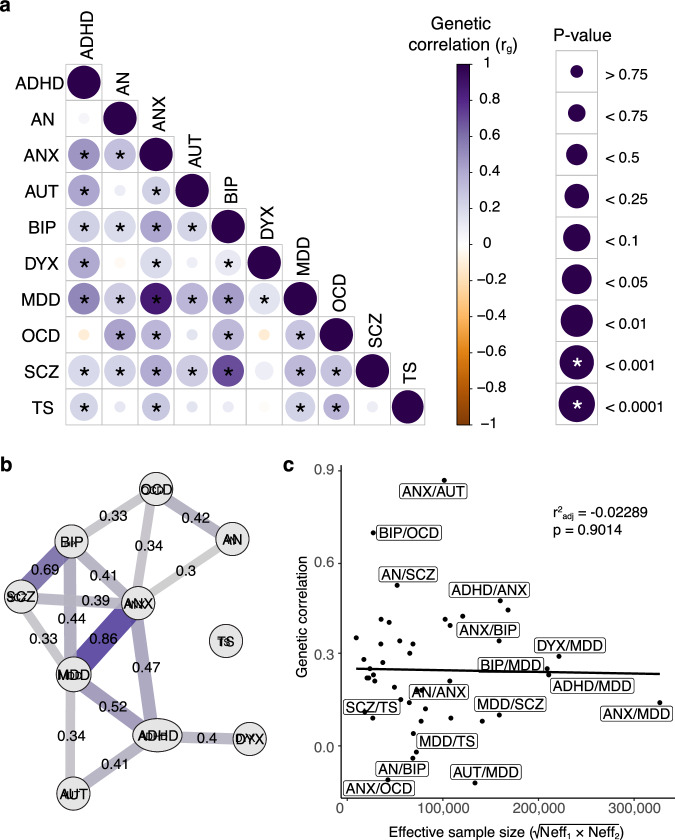
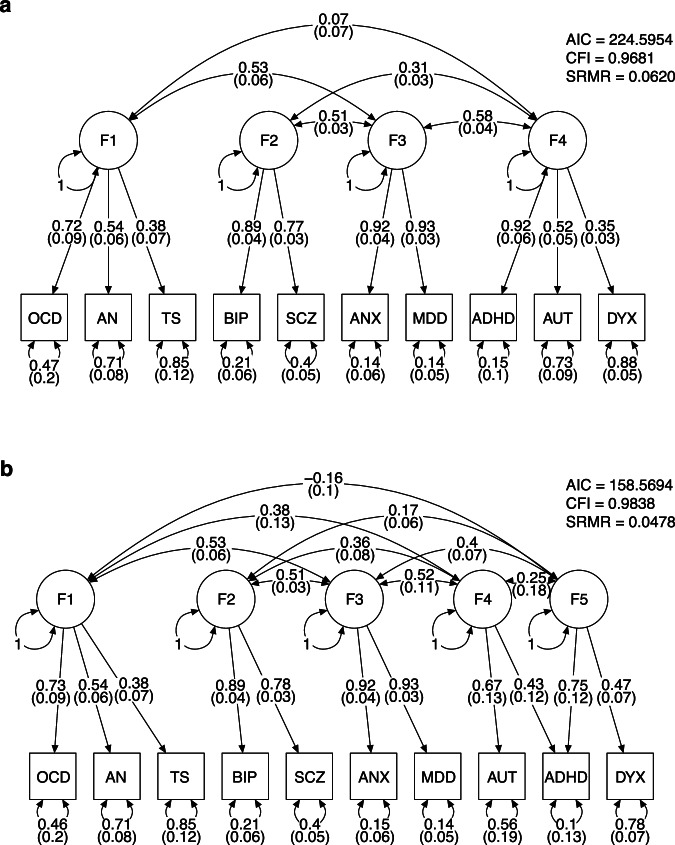
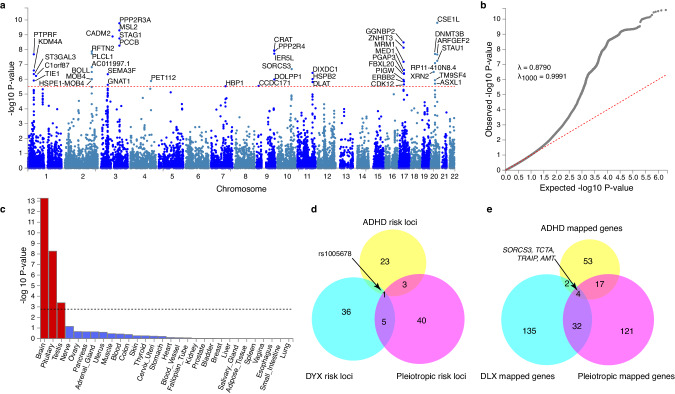
Dyslexia is a learning difficulty with neurodevelopmental origins, manifesting as reduced accuracy and speed in reading and spelling. It is substantially heritable and frequently co-occurs with other neurodevelopmental conditions, particularly attention deficit-hyperactivity disorder (ADHD). Here, we investigate the genetic structure underlying dyslexia and a range of psychiatric traits using results from genome-wide association studies of dyslexia, ADHD, autism, anorexia nervosa, anxiety, bipolar disorder, major depressive disorder, obsessive compulsive disorder, schizophrenia, and Tourette syndrome. Genomic Structural Equation Modelling (GenomicSEM) showed heightened support for a model consisting of five correlated latent genomic factors described as: F1) compulsive disorders (including obsessive-compulsive disorder, anorexia nervosa, Tourette syndrome), F2) psychotic disorders (including bipolar disorder, schizophrenia), F3) internalising disorders (including anxiety disorder, major depressive disorder), F4) neurodevelopmental traits (including autism, ADHD), and F5) attention and learning difficulties (including ADHD, dyslexia). ADHD loaded more strongly on the attention and learning difficulties latent factor (F5) than on the neurodevelopmental traits latent factor (F4). The attention and learning difficulties latent factor (F5) was positively correlated with internalising disorders (.40), neurodevelopmental traits (.25) and psychotic disorders (.17) latent factors, and negatively correlated with the compulsive disorders (-.16) latent factor. These factor correlations are mirrored in genetic correlations observed between the attention and learning difficulties latent factor and other cognitive, psychological and wellbeing traits. We further investigated genetic variants underlying both dyslexia and ADHD, which implicated 49 loci (40 not previously found in GWAS of the individual traits) mapping to 174 genes (121 not found in GWAS of individual traits) as potential pleiotropic variants. Our study confirms the increased genetic relation between dyslexia and ADHD versus other psychiatric traits and uncovers novel pleiotropic variants affecting both traits. In future, analyses including additional co-occurring traits such as dyscalculia and dyspraxia will allow a clearer definition of the attention and learning difficulties latent factor, yielding further insights into factor structure and pleiotropic effects.
© 2024. The Author(s).
Conflict of interest statement
Competing interests: PF and the 23andMe Research Team members are employed by and hold stock or stock options in 23andMe, Inc. All other authors declare no competing interests. Ethical approval: The study used secondary data, with all original studies stating relevant ethical approval. The secondary data analyses were approved under the Edinburgh Medical School Research Ethics Committee.
Figures

References
-
- American Psychiatric Association. Diagnostic and statistical manual of mental disorders: DSM-5™, 5th ed. Arlington, VA, US: American Psychiatric Publishing, Inc.; 2013.
-
- Rose J. Identifying and teaching children and young people with dyslexia and literacy difficulties: An independent report. 2009.
MeSH terms
Grants and funding
LinkOut - more resources
Full Text Sources
Medical
Miscellaneous
