. 2024 Jul 16;7(1):866.
doi: 10.1038/s42003-024-06562-2.

Facile metabolic reprogramming distinguishes mycobacterial adaptation to hypoxia and starvation: ketosis drives starvation-induced persistence in M. bovis BCG

Affiliations

Facile metabolic reprogramming distinguishes mycobacterial adaptation to hypoxia and starvation: ketosis drives starvation-induced persistence in M. bovis BCG

Nick K Davis et al. Commun Biol. .

Abstract

Mycobacteria adapt to infection stresses by entering a reversible non-replicating persistence (NRP) with slow or no cell growth and broad antimicrobial tolerance. Hypoxia and nutrient deprivation are two well-studied stresses commonly used to model the NRP, yet little is known about the molecular differences in mycobacterial adaptation to these distinct stresses that lead to a comparable NRP phenotype. Here we performed a multisystem interrogation of the Mycobacterium bovis BCG (BCG) starvation response, which revealed a coordinated metabolic shift away from the glycolysis of nutrient-replete growth to depletion of lipid stores, lipolysis, and fatty acid ß-oxidation in NRP. This contrasts with BCG's NRP hypoxia response involving a shift to cholesterol metabolism and triglyceride storage. Our analysis reveals cryptic metabolic vulnerabilities of the starvation-induced NRP state, such as their newfound hypersensitivity to H2O2. These observations pave the way for developing precision therapeutics against these otherwise drug refractory pathogens.


Conflict of interest statement

The authors declare no competing interests.

Figures

Fig. 1
Fig. 1. Characteristics of starved mycobacterial persisters.
a Survival profiles (OD600, CFU) of MTB, BCG, and SMG during nutrient deprivation in PBS. b Recovery of BCG after 4, 10, 20, or 30 days of starvation in PBS (S4, S10, S20, and S30, respectively) followed by 2 (white), 6 (gray), and 10 days (black) of resuscitation in nutrient-replete media; MTB after 20 days of starvation followed by 2 days (white) and 6 days (gray) of resuscitation; and SMG after 6 days of starvation followed by 9 h (white) and 24 h (black) of resuscitation. Doubling times are not significantly different by one-way ANOVA with post hoc Tukey's HSD. Data are shown as mean ± SE for n ≥ 3. c Reduction in total cellular RNA levels in BCG at S4, S10 and S20, with restoration at R6. d Transcriptional induction of the stringent response associated genes relBCG, relBE2, mazEF6, vapBC3, and vapBC31 in BCG, and repression of cell division marker ftsZ measured by RNA-seq. e Expression of relMTB in BCG measured by qPCR. f Antibiotic susceptibility of Log (◆), S4 (formula image), S10 (formula image), S20 (formula image), and R6 (formula image
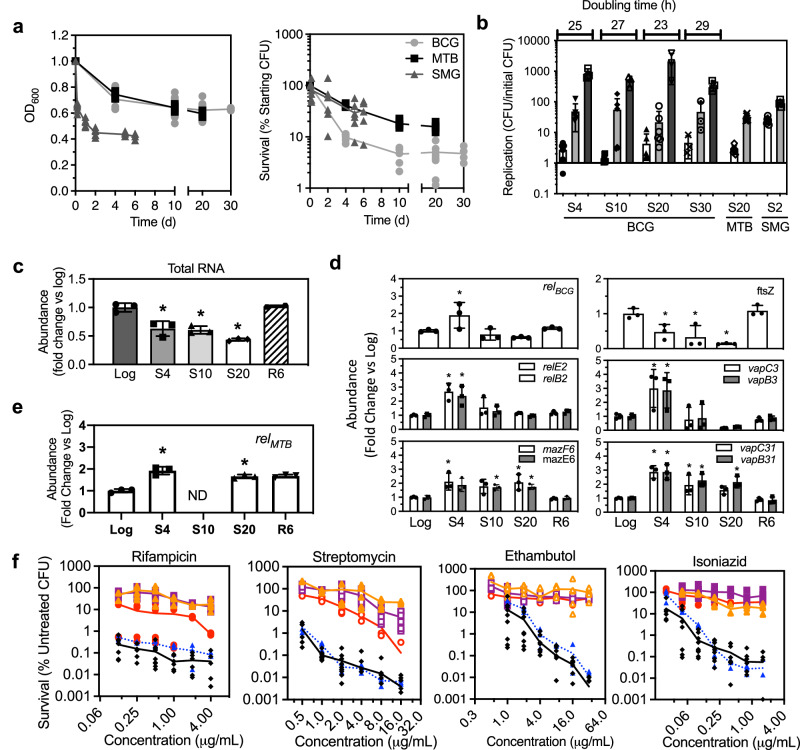
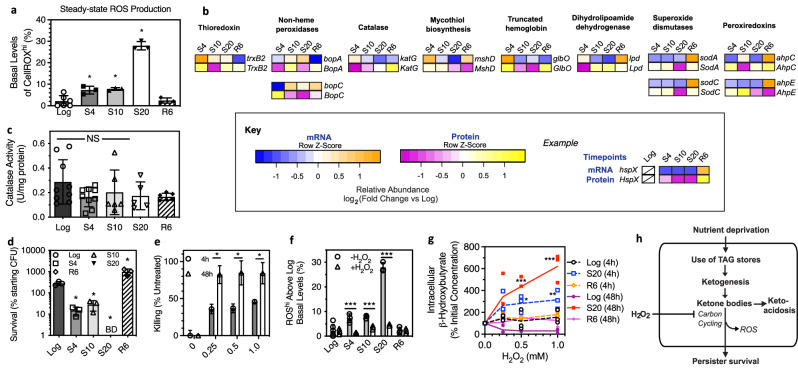
) BCG after 48 h of exposure. Data represent mean ± SD for n ≥ 6. ce Data represent mean ± SD for n ≥ 3; *P < 0.05 determined by one-way ANOVA with Dunnett's test vs. Log. See Supplementary Data 4 for the source data used in these graphs.
Fig. 2
Fig. 2. Functional gene responses are different between starvation- and hypoxia-induced NRP.
a Proteins detected and quantified across time-course proteomic analyses of starvation- (green circle: 1102 proteins) and hypoxia-induced (blue circle: 966 proteins) NRP. A total of 379 proteins were quantified across all time points in both conditions. b Principal component analysis reveals distinct protein dynamics during starvation (green ellipse: S4, S10, and S20) and hypoxia (blue ellipse: W4, W9, and W18) responses. Protein observations are color-coded according to the functional category, as follows: red = lipid metabolism (e.g., acetyl-CoA metabolism, β-oxidation); orange = cholesterol metabolism (e.g., propionyl-CoA metabolism); green = cell wall, virulence, detoxification and adaptation; blue = redox homeostasis; magenta = regulatory proteins and information pathways; yellow = replication and translation. c Major metabolic differences between starvation- and hypoxia-induced NRP informed by proteomic datasets. While co-catabolism of carbon substrates appears to be a shared feature of both stresses, starvation significantly induces the upregulation of proteins with known functions in fatty acid metabolism. On the other hand, hypoxia coordinately induces the upregulation of proteins with documented roles in the metabolism of cholesterol and odd-chain fatty acids (e.g., enzymes involved in the methylmalonyl-CoA pathway (MCP) and methylcitrate cycle (MCC)). Importantly, starvation significantly decreased and hypoxia increased levels of isocitrate lyase (Icl), the key enzyme in the glyoxylate shunt. OXO oxaloacetate, CIT citrate, αKG α-ketoglutamate, SUC succinate, FUM fumarate, MAL malate. dg Comparison of two-component system protein levels during hypoxia (red) and starvation (blue time courses. Plots contain individual log2(fold-change) data for 1–3 replicates, thick bars as mean values and thin bars as standard deviation on 0, 4, 9, and 19 days of hypoxia or starvation and after 6 days of resuscitation (R) with normoxia or nutrient restoration. Note: peptide signals for MtrB in hypoxia did not meet the cutoff criteria for proteomic quantitation but we have added the data in (e) for completeness. See Supplementary Data 4 for the source data used in these graphs.
Fig. 3
Fig. 3. Starvation induces shifts in lipid and ketone body metabolism.
a TAG content of BCG analyzed by densitometry of thin-layer chromatograms. N = 3; *P < 0.05; one-way ANOVA with Dunnett's test vs day 0. b Percentage of cells with elevated esterase activity (CFDAhi) during starvation and resuscitation. N = 6; two-way ANOVA with Bonferroni post tests, #P < 0.05 vs log; *P < 0.05 vs resuscitation day 0. c Hierarchical clustering analysis of the metabolic phenotype of Log, S4, S10, S20, and R6 BCG on carbon sources that induced growth. Heatmap denotes signals from tetrazolium dye reduction, reflecting carbon utilization relative to the positive control. d PCA bi-plot of PLS-DA scores and loadings of metabolic phenotype datasets (n = 3 per condition) based on carbon sources with significant dye reduction. Statistical analysis: one-way ANOVA with Bonferroni post test. The PLS-DA model is based on correlation coefficients between PCA scores (condition) and loadings (metabolite utilization) whereby proximity of the carbon source to the condition characterizes the condition. These predictors were used to successfully differentiate independent Log and S30 samples. e Intracellular β-hydroxybutyrate in Log, S20, and R6 cultures. N = 6; *P < 0.05; one-way ANOVA with Dunnett's test vs Log. (f) pH of BCG with nutrients or starved in PBS. Each symbol denotes the median pH of >50,000 cells; *P < 0.05; unpaired two-tailed t test with Welch’s correction. See Supplementary Data 4 for the source data used in these graphs.
Fig. 4
Fig. 4. A proposed metabolic pathway that links fatty acid β-oxidation to ketogenesis in starvation-induced NRP mycobacteria.
a Heatmaps show that starvation causes a coordinated transcriptional and translational upregulation of enzymes involved in fatty acid β-oxidation, with both transcription and translation downregulated upon resuscitation. The heatmap key is described below. This behavior underscores the importance of fatty acid metabolism for starvation-induced NRP in BCG. Upregulated lipQ, lipT, lipV, and lipY release fatty acids that are converted to fatty acid-CoA by fatty acid ligases (FadD; fadD8, fadD12, fadD35) as the entry point for β-oxidation. Subsequently, fatty acid oxidation is mediated by fadE7, fadE9, fadE27, and fadE35, 3-hydroxyl oxidation by BCG_3587, and hydration by echA5, echA7, and echA19, with the terminal thiolysis performed by fadA, fadA4, and fadA5. b Acetyl-CoA from fatty acid β-oxidation is then facilitates the starvation-induced increase in b-hydroybutryte (BHB; Fig. 3e). Starvation-upregulated ketothiolases (fadA, fadA4, fadA5) serve as acetyl-coA acetyltransferases to condense 2 acetyl-CoA molecules to acetoacetyl-CoA, which is converted to acetoacetate by upregulated succinyl-CoA:3-ketoacid-CoA transferase (scoA, scoB) and to BHB by upregulated 3-hydroxybutyrate dehydrogenase (BCG_1967c). Proteins levels for BCG_3587, ScoA, and ScoB were not quantified. Key: Relative transcript and proteins abundances are visualized after counts are normalized to their levels at Log (hence not visualized, crossed boxes) and log2 transformed. Heatmaps are used to represent mRNA (blue–orange scale) and protein (purple–yellow scale) levels at various time points (S4, S10, S20, and R6) in order with colors assigned based on their Z-scores across the time points. With yellow (protein) or orange (mRNA) for positive Z-scores and purple (protein) and blue (mRNA) for negative Z-scores. As an illustration, results for the chaperone HspX are shown. See Supplementary Data 4 for the source data used in these graphs.
Fig. 5
Fig. 5. Dysregulation of ROS defense genes presents a vulnerability to H2O2 in ketogenetic persisters.
a Starved BCG shows elevated levels of superoxide as detected by CellRox dye. Data represent the percentage of cells with elevated steady-state ROS production (CellROXhi) at different starvation time points. N ≥ 3; *P < 0.05; one-way ANOVA with Dunnett's test vs Log. b Heatmaps depicting transcriptional profiles and protein expressions for putative antioxidant response genes, showing a general lack of observable coordination between transcription and translation for these genes during starvation. c Catalase activity in Log, S4, S10, S20, and R6 cultures (n ≥ 6; *P > 0.05; one-way ANOVA with Dunnett's test vs Log). d Survival of BCG after 48 h of exposure to 0.5 mM H2O2. BD, below detection (1000 CFU). N = 6; *P < 0.05; one-way ANOVA with Bonferroni post test. e Killing of S20 BCG when exposed to H2O2. S20 cultures (25 mL of ~108 CFU/mL) were treated in 50 mL conical tubes at indicated H2O2 concentrations. N = 3; *P < 0.05, unpaired two-tailed t test with Welch’s correction. f Percentage of cells with elevated steady-state ROS levels (CellROXhi) following 4 h of mock or 0.5 mM H2O2 exposure. N = 8; *P < 0.05; unpaired, two-tailed t test of treatment groups with Welch’s correction. g Intracellular β-hydroxybutyrate levels in Log, S20, and R6 cells after 4 and 48 h of H2O2 exposure. N ≥ 3; *P < 0.05; two-way ANOVA with Bonferroni post tests comparing cell state and H2O2 dose. h Model of starvation-induced ketosis depicting conserved vulnerability of starved persisters to H2O2 blocking ketone body metabolism and thus carbon cycling for NRP survival. See Supplementary Data 4 for source data used in these graphs.

References

    1. Organization, W. H. Global Tuberculosis Report 2018. Report No. 978-92-4-156564-6, (World Health Organization, Geneva, 2018).
    1. Ernst JD. The immunological life cycle of tuberculosis. Nat. Rev. Immunol. 2012;12:581–591. doi: 10.1038/nri3259. - DOI - PubMed
    1. Maisonneuve E, Gerdes K. Molecular mechanisms underlying bacterial persisters. Cell. 2014;157:539–548. doi: 10.1016/j.cell.2014.02.050. - DOI - PubMed
    1. Cole ST, et al. Deciphering the biology of Mycobacterium tuberculosis from the complete genome sequence. Nature. 1998;393:537–544. doi: 10.1038/31159. - DOI - PubMed
    1. Boritsch EC, et al. pks5-recombination-mediated surface remodelling in Mycobacterium tuberculosis emergence. Nat. Microbiol. 2016;1:15019. doi: 10.1038/nmicrobiol.2015.19. - DOI - PubMed

Publication types