. 2024 Jul;6(7):1329-1346.
doi: 10.1038/s42255-024-01083-y. Epub 2024 Jul 15.

Reduced adipocyte glutaminase activity promotes energy expenditure and metabolic health

Affiliations

Reduced adipocyte glutaminase activity promotes energy expenditure and metabolic health

Simon Lecoutre et al. Nat Metab. 2024 Jul.

Abstract

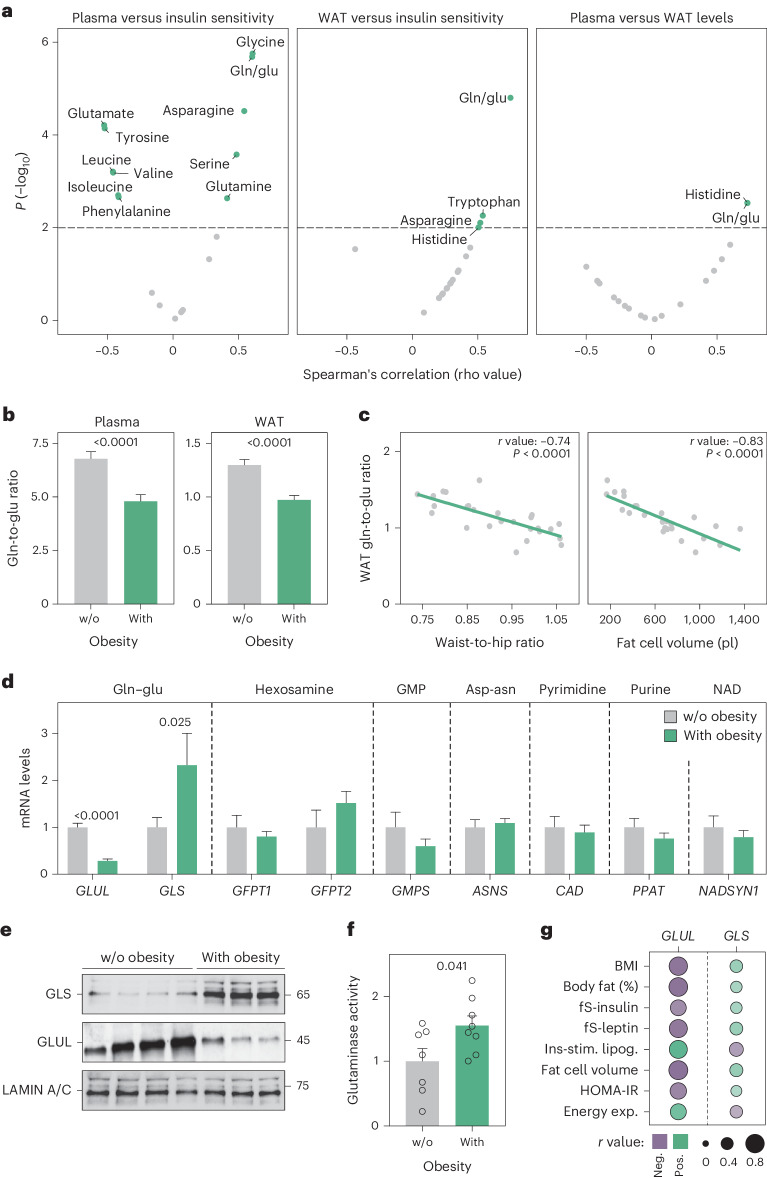
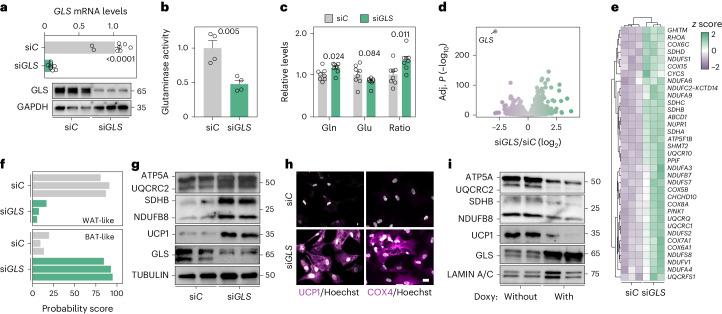
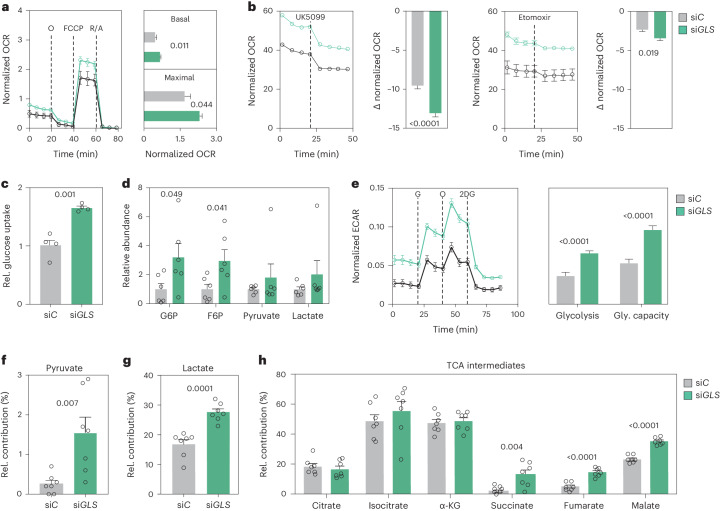
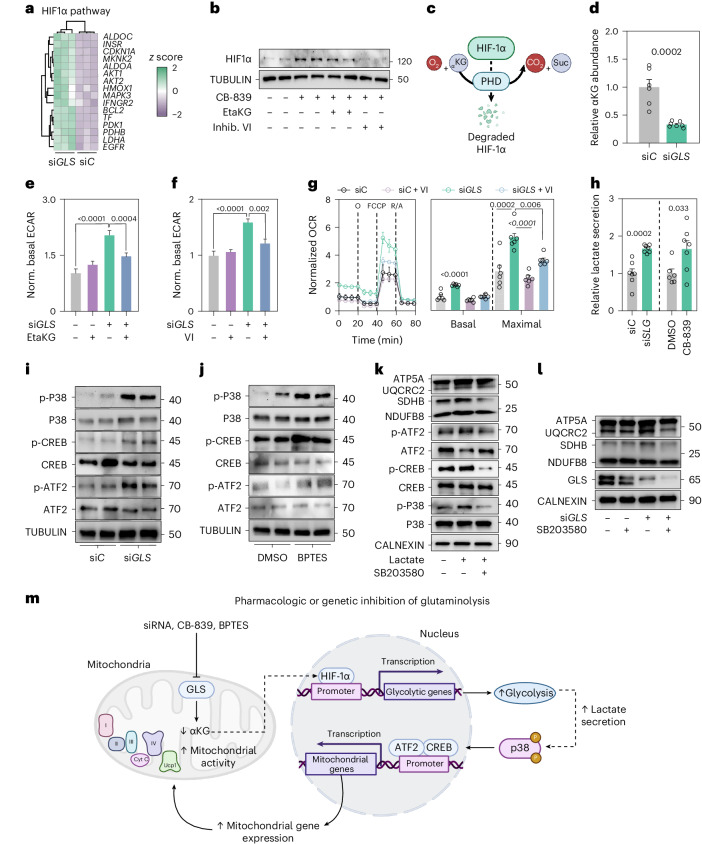
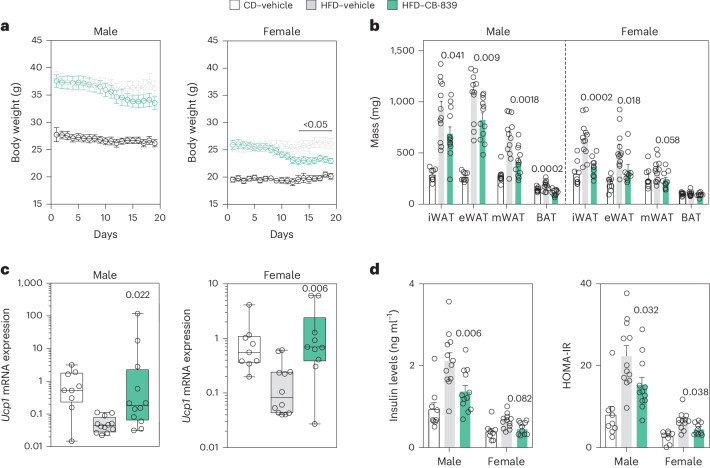
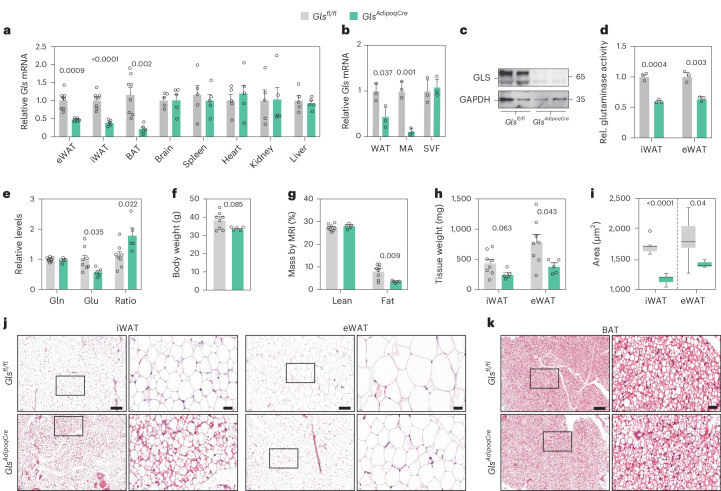
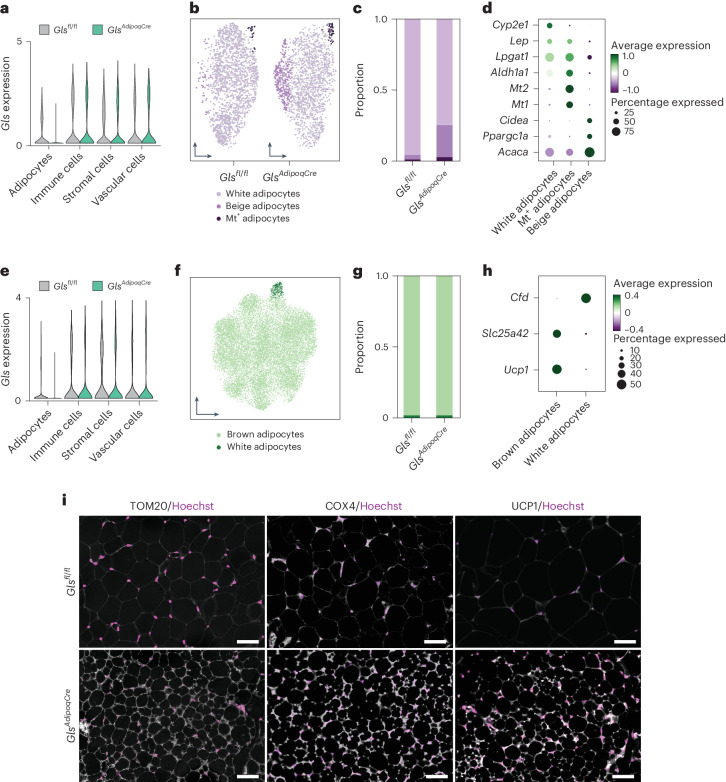
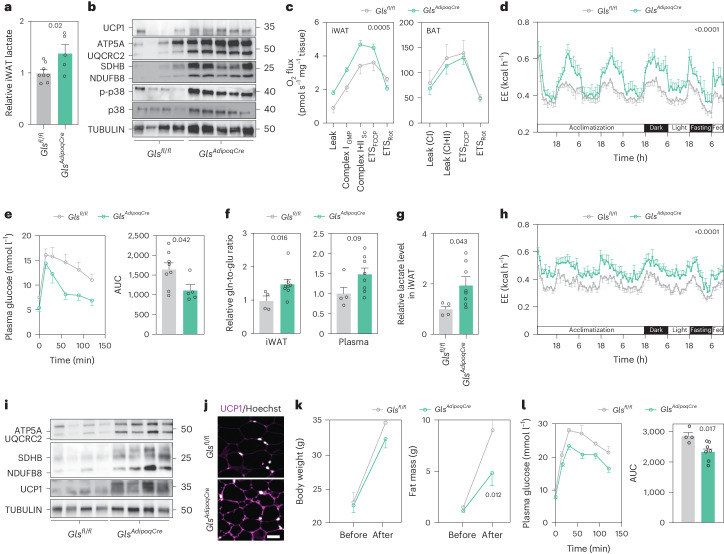
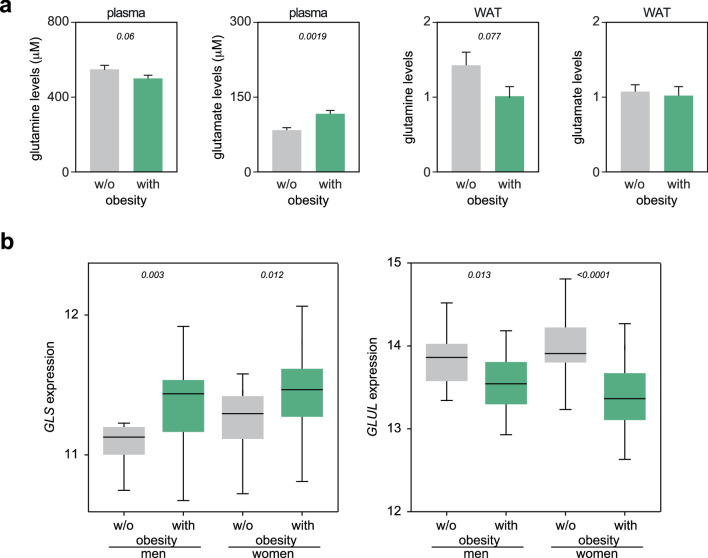
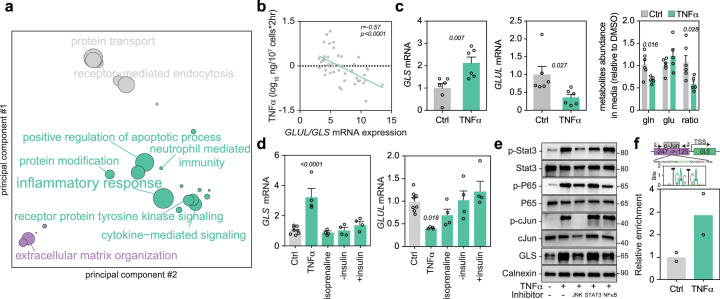
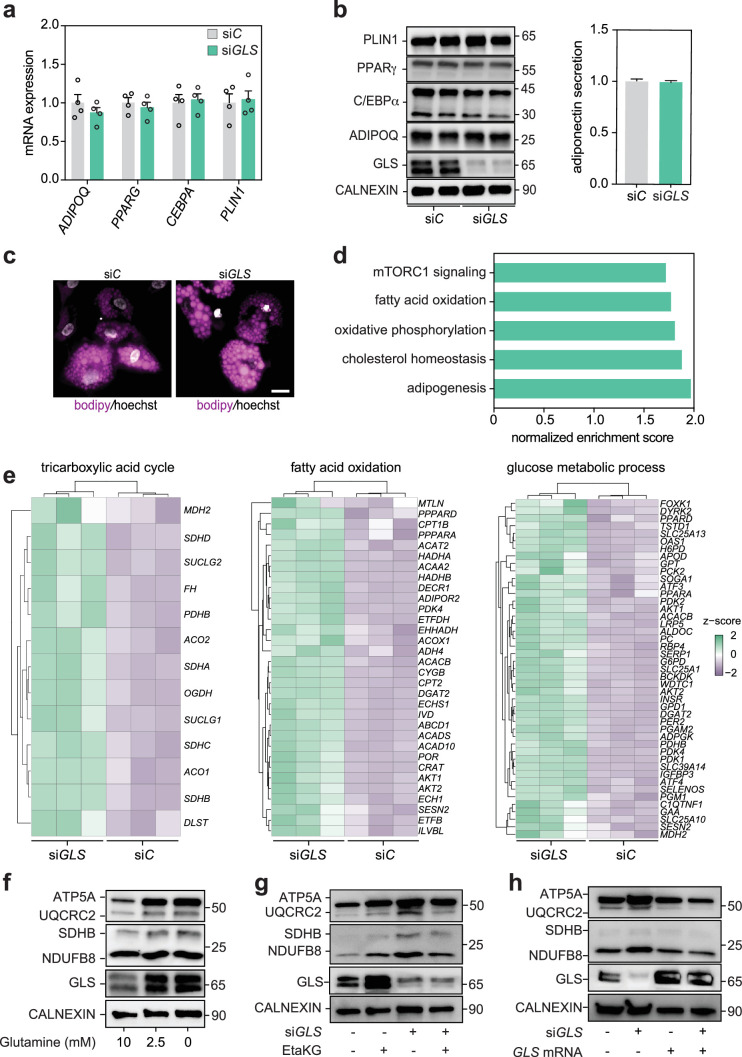
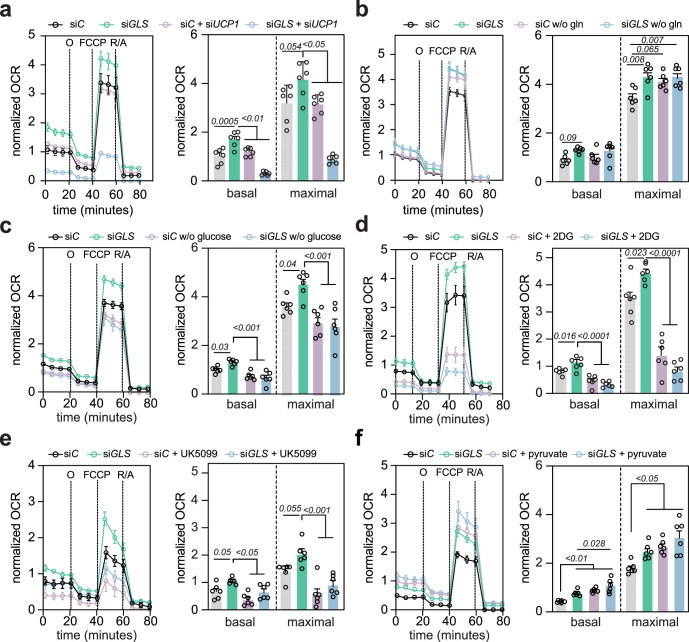
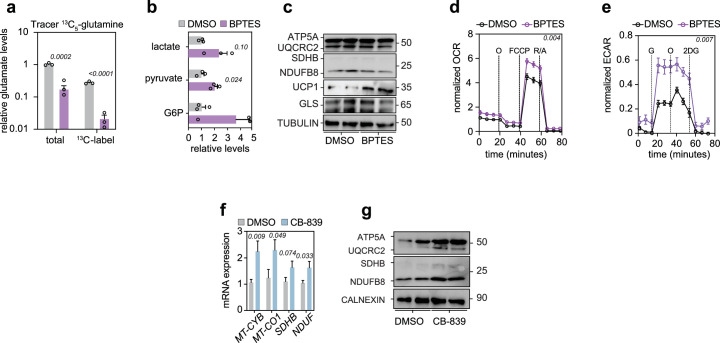
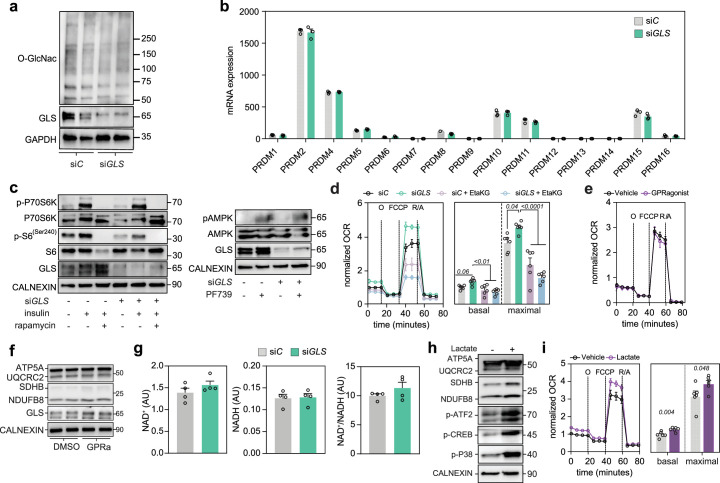
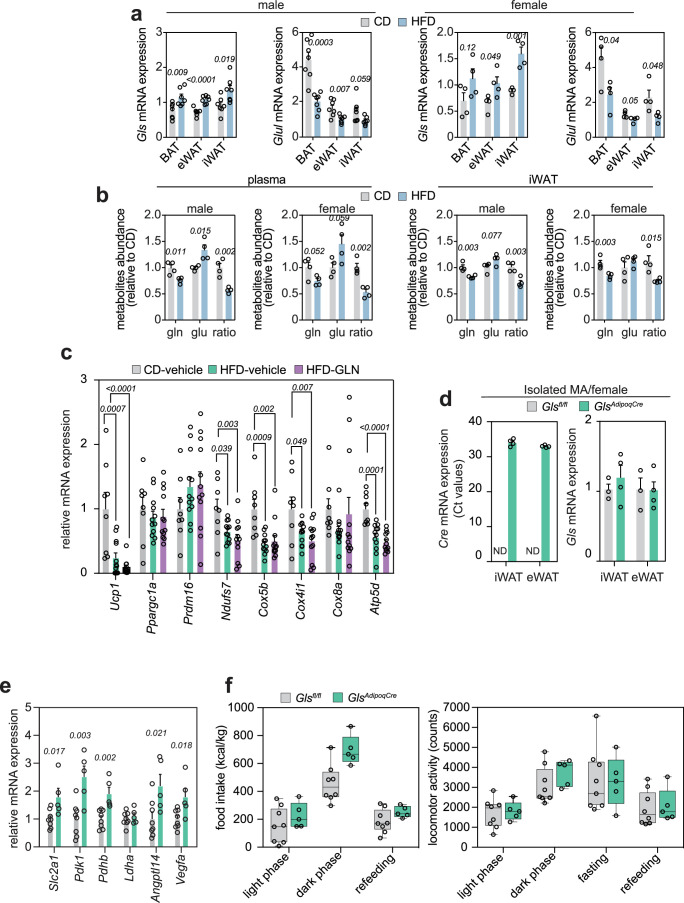
Glutamine and glutamate are interconverted by several enzymes and alterations in this metabolic cycle are linked to cardiometabolic traits. Herein, we show that obesity-associated insulin resistance is characterized by decreased plasma and white adipose tissue glutamine-to-glutamate ratios. We couple these stoichiometric changes to perturbed fat cell glutaminase and glutamine synthase messenger RNA and protein abundance, which together promote glutaminolysis. In human white adipocytes, reductions in glutaminase activity promote aerobic glycolysis and mitochondrial oxidative capacity via increases in hypoxia-inducible factor 1α abundance, lactate levels and p38 mitogen-activated protein kinase signalling. Systemic glutaminase inhibition in male and female mice, or genetically in adipocytes of male mice, triggers the activation of thermogenic gene programs in inguinal adipocytes. Consequently, the knockout mice display higher energy expenditure and improved glucose tolerance compared to control littermates, even under high-fat diet conditions. Altogether, our findings highlight white adipocyte glutamine turnover as an important determinant of energy expenditure and metabolic health.


Conflict of interest statement

The authors declare no competing interests.

Figures

Fig. 1
Fig. 1. Adipose glutaminolysis is increased in obesity-induced insulin resistance.
a, Correlations between amino acid levels in plasma and insulin sensitivity (left), amino acid levels in WAT and insulin sensitivity (middle) and between amino acid levels in plasma (n = 53) and WAT (n = 26) (right) in cohort 1. Insulin sensitivity was measured by hyperinsulinaemic euglycaemic clamp expressed as glucose disposal rate corrected for mean plasma insulin levels at steady state (M/I). Associations were calculated using Spearman’s rank correlation. b, The plasma (n = 53) (left) and WAT (n = 26) (right) glutamine-to-glutamate (gln to glu) ratios in cohort 1 comparing women living without (w/o) or with obesity (BMI ≥ 30 kg m−2). Groups were compared using Student’s t-test. c, The correlation between WAT glutamine-to-glutamate ratios and waist-to-hip ratio (left) or fat cell volume (right) in cohort 1 (n = 26). Pearson’s correlation coefficients are shown. d, Expression of genes encoding glutamine–glutamate (gln–glu) metabolizing proteins measured by qPCR in isolated fat cells from cohort 2. Results are displayed according to biological pathways and compared for people living w/o (n = 12) or with (n = 16) obesity. Groups were compared using Student’s t-test or the Mann–Whitney U-test, depending on the distribution. e, Protein levels of GLS and GLUL in subcutaneous white adipocytes from participants living w/o (n = 4) or with (n = 3) obesity (cohort 2). Proteins derived from the same samples were loaded on two different gels. f, GLS activity in subcutaneous adipocytes from participants living w/o (n = 7) or with (n = 8) obesity in cohort 2. Groups were compared using Student’s t-test. g, Correlations between indicated clinical and adipocyte parameters and GLUL or GLS expression in bulk transcriptomic data of subcutaneous WAT from cohort 3 (n = 56). All correlations were significant (P < 0.05), circle sizes are proportional to the Pearson’s correlation coefficient and the colour indicates positive (pos.) (green) or negative (neg.) (purple) associations. Data in b, d and f show mean ± s.e.m. Relevant P values are shown. asp-asn, aspartate to asparagine conversion; energy exp., energy expenditure by indirect calorimetry corrected for body weight (kcal kg−1 day−1); GMP, guanosine monophosphate; ins-stim. lipog., log10 maximal insulin-stimulated lipogenesis in isolated mature fat cells. Source data
Fig. 2
Fig. 2. Reduced GLS activity promotes thermogenic gene expression in adipocytes.
a, GLS mRNA and protein levels in human adipocytes transfected with non-silencing (siC) or GLS-targeting (siGLS) oligonucleotides. Data for mRNA are expressed relative to siC and were compared using Student’s t-test (eight replicates per condition, repeated more than three times). A representative western blot of GLS protein is shown (repeated more than three times). GAPDH was used as a loading control. b,c, Comparisons of siC and siGLS adipocytes displaying GLS enzyme activity (four replicates per condition, repeated more than three times) (b) and glutamine (gln) and glutamate (glu) levels including glutamine-to-glutamate ratio (eight replicates per condition, repeated more than three times) (c). Data were compared using Student’s t-test. d,e, RNA sequencing data comparing siC and siGLS-treated human adipocytes (three replicates per condition). Data are presented as a volcano plot of all genes (d) and a heatmap of changes in the expression of cellular respiration genes (e). f, Probability of BAT- or WAT-like transcriptomic profiles in human adipocytes transfected with siC or siGLS oligonucleotides. The score is based on ProFAT, which quantifies the thermogenic potential from gene expression datasets. g, ETC, uncoupling protein 1 (UCP1) and GLS protein levels in human adipocytes transfected with siC or siGLS oligonucleotides (repeated more than three times). Proteins from the same experiment were loaded on three different gels run in parallel. h, Representative images of UCP1 and cytochrome C oxidase (COX4) immunofluorescence in human adipocytes transfected with siC or siGLS oligonucleotides (repeated three times). Scale bar, 20 μm. i, Representative examples of GLS, ETC, UCP1 and LAMIN A/C protein levels in human adipocytes engineered to overexpress GLS on doxycycline (doxy) incubation. Data show comparisons of non-induced versus induced cells (repeated twice). Data ac show mean ± s.e.m. Relevant P values are shown. Source data
Fig. 3
Fig. 3. Adipocyte GLS inhibition promotes glucose utilization and oxidative metabolism.
a, OCRs during mitostress tests in siC (black) or siGLS (green) human adipocytes (left). Data (12 replicates per condition, experiment repeated at least three times) were compared for basal respiration and maximal respiratory capacity using Student’s t-test (right). b, Metabolic fuel flex tests in siC or siGLS human adipocytes. Data (12 replicates per condition from more than three experiments) displaying the drop in OCR from baseline after drug injection (UK5099 in left or etomoxir in right) were calculated and compared using Student’s t-test. c, Glucose uptake in human adipocytes transfected with siC or siGLS (four replicates per condition, repeated twice). Data were compared using Student’s t-test. d, Intracellular levels of glucose-6-phosphate (G6P), fructose-6-phosphate (F6P), pyruvate and lactate in human adipocytes transfected with siC or siGLS (six replicates per condition). Data were compared using Student’s t-test. e, ECAR during glycostress tests in siC or siGLS human adipocytes (left). Data (12 replicates per condition, repeated more than three times) were compared for glycolysis and glycolytic (gly.) capacity (right) using Student’s t-test. fh, Glucose-13C incorporation in pyruvate (f), secreted lactate (g) and TCA intermediates (h) in human adipocytes transfected with siC or siGLS (seven replicates per condition). Data were compared using Student’s t-test. Data in all panels show mean ± s.e.m. Relevant P values are shown. 2DG, 2-deoxy-d-glucose; α-KG, alpha-ketoglutarate; FCCP, carbonyl cyanide-4-(trifluoromethoxy)phenylhydrazone; G, glucose; norm., normalized; O, oligomycin; R/A, rotenone/antimycin A; rel., relative. Source data
Fig. 4
Fig. 4. HIF1α promotes glycolysis following adipocyte GLS depletion.
a, Heatmap of HIF1α target genes altered in siGLS versus siC treated human adipocytes (three replicates per condition). b, Effects of CB-839 in human adipocytes on protein levels of HIF1α. Effects of eta-ketoglutarate (EtaKG) or the HIF1α inhibitor VI (Inhib. VI) are shown (repeated twice). c, Illustration of how alpha-ketoglutarate (α-KG) degrades HIF1α through prolyl hydroxylase domain (PHD) proteins. d, Relative levels of α-KG in siGLS (n = 7) versus siC (n = 6) human adipocytes (repeated twice). Data were compared using Student’s t-test. e, Normalized (norm.) basal ECAR during glycostress tests in siC or siGLS human adipocytes treated with EtaKG (11 replicates per condition, repeated twice). Data were compared using two-way analysis of variance (ANOVA) and Tukey’s post hoc test. f, Normalized basal ECAR rate during glycostress tests in siC or siGLS human adipocytes treated with the HIF1α inhibitor VI (12 replicates per condition, repeated twice). Data were compared using two-way ANOVA and Tukey’s post hoc test. g, Normalized OCR in siC or siGLS human adipocytes treated with or without the HIF1α inhibitor VI (left) (six replicates per condition, repeated two times). Data were compared for basal respiration and maximal respiratory capacity using two-way ANOVA and Tukey’s post hoc test (right). h, Lactate secretion in human adipocytes transfected with siC (n = 7) or siGLS (n = 7) (left) or treated with DMSO (n = 6) or CB-839 (n = 7) (right). Data were compared using Student’s t-test (repeated more than three times). i,j, Representative western blots of total and phosphorylated protein levels of p38 MAPK, CREB and ATF2 in human adipocytes transfected with siC or siGLS (i) or incubated with DMSO or BPTES (j, repeated twice). Proteins from the same experiment were loaded on four different gels in parallel for i,j. k, Representative western blots of total and phosphorylated protein levels of p38 MAPK, ATF2 as well as ETC proteins in human adipocytes incubated with or without lactate (for 30 min) and the p38 MAPK inhibitor SB203580 (pretreatment for 2.5 h) (repeated twice), Proteins from the same experiment were loaded on five different gels in parallel. l, Representative western blot showing the ETC and GLS protein levels in siC or siGLS human adipocytes treated with or without the p38 MAPK inhibitor SB203580 (experiment repeated twice). m, Model of how inhibition of glutaminolysis drives a metabolic reprograming promoting adipocyte thermogenesis. Data dh show mean ± s.e.m. Relevant P values are shown. c,m, Created with BioRender.com. Source data
Fig. 5
Fig. 5. Pharmacological Gls inhibition in male and female mice reduces fat mass and induces adipocyte Ucp1 expression in inguinal WAT.
a, Body weight changes in male and female mice fed chow (CD) (n = 9 for each gender) or a HFD, treated either with vehicle (n = 12 for each gender) or with 200 mg kg−1 of CB-839 (n = 12 males and n = 10 females) administered daily by gavage for 19 days. Data were analysed by two-way ANOVA and Tukey’s post hoc test. b, The weights of one pad out of the two pads of inguinal (iWAT), one pad out of the two pads of epigonadal (eWAT) and mesenteric (mWAT) WAT as well as BAT were measured in the male and female mice described in a. Data were analysed by one-way ANOVA and Tukey’s post hoc test. c, Ucp1 gene expression profiles were analysed in iWAT samples obtained from the male and female mice described above. Data are presented as min–max (median) and were compared using non-parametric (Kruskal–Wallis) one-way ANOVA. d, The circulating levels of insulin were measured and the Homeostatic Model Assessment-Insulin Resistance (HOMA-IR) index was calculated in male and female mice fed CD (n = 9 males and n = 8 females) or HFD, treated either with vehicle (n = 12 for each gender) or with CB-839 (n = 12 males and n = 10 females) as described above. Data were analysed by one-way ANOVA and Dunnett’s post hoc test. Data in b and d show mean ± s.e.m. The P values are displayed only for the comparison between HFD treated with either vehicle or CB-839. Source data
Fig. 6
Fig. 6. Adipocyte Gls depletion promotes a browning phenotype in inguinal WAT.
a, Gls mRNA expression in adipose depots and different organs from Glsfl/fl (n = 8 for adipose tissues (iWAT, eWAT and BAT) and n = 5 for other organs) and GlsAdipoqCre (n = 5) mice. b, Gls mRNA expression in intact WAT, mature adipocytes (MA) and the stromal vascular fraction (SVF) in the two genotypes (n = 3 per condition). c, Gls protein expression in mature adipocytes isolated from iWAT of Glsfl/fl and GlsAdipoqCre mice (two mice per condition). d, GLS activity in iWAT and eWAT of Glsfl/fl and GlsAdipoqCre mice (n = 3 per condition). e, Data from mice in a displaying the levels of glutamine (gln), glutamate (glu) and the glutamine-to-glutamate ratio in iWAT of Glsfl/fl (n = 8) and GlsAdipoqCre (n = 5) mice. f, Body weight of Glsfl/fl (n = 8) and GlsAdipoqCre (n = 5) mice. g, Fat and lean body mass determined by magnetic resonance imaging (MRI) in Glsfl/fl (n = 8) and GlsAdipoqCre (n = 5) mice. h, Weight of iWAT and eWAT of Glsfl/fl (n = 8) and GlsAdipoqCre (n = 5) mice. i, Fat cell size of iWAT and eWAT (five mice per condition) measured as described in the Methods. Boxplots display the median and the 1.5× IQR method is used to determine the length of the whiskers. j, Representative haematoxylin and eosin staining of iWAT and eWAT with a specified area magnified (to the right of each image). Scale bars represent 100 μm for the images and 20 μm in the magnified areas. k, Representative haematoxylin and eosin staining of BAT with a determined area magnified (to the right side of the images). Scale bars same as in j. a,b and dh show mean ± s.e.m. Data in a, b and di were compared using Student’s t-test. Relevant P values are shown. eWAT, epigonadal WAT; iWAT, inguinal WAT; Rel., relative. Source data
Fig. 7
Fig. 7. Subclustering of mouse adipocytes identifies a distinct beige subpopulation within the iWAT of GlsAdipoqCre mice.
a, Gls gene expression for each cell population in the single-nucleus RNA sequencing dataset from inguinal WAT (iWAT) of Glsfl/fl and GlsAdipoqCre mice (n = 5 for each genotype). b, UMAP projection of adipocytes in iWAT of Glsfl/fl and GlsAdipoqCre mice. c, Proportion of adipocyte subpopulations in iWAT of Glsfl/fl and GlsAdipoqCre mice. d, Top marker genes across the three identifiable subpopulations in iWAT presented in a dot plot where circle sizes and colours are proportional to the detection rate and expression of the marker genes, respectively. e, Gls gene expression for each cell population in the single-nucleus RNA sequencing dataset from BAT of Glsfl/fl and GlsAdipoqCre mice. f, UMAP projection of adipocytes in BAT. g, Proportion of adipocyte subpopulations in BAT of Glsfl/fl and GlsAdipoqCre mice. h, Ucp1, Slc25a42 and Cfd mRNA expression of brown adipocyte and inguinal white adipocyte of Glsfl/fl and GlsAdipoqCre mice. i, Representative microphotographs of iWAT displaying immunofluorescence signal of TOM20, COX4 and UCP1 protein in Glsfl/fl and GlsAdipoqCre mice. Hoechst was used to stain nuclei. Scale bars, 50 μm. COX4, cytochrome C oxidase subunit; Cfd, complement factor D; Mt, metallothionein 1A; Slc25a42, solute carrier family 25 member 42; TOM20, translocase of outer mitochondrial membrane 20; UMAP, uniform manifold approximation and projection. Source data
Fig. 8
Fig. 8. Loss of GLS in adipose tissue promotes mitochondrial activity and protects mice against obesity.
a, Lactate levels in inguinal WAT (iWAT) from Glsfl/fl (n = 8) and GlsAdipoqCre (n = 5) mice on a chow diet. b, UCP1, ETC, total and phosphorylated p38 MAPK protein levels in iWAT from Glsfl/fl and GlsAdipoqCre mice fed chow diet. Proteins from the same samples were loaded on three different gels. c, High-resolution respirometry showing O2 consumption in iWAT (left) and BAT (right) from Glsfl/fl and GlsAdipoqCre mice fed chow diet. Data (n = 5 for iWAT and n = 3 for BAT in Glsfl/fl, and n = 5 for iWAT and n = 4 for BAT in GlsAdipoqCre) were compared using two-way ANOVA. d, Energy expenditure (EE) in Glsfl/fl (n = 8) and GlsAdipoqCre (n = 5) mice fed chow diet measured in metabolic cages. Data were analysed by two-way ANOVA (mixed-effects analysis). e, Data from intraperitoneal glucose tolerance test in Glsfl/fl (n = 8) and GlsAdipoqCre (n = 5) mice fed chow diet. The area under the curve (AUC) is displayed in the right-hand panel. f, Glutamine-to-glutamate ratio in iWAT (left) and plasma (right) from Glsfl/fl (n = 4) and GlsAdipoqCre (n = 8) mice following 8 weeks of HFD. Data were compared using Mann–Whitney test for the left panel and Student’s t-test for the right panel. g, Lactate levels in iWAT from Glsfl/fl (n = 4) and GlsAdipoqCre (n = 8) mice fed HFD. h, Energy expenditure in Glsfl/fl (n = 4) and GlsAdipoqCre (n = 8) mice fed HFD. Data were analysed by two-way ANOVA (mixed-effects analysis). i, UCP1 and ETC protein levels in iWAT from Glsfl/fl and GlsAdipoqCre mice fed HFD (four mice per condition). j, Representative microphotographs of UCP1 immunofluorescence in iWAT from Glsfl/fl and GlsAdipoqCre mice fed HFD. Hoechst was used to stain nuclei. Scale bar, 50 μm. k, Body weight and fat mass determined by magnetic resonance imaging in Glsfl/fl (n = 4) and GlsAdipoqCre (n = 8) mice before and after HFD. Data were analysed by two-way ANOVA and Bonferroni’s post hoc test. l, Data from intraperitoneal glucose tolerance test in Glsfl/fl (n = 4) and GlsAdipoqCre (n = 7) mice after 7 weeks of HFD. The AUC is displayed in the right panel. Data in a, ch and kl show mean ± s.e.m. Data in a, e, g and l were compared using Student’s t-test. Relevant P values are shown. Source data
Extended Data Fig. 1
Extended Data Fig. 1. Glutamine turnover is altered in WAT of men and women with obesity.
a. Plasma (n = 53, the two panels to the left) and subcutaneous white adipose tissue (n = 26, the two panels to the right) glutamine and glutamate levels compared between individuals living with or without (w/o) obesity. The log values of glutamine levels in WAT and plasma have previously been published in. Data were analyzed by Student’s t-test or the Mann-Whitney U test, depending on the distribution, and p values are shown. Error bars are S.E.M. b. Results from publicly available RNA-seq data (GSE95640) summarizing the expression of GLS (left panel) and GLUL (right panel) in subcutaneous white adipose tissue from men living with (n = 55) or w/o obesity (n = 10) and women living with (n = 101) or w/o (n = 14) obesity. Data were analyzed by Wilcoxon rank sum test and p values are shown. Box plots display min, max, and median. Source data
Extended Data Fig. 2
Extended Data Fig. 2. TNFα promotes glutaminolysis in white adipocytes.
a. Pathway analysis of genes positively associated with GLS mRNA expression and negatively associated with GLUL mRNA expression. The size of the dots is proportional to the Gene Set Enrichment Analysis score. b. Correlation between GLUL/GLS mRNA expression and TNFα secretion ex vivo in human subcutaneous adipose tissue in cohort 3 (n = 45). r- and p values are shown for correlation using simple Pearson´s regression analysis. c. Freshly isolated human adipocytes were cultured with or without TNFα for 24 hrs. Analyses of gene expression by qPCR (six replicates per condition, repeated >three times) (left) and glutamine and glutamate levels including glutamine-to-glutamate ratio (six and five replicates per condition) in conditioned media (right) were performed. Data were analyzed by Student’s t-test and p values are shown. d. Analyses of gene expression by qPCR in human adipocytes incubated with vehicle (n = 8), TNFα (n = 4), isoprenaline (n = 4) or insulin (n = 4). Data were compared using one-way ANOVA with Dunnett’s post-hoc test and p values are shown (experiment repeated >three times). e. Representative examples of protein levels of GLS and the inflammatory pathways induced by TNFα (JNK, STAT3 and NFκB) in human adipocytes incubated with TNFα for four hours with or without inhibitors of each pathway (repeated two times). Proteins from the same samples were loaded on three different gels in parallel. f. Chromatin immunoprecipitation followed by qPCR analysis showing that c-Jun binds to the human GLS promoter. Complexes containing c-Jun were immunoprecipitated from cross-linked and digested chromatin isolated from human adipocytes incubated with PBS or TNFα. Following reversal of cross-links and purification of DNA, qPCR was run using primers designed to amplify a 196-bp fragment centered around the putative c-Jun binding site at position −247 to −125 bp relative to the transcriptional start site (TSS). The data presented are the relative quantity values from independent duplicate reactions. Data in panels c-d show mean ± S.E.M. Abbreviations: TNFα = Tumor necrosis factor alpha, TG = triglycerides, -insulin = cells deprived from insulin for 24 hours, +insulin = insulin treatment for six hours, isoprenaline = isoprenaline treatment for six hours. Source data
Extended Data Fig. 3
Extended Data Fig. 3. GLS depletion promotes metabolic gene programs independently of effects on adipogenesis.
a-c. In vitro differentiated human adipocytes were transfected with siC or siGLS. Effects on (a) gene expression (four replicates per condition, repeated >three times), (b) protein abundance (repeated twice) of adipogenic markers (left) and adiponectin secretion (in total sixteen replicates per condition from two independent experiments) (right) and (c) lipid droplet morphology (repeated >three times) were determined. Scale bar in panel c = 20 μm. Proteins from the same samples were loaded on four different gels in parallel. d. Gene set enrichment analysis listing the top five pathways altered in siGLS vs. siC human adipocytes. e. Heatmaps of indicated pathways and genes altered in siGLS vs. siC treated human adipocytes. f. Representative examples of electron transport chain (ETC) protein levels in human adipocytes incubated with 0, 2.5 and 10 mmol/L of glutamine. Cells were either deprived or treated with indicated concentrations of glutamine for 48 hours (repeated three times). Proteins from the same samples were loaded on two different gels in parallel. g. Representative examples of ETC protein levels in human adipocytes transfected with siC or siGLS oligonucleotides incubated with or without eta-ketoglutarate (EtaKG, repeated three times). h. Representative examples of ETC protein levels in human adipocytes transfected with siC or siGLS oligonucleotides and with scrambled mRNA or over expressing GLS mRNA. (repeated two times). Error bars in panels a-b are S.E.M. Abbreviations: ADIPOQ = adiponectin, BODIPY = boron-dipyrromethene, CEBPA = CCAAT/enhancer-binding protein alpha, PLIN1 = Perilipin 1, PPARG = peroxisome proliferator-activated receptor gamma. Source data
Extended Data Fig. 4
Extended Data Fig. 4. Glycolytic activity drives oxygen consumption rates following GLS depletion.
a. Oxygen consumption rates (OCR) during mitostress tests in siC or siGLS human adipocytes co-transfected with siC or siUCP1 (left). Data (six replicates per condition, repeated two times) were compared for basal and maximal respiratory capacity. Results were compared using two-way ANOVA and Tukey’s post-hoc test and p values are shown (right). b. OCR during mitostress tests in siC or siGLS human adipocytes incubated with or without glutamine for 48 hours (left). Data were compared for basal and maximal respiratory capacity. Results were compared using two-way ANOVA and Tukey’s post-hoc test and the p value is shown (right) (six replicates per condition, repeated three times). c. OCR during mitostress tests in siC or siGLS human adipocytes (left) incubated with or without glucose. Data were compared for basal and maximal respiratory capacity. Results were compared using two-way ANOVA and Tukey’s post-hoc test and p values are shown (right) (six replicates per condition, repeated two times). d. OCR during mitostress tests in siC or siGLS human adipocytes (left) incubated with or without 2-deoxy-D-glucose (2DG). Data were compared for basal and maximal respiratory capacity. Results were compared using two-way ANOVA and Tukey’s post-hoc test and p values are shown (right) (six replicates per condition, repeated two times). e. OCR during mitostress tests in siC or siGLS human adipocytes (left) incubated with or without UK5099. Data (repeated two times) were compared for basal and maximal respiratory capacity. Results were compared using two-way ANOVA and Tukey’s post-hoc test and p values are shown (right) (six replicates per condition, repeated two times). f. OCR during mitostress tests in siC or siGLS human adipocytes (left) incubated with or without sodium pyruvate. Data (repeated two times) were compared for basal and maximal respiratory capacity. Results were compared using two-way ANOVA and Tukey’s post-hoc test and p values are shown (right) (six replicates per condition, repeated two times). Data in all panels show mean ± S.E.M. Abbreviations: FCCP = carbonylcyanide-p-trifluoromethoxyphenylhydrazone, O = oligomycin, R/A = rotenone/antimycin A. Source data
Extended Data Fig. 5
Extended Data Fig. 5. Pharmacologic inhibition of GLS induces oxidative activity.
a. Effects of BPTES on glutamate labeling using 13C-labeled glutamine (three replicates per condition). b-e. Effect of BPTES on (b) glucose-6-phosphate (G6P), pyruvate and lactate levels, (c) electron transport chain, UCP1 and GLS protein levels (three replicates per condition), (d) oxygen consumption rates (OCR) (six replicates per condition, repeated >three times) and (e) extracellular acidification rates (ECAR) in human adipocytes (six replicates per condition, repeated three times). In panel c, the proteins from the same samples were loaded on two different gels in parallel. f. Effects of CB-839 on primary human mature adipocytes (n = 12 from two independent experiments) on gene expression of mitochondrial markers. g. Effects of CB-839 in human mature adipocytes on protein expression of electron transport chain proteins (repeated two times). Data in a, b, f were compared using Student’s t-test and p values are shown. Data in d, e were compared using two-way ANOVA and p values reflecting treatment effects are shown. Data in panels a-b and d-f show mean ± S.E.M. Abbreviations: 2DG = 2-Deoxy-D-glucose, DMSO = dimethyl sulfoxide, FCCP = carbonylcyanide-p-trifluoromethoxyphenylhydrazone, O = oligomycin, R/A = rontenone/antimycin A. Source data
Extended Data Fig. 6
Extended Data Fig. 6. Links between GLS depletion and oxygen consumption.
a. Western blot of global protein O-GlcNAcylation in siC or siGLS human adipocytes. Representative results are displayed (repeated two times). b. Expression of indicated PRDM genes in siC or siGLS human adipocytes based on RNA-seq data from human adipocytes transfected with siC or siGLS (three replicates per condition). c. The mTORC1 activity (left panel) in siC or siGLS human adipocytes was assessed by western blot analysis. This was performed by treating cells with or without an mTORC1 activator (insulin, 15 minutes treatment), and by additionally treating with or without an mTORC1 inhibitor (rapamycin) for three hours in insulin-deprived cells (repeated three times). The AMPK activity (right panel) in human adipocytes subjected to siC or siGLS was assessed through western blot analysis. Cells were incubated cells with or without an AMPK activator (PF739) for 24 hours (repeated two times). Proteins from the same experiments were loaded on two different gels in parallel for the panels on the left and on two different gels for the panels on the right. d. Oxygen consumption rates during mitostress tests in siC or siGLS human adipocytes (left) incubated with or without eta-ketoglutarate (EtaKG). Data were compared for basal respiration and maximal respiratory capacity (six replicates per condition, repeated two times). Data were compared using two-way ANOVA and Tukey’s post-hoc test, p values are shown (right). e. Oxygen consumption rates during mitostress test in human adipocytes incubated with a GPR81 agonist (six replicates per condition, repeated two times). f. Representative examples of ETC protein levels in human adipocytes incubated with GPR81 agonist (two replicates per condition, repeated two times). g. NAD+, NADH and the ratio in siC or siGLS human adipocytes (four replicates per condition, repeated two times). h. Representative examples of ETC protein and P38 MAPK pathway levels in human adipocytes incubated with lactate for 30 minutes (repeated three times). Proteins from the same samples were loaded on two different gels in parallel. i. Oxygen consumption rates during mitostress test in human adipocytes incubated with sodium lactate (six replicates per condition, repeated two times). Data were compared using Student’s t-test and p values are shown (right). Data in panels d-e, g, i show mean ± S.E.M. Source data
Extended Data Fig. 7
Extended Data Fig. 7. Cross-talk between high fat diet and glutamine metabolism in male and female mice.
a. Gls and Glul mRNA expression in different adipose depots in male or female mice fed chow (CD) or high fat diet (HFD) for 15 weeks (seven male mice and four female mice per condition). Data were compared using Student’s t-test and p values are shown. b. Glutamine (gln) and glutamate (glu) levels including glutamine-to-glutamate ratio were measured in the plasma (left) or iWAT (right) of male and female mice fed chow (CD) or high fat diet (HFD) for 15 weeks (four mice per gender and per condition). Data were compared using Student’s t-test and p values are shown. c. Expression of genes encoding UCP1 and electron transport chain proteins in iWAT of mice fed chow (CD-vehicle, n = 8) or HFD injected intraperitoneally with either vehicle (HF-vehicle, n = 12) or glutamine (HF-GLN, n = 12) for two weeks. This cohort of mice has been described before. Data were compared using one-way ANOVA and Tukey’s post-hoc test, p values are shown. d. Ct values of Cre (left) and Gls mRNA expression (right) in mature adipocytes from eWAT or iWAT of Glsfl/fl (n = 3) and GlsAdipoqCre (n = 4) female mice. e. Expression of HIF1α target genes in iWAT of Glsfl/fl (n = 8) and GlsAdipoqCre (n = 5) male mice. Data were analyzed by Student’s t-test and p values are shown. f. Food intake (left) and locomotor activity (right) in Glsfl/fl (n = 8) and GlsAdipoqCre (n = 5) male mice. Data (eight and five mice per condition) were analyzed by two-way ANOVA with no statistical significance detected. Data presented in box plot represent min., max and median. Data in panels a-e show mean ± S.E.M. Abbreviations: Ct = threshold cycles, Cre = Cre recombinase-mediated DNA recombination, eWAT = epididymal white adipose tissue, iWAT = inguinal white adipose tissue, MA = mature adipocytes, ND = non-detectable. Source data

References

    1. Felig, P., Marliss, E. & Cahill, G. F.Jr Plasma amino acid levels and insulin secretion in obesity. N. Engl. J. Med.281, 811–816 (1969). 10.1056/NEJM196910092811503 - DOI - PubMed
    1. Newgard, C. B. et al. A branched-chain amino acid-related metabolic signature that differentiates obese and lean humans and contributes to insulin resistance. Cell Metab.9, 311–326 (2009). 10.1016/j.cmet.2009.02.002 - DOI - PMC - PubMed
    1. Batista, T. M., Haider, N. & Kahn, C. R. Defining the underlying defect in insulin action in type 2 diabetes. Diabetologia64, 994–1006 (2021). 10.1007/s00125-021-05415-5 - DOI - PMC - PubMed
    1. White, P. J. et al. Insulin action, type 2 diabetes, and branched-chain amino acids: a two-way street. Mol. Metab.52, 101261 (2021). 10.1016/j.molmet.2021.101261 - DOI - PMC - PubMed
    1. Ma, Q. X. et al. BCAA-BCKA axis regulates WAT browning through acetylation of PRDM16. Nat. Metab.4, 106–122 (2022). 10.1038/s42255-021-00520-6 - DOI - PubMed