. 2024 Aug;5(8):1176-1194.
doi: 10.1038/s43018-024-00789-y. Epub 2024 Jul 15.

Building a translational cancer dependency map for The Cancer Genome Atlas

Affiliations

Building a translational cancer dependency map for The Cancer Genome Atlas

Xu Shi et al. Nat Cancer. 2024 Aug.

Abstract

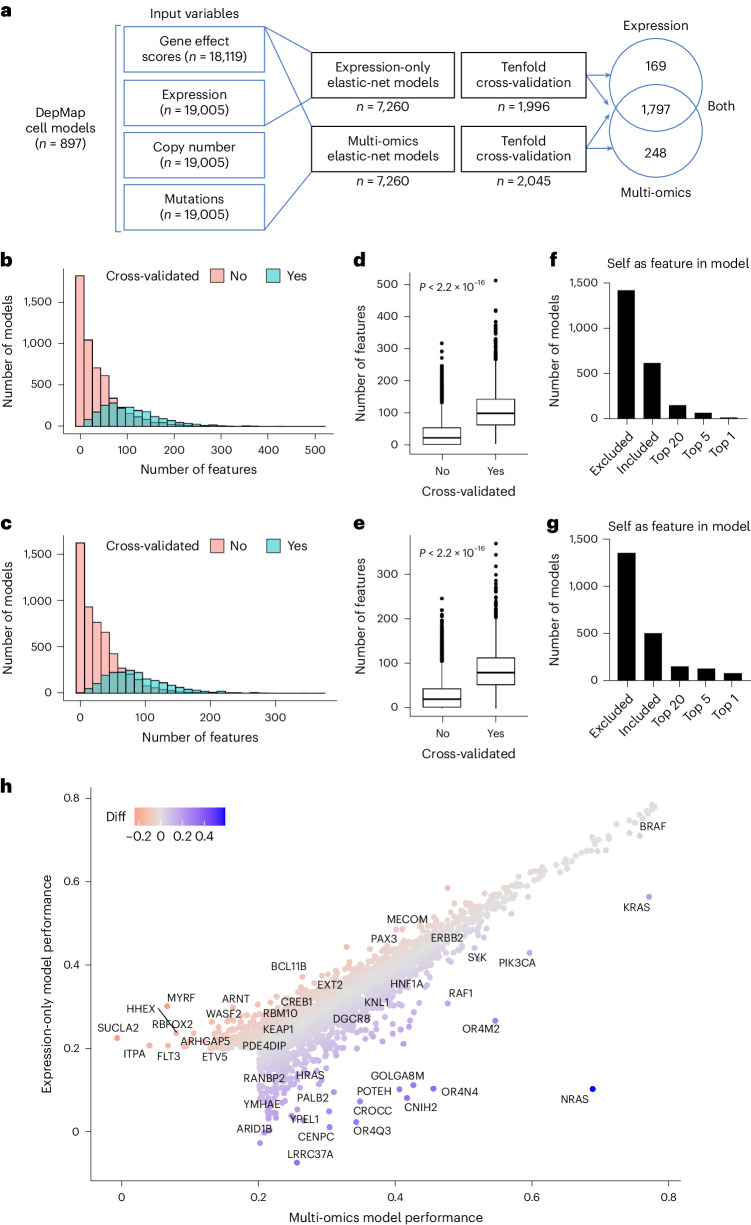
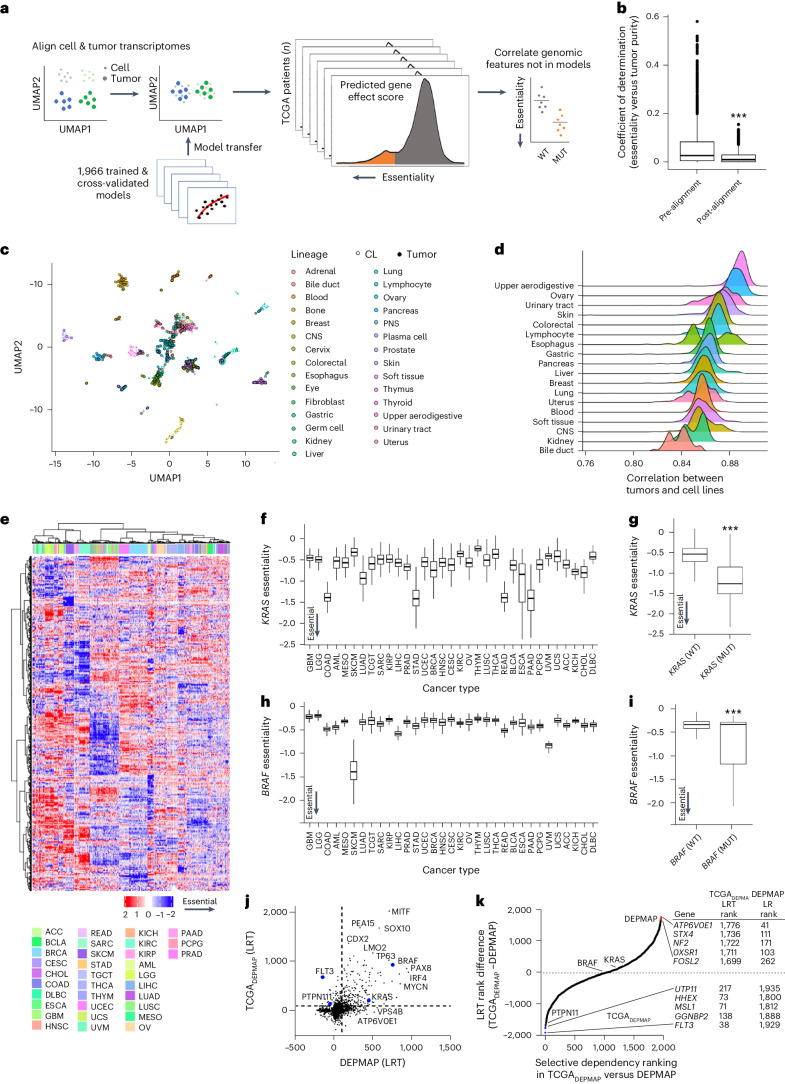
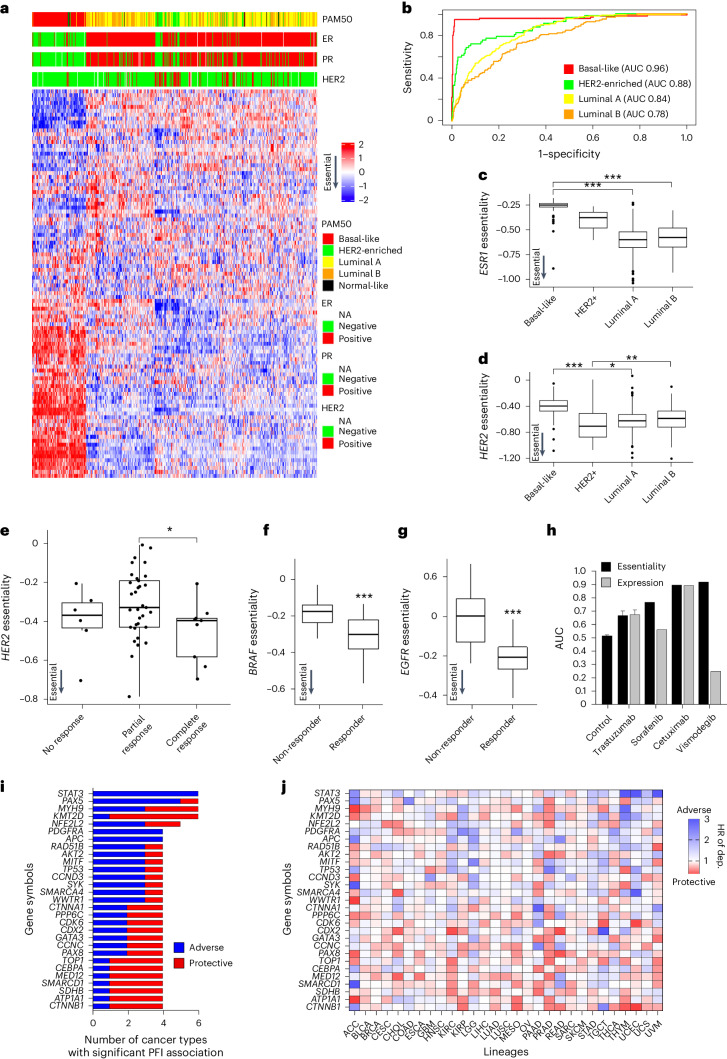
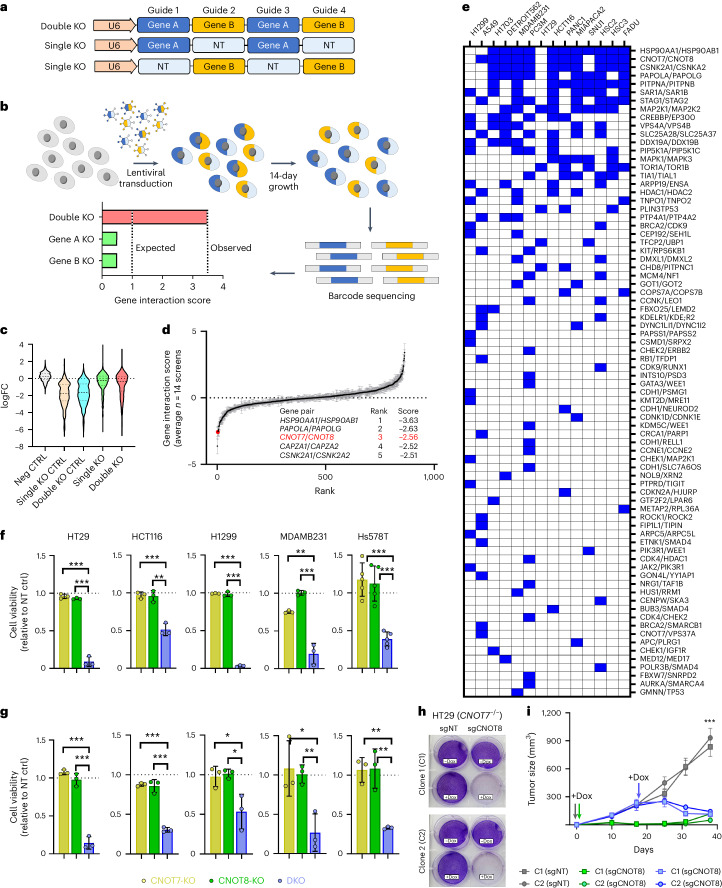
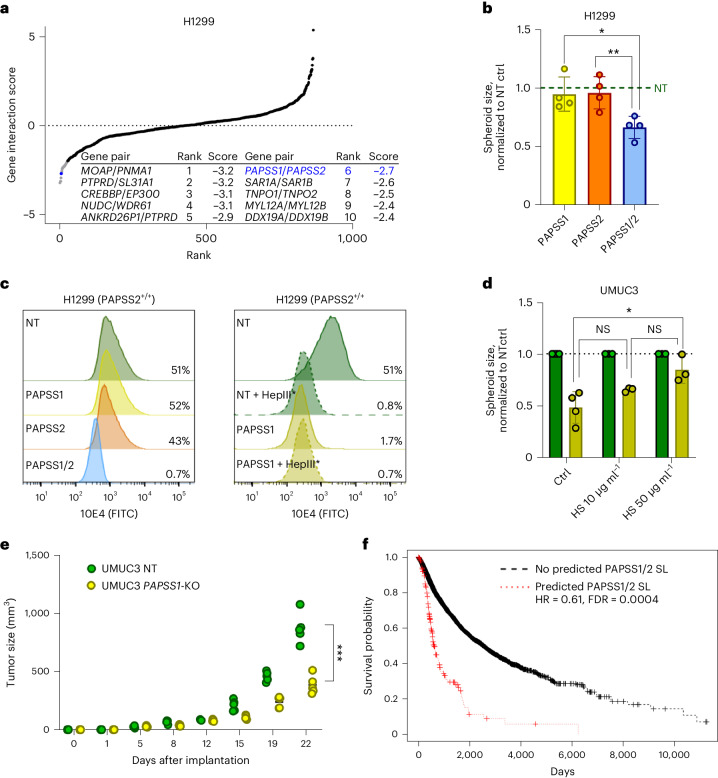
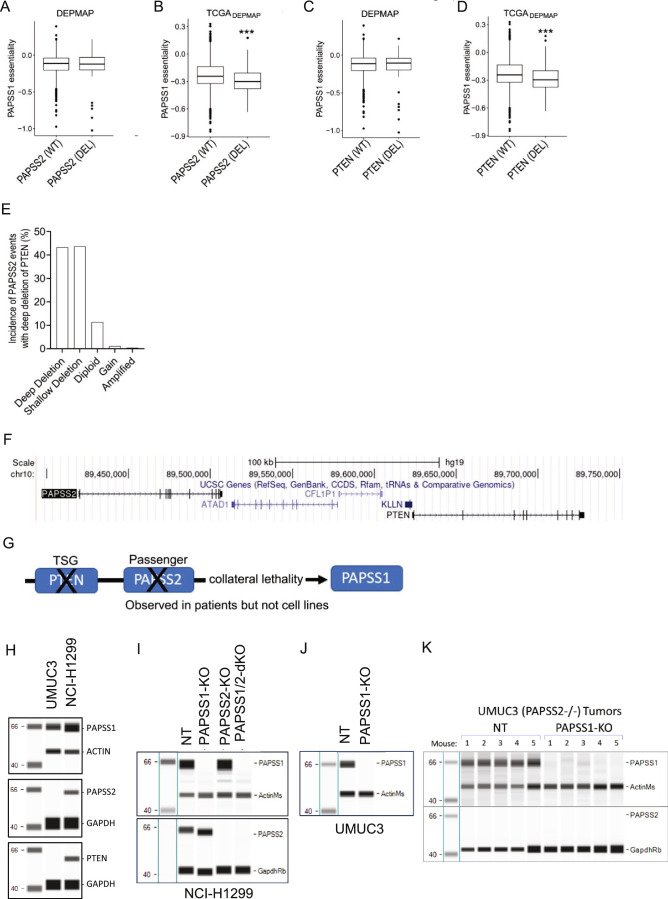
Cancer dependency maps have accelerated the discovery of tumor vulnerabilities that can be exploited as drug targets when translatable to patients. The Cancer Genome Atlas (TCGA) is a compendium of 'maps' detailing the genetic, epigenetic and molecular changes that occur during the pathogenesis of cancer, yet it lacks a dependency map to translate gene essentiality in patient tumors. Here, we used machine learning to build translational dependency maps for patient tumors, which identified tumor vulnerabilities that predict drug responses and disease outcomes. A similar approach was used to map gene tolerability in healthy tissues to prioritize tumor vulnerabilities with the best therapeutic windows. A subset of patient-translatable synthetic lethalities were experimentally tested, including PAPSS1/PAPSS12 and CNOT7/CNOT78, which were validated in vitro and in vivo. Notably, PAPSS1 synthetic lethality was driven by collateral deletion of PAPSS2 with PTEN and was correlated with patient survival. Finally, the translational dependency map is provided as a web-based application for exploring tumor vulnerabilities.


Conflict of interest statement

All authors except M.J.F. are employees of AbbVie. M.J.F. was an employee of AbbVie at the time of the study and is currently a full-time employee of Pfizer. The design, study conduct and financial support for this research were provided by AbbVie. AbbVie participated in the interpretation of data, review and approval of the publication.

Figures

Fig. 1
Fig. 1. Predictive modeling of gene essentiality in the DEPMAP.
a, Schematic of the elastic-net models for predictive modeling of gene essentiality in the DEPMAP using expression-only data or multi-omics data. Note the broad overlap in cross-validated models using expression-only or multi-omics data. b, Distribution of the number features per multi-omics model. c, Distribution of the number of features per expression-only model. d, Number of features per multi-omics model that passed (n = 2,045) or failed (n = 5,215) cross-validation based on a correlation coefficient of 0.2 threshold. e, Number of features per expression-only model that passed (n = 1,966) or failed (5,294) cross-validation based on a correlation coefficient of 0.2 threshold. For d and e, the center horizontal line represents the median (50th percentile) value. The box spans from the 25th to the 75th percentile. The whiskers indicate the fifth and 95th percentiles. f, Rank of the target gene (self) as a feature in the cross-validated multi-omics models. g, Rank of the target gene (self) as a feature in the cross-validated expression-only models. h, Comparison of model performance (correlation coefficients) of cross-validated models from multi-omics and expression-only data. Note for bh that the performance and characteristics of multi-omics and expression-only models are very similar. P values indicated on graphs were determined by the Wilcoxon rank-sum test for two-group comparison (d and e). Source data
Fig. 2
Fig. 2. Building a translational dependency map: TCGADEPMAP.
a, Schematic of gene essentiality model transposition from DEPMAP to TCGA, following alignment of genome-wide expression data to account for differences in homogeneous cultured cell lines and heterogenous tumor biopsies with stroma. b, Coefficient of determination (R2) of the cross-validated gene essentiality models and tumor purity before (n = 1,966) and after transcriptional alignment (n = 1,966). The center horizontal line represents the median (50th percentile) value. The box spans from the 25th to the 75th percentile. The whiskers indicate the fifth and 95th percentiles. A two-sided Wilcoxon rank-sum test was performed to test for statistical significance. c, Uniform Manifold Approximation and Projection (UMAP) visualization of normalization of genome-wide transcriptomes improves alignment between cultured cells and patient tumor biopsies with contaminating stroma. d, Correlation coefficients of essentiality profiles of different lineages of cultured cell models and TCGA patient tumors. e, Unsupervised clustering of predicted gene essentiality scores across TCGADEPMAP revealed strong lineage dependencies. Blue indicates genes with stronger essentiality and red indicates genes with less essentiality. f, KRAS dependency was enriched in TCGADEPMAP lineages (n = 9,593) with high frequency of KRAS GOF mutations, including colon adenocarcinoma (COAD), LUAD, STAD, READ, esophageal carcinoma (ESCA) and PAAD. g, KRAS essentiality correlated with KRAS mutations in all TCGADEPMAP lineages (n = 532 for KRASmut and n = 7,049 for KRASwt). h, BRAF dependency in TCGADEPMAP (n = 9,593) was enriched in SKCM, which has a high frequency of GOF mutations in BRAF. i, BRAF essentiality correlated with BRAF mutations in all TCGADEPMAP lineages (n = 559 for BRAFmut and n = 7,022 for BRAFwt). For fi, the center horizontal line represents the median (50th percentile) value. The box spans from the 25th to the 75th percentile. The whiskers indicate the fifth and 95th percentiles. For gi, a two-sided Wilcoxon rank-sum test was performed to test for statistical significance. j, Scatter-plot of model selectivity in TCGADEPMAP and DEPMAP, as determined by normality likelihood (NormLRT). k, Ranking of model selectivity between in TCGADEPMAP and DEPMAP, as determined by the NormLRT scores. ***P < 0.001, as determined by the Wilcoxon rank-sum test for two-group comparison and Kruskal–Wallis followed by Wilcoxon rank-sum test with multiple test correction for the multi-group comparison. CNS, central nervous system; PNS, peripheral nervous system; ACC, adrenocortical carcinoma; BLCA, bladder urothelial carcinoma; CESC, cervical and endocervical cancers; CHOL, cholangiocarcinoma; GBM, glioblastoma multiforme; HNSC, head and neck squamous cell carcinoma; KIRC, kidney renal clear cell carcinoma; KIRP, kidney renal papillary cell carcinoma; LGG, lower-grade glioma; LIHC, liver hepatocellular carcinoma; MESO, mesothelioma; OV, ovarian serous cystadenocarcinoma; PRAD, prostate adenocarcinoma; SARC, sarcoma; TGCT, testicular germ cell tumors; THCA, thyroid carcinoma; THYM, thymoma; UCEC, uterine corpus endometrial carcinoma; UCS, uterine carcinosarcoma; UVM, uveal melanoma. Source data
Fig. 3
Fig. 3. Translating TCGADEPMAP to clinically relevant phenotypes and outcomes.
a, Unsupervised clustering of the top 100 dependencies in TCGA breast cancer patients. b, A ROC–AUC analysis was used to test the accuracy of calling breast cancer subtypes using the top 100 dependencies. c, ESR1 dependencies are strongest in ER-positive luminal BRCA (n = 96 for basal-like, n = 57 for HER2+, n = 231 for luminal A, n = 126 for luminal B and n = 7 for normal-like). d, HER2 dependencies are strongest in HER2-amplified BRCA (n = 96 for basal-like, n = 57 for HER2+, n = 231 for luminal A, n = 126 for luminal B and n = 7 for normal-like) e, HER2 dependency predicts trastuzumab response in patients with BRCA (n = 6 for no response, n = 33 for partial response and n = 9 for complete response). f, BRAF dependency predicts sorafenib response in patients with hepatocellular cancer (n = 46 for non-responder and n = 21 for responder). g, EGFR dependency predicts cetuximab response in patients with head and neck cancer (n = 26 for non-responder and n = 14 for responder). For cg, *P < 0.05, **P < 0.01 and ***P < 0.001, as determined by the Wilcoxon rank-sum test for two-group comparison and Kruskal–Wallis test followed by a Wilcoxon rank-sum test with multiple test correction for the multi-group comparison. For boxplots in cg, the center horizontal line represents the median (50th percentile) value. The box spans from the 25th to the 75th percentile. The whiskers indicate the 5th and 95th percentiles. h, AUC values for drug response predictions based on essentiality, expression and random essentiality scores generated via random sampling (control). i, Top gene essentialities associated with the PFI by univariate Cox proportional hazard regression model across multiple lineages in TCGADEPMAP (Benjamini–Hochberg, FDR < 0.2). j, HRs of the top essentialities across TCGADEPMAP. Blue indicates a greater dependency associated with worse outcome and red indicates a greater dependency is associated with better outcome. P values and HRs are shown in Supplementary Table 9. Source data
Fig. 4
Fig. 4. Using TCGADEPMAP to translate synthetic lethalities in human cancer.
a, Schematic of the CRISPR/Cas12 library multiplexed guide arrays targeting one or two genes per array. b, Schematic of the synthetic lethality screening approach using the CRISPR/Cas12 library. All CRISPR screens were performed as n = 3 biological replicates per cell line. c, Violin plots of target-level CRISPR of the average log2 fold change (FC) across all tested cell lines for nontargeting (NT) guide (neg CTRL), single knockout guides targeting essential genes (single KO CTRL), DKO guides targeting essential genes (DKO CTRL), single knockout guides of TCGADEPMAP candidates (single KO) and DKO guides of TCGADEPMAP candidates (DKO). d, Rank plot of target-level gene interaction (GI) scores averaged across n = 14 cell lines in the CRISPR/Cas12 multiplexed screening (A549, DETROIT562, FADU, H1299, H1703, HCT116, HSC2, HSC3, HT29, MDAMB231, MIAPACA2, PANC1, PC3M and SNU1), including the top five synthetic lethalities (table insert). The black line indicates the mean and gray error bars show ±s.e.m. e, Distribution of synthetic lethal candidates from TCGADEPMAP with experimental evidence of synthetic lethality in the CRISPR/Cas12 multiplexed screening across 14 cancer cell lines. A blue box indicates a GI score < −2. f,g, Cell viability assessed by CellTiterGlo (CTG) luminescence at 7 days after single (KO) or dual (DKO) CNOT7/CNOT8 knockouts, normalized to NT controls in five cell lines grown in 2D monolayers (f) or 3D spheroids (g); n = 3 biological replicates per cell model per condition with the exception of n = 5 biological replicates for Hs578T grown in 2D monolayer. Error bars are mean ± s.d. h, Crystal violet staining of CNOT7−/− clones C1 and C2 stably expressing nontargeting (sgNT) or CNOT8-targeting (sgCNOT8) dox-inducible guide constructs, following 7 days of dox treatment (Methods). i, Tumor xenograft studies of HT29 clones grown in mice fed dox-containing food from day 0 (gray and green lines) or beginning on day 19 (blue lines). n = 5 mice per group. Error bars are ±s.d. Asterisks in f, g and i reflect two-tailed, unpaired Student’s t-test P values; *P < 0.05; **P < 0.01; ***P < 0.001. Source data
Fig. 5
Fig. 5. PAPSS1 and PAPSS2 are novel synthetic lethal paralogs detected by TCGADEPMAP.
a, Rank plot of target-level GI scores in H1299 cells, including the top ten synthetic lethalities (table insert). The novel synthetic lethality, PAPSS1/PAPSS2, is highlighted in blue. All CRISPR screens were performed as n = 3 biological replicates per cell line. b, Spheroid size of H1299 cells with single or dual PAPSS1 and PAPSS2 knockouts, normalized to NT control spheroids; n = 4 biological replicates per condition. Data show mean ± s.d. *P < 0.05 and **P < 0.01 as per unpaired, two-tailed t-test. c, Flow cytometry histogram overlay plots of viable H1299 and UMUC3 cells (DAPI) showing expression of cell surface sulfonated HSPGs as measured by antibody clone 10E4-FITC. Dual loss of PAPSS1/PAPSS2 leads to total loss of sulfonation comparable to heparinase III treatment (HepIII*) which specifically cleaves sulfonated HS chains. d, Growth defects of UMUC3 spheroids following deletion of PAPSS1 (yellow bars) were partially rescued by the addition of 10 μg ml−1 and 50 μg ml−1 of exogenous HS as compared to NT control spheroids (green bars); n = 4 biological replicates for the untreated control and n = 3 biological replicates per treated condition. Data are mean ± s.d. *P < 0.05 as per unpaired, two-tailed t-test. e, Diagram showing tumor volumes over time (d, days) after in vivo implantation of 1 × 106 UMUC3 NT or PAPSS1-KO cells in SCID/beige mice. Each dot represents an individual mouse (n = 5 mice per condition); ***P < 0.001, as determined by unpaired, two-tailed t-test of the final data point. f, Kaplan–Meier plot of TCGADEPMAP patients with a predicted PAPSS1/PAPSS2 synthetic lethality has a worse outcome compared to the rest of the cohort, as determined by a Cox log-rank test. DAPI, 4,6-diamidino-2-phenylindole. Source data
Fig. 6
Fig. 6. Building a translational dependency map in patient-derived xenografts: PDXEDEPMAP.
a, Schematic of gene essentiality model transposition from DEPMAP to PDXE, following alignment of genome-wide expression data to account for differences in homogeneous cultured cell lines and PDX samples with contaminating stroma. b, Unsupervised clustering of predicted gene essentiality scores across five lineages in PDXEDEPMAP confirmed similar lineage drivers of gene dependencies, as observed in TCGADEPMAP. Blue indicates genes with stronger essentiality and red indicates genes with less essentiality. c, KRAS dependency was enriched in PDXEDEPMAP lineages with high frequency of KRAS GOF mutations, including CRC and PDAC. n = 43 for BRCA, n = 51 for CRC, n = 27 for NSCLC, n = 39 for PDAC and n = 32 for CM. d, KRAS essentiality correlated with KRAS mutations in all PDXEDEPMAP lineages (n = 74 for KRASmut and n = 117 for KRASwt). e, BRAF dependency in PDXEDEPMAP was enriched in CM, which has a high frequency of GOF mutations in BRAF. n = 43 for BRCA, n = 51 for CRC, n = 27 for NSCLC, n = 39 for PDAC and n = 32 for CM. f, BRAF essentiality correlated with BRAF mutations in all TCGADEPMAP lineages (n = 32 for BRAFmut and n = 159 for BRAFwt). For cf, the center horizontal line represents the median (50th percentile) value. The box spans from the 25th to the 75th percentile. The whiskers indicate the fifth and 95th percentiles. g, Top correlated gene essentiality models that correlate with PDX response to erlotinib in PDXEDEPMAP. h, Top correlated gene essentiality models that correlate with PDX response to cetuximab in PDXEDEPMAP. ***P < 0.001, as determined by the Wilcoxon rank-sum test for two-group comparison (d and f) and Kruskal–Wallis test followed by a Wilcoxon rank-sum test with multiple test correction for a multi-group comparison (c and e). NSCLC, non-small cell lung cancer. Source data
Fig. 7
Fig. 7. Building a translational dependency map in normal tissues: GTEXDEPMAP.
a, Schematic of gene essentiality model transposition from DEPMAP to GTEX, following alignment of genome-wide expression data to account for differences in homogeneous cultured cell lines and healthy tissue biopsies. b, Average gene essentiality profile across healthy tissues of GTEXDEPMAP (n = 17,382) for molecular targets with known liver and blood toxicities (in blue). c, Unsupervised clustering of predicted gene essentiality scores across healthy tissues. Blue indicates genes with stronger essentiality and red indicates genes with less essentiality. d, KRAS essentiality is significantly higher in PAAD with GOF mutations compared to healthy pancreas in GTEXDEPMAP (n = 146 for cancer with n = 106 KRASmut and n = 40 KRASwt, n = 328 for normal) e, BRAF essentiality is significantly higher in SKCM with GOF mutations compared to normal skin GTEXDEPMAP (n = 319 for cancer with n = 165 BRAFmut and n = 154 BRAFwt, n = 1,809 for normal) For b, d, and e, the center horizontal line represents the median (50th percentile) value. The box spans from the 25th to the 75th percentile. The whiskers indicate the fifth and 95th percentiles. f, Global differences between the predicted target efficacy score (TCGADEPMAP) and the healthy tissue-of-origin tolerability score (GTEXDEPMAP). g, STRING network analysis of the top 100 LUAD targets with the greatest predicted tolerability in healthy lung reveals significant connectivity (P < 1 × 10−16) and gene ontology enrichment oxidative phosphorylation (blue-colored spheres; P = 5.8 × 10−11) and mitochondrial translation (red-colored spheres; P = 2.9 × 10−20). ***P < 0.001, as determined by a Wilcoxon rank-sum test for two-group comparison and Kruskal–Wallis test followed by a Wilcoxon rank-sum test with multiple test correction for a multi-group comparison (d and e). Source data
Extended Data Fig. 1
Extended Data Fig. 1. The characteristics of gene essentiality models before and after transcriptional alignment cell models and patient tumor biopsies.
(a) The performances of expression-only and multi-omics models of gene essentiality were compared across 103 annotated oncogenes. Note the strong correlation of expression-only and multi-omics models with a few notable outliers, such as NRAS, FLT3 and ARNT. (b) The distribution of the number of features for the multi-omics models for the 103 annotated oncogenes. (c) The number of features per multi-omics model for the 103 annotated oncogenes that passed (n = 95) or failed (n = 102) cross-validation. (d) The distribution of the number of features per expression-only models for the 103 annotated oncogenes. (e) The number of features per expression-only model for the 103 annotated oncogenes that passed (n = 101) or failed (n = 96) cross-validation. Note similarities in the characteristics and performances of multi-omics and expression-only models, and that only 7% of the multi-omics models significantly outperformed the expression-only models in the cross-validation while 84% were comparable when applying a cutoff of 0.05 correlation coefficient difference between models as a meaningful improvement in performance. As a reference using the same criteria 15% of multi-omics models outperformed expression-based models and 76% were comparable when we used the whole set of 2,211 models. (f, g) The heatmaps show the Pearson correlation between the gene expression of DepMap and TCGA before (f) and after (g) expression alignment by identification and removal of the most variant signatures (cPC1–4; that is, stromal signatures) before elastic-net ML. The rows are TCGA lineages and columns are DepMap lineages. (h) Shows that the correlation of expression for the same lineage (n = 22) in TCGA and DepMap is significantly improved by our expression alignment pipeline. (i) Comparison of expression-only elastic-net models for gene essentiality and gene mutational status (n = 890). To make performance metrics (AUC) comparable with binary mutational status, the essentiality scores were binarized using a –0.5 essentiality score as a cutoff. To calculate the accuracy of predicting dependencies and mutations, elastic-net machine learning was run to predict mutations and essentiality using the same settings and expression data for 891 genes with mutations at >2% prevalence in TCGADEPMAP patients. Of note, the elastic-net models were allowed to select the most informative predictive features for mutation and essentiality for each gene, as the best predictors for essentiality may not be the best features to predict mutation. For (C,E,H,I), the center horizontal line represents the median (50th percentile) value. The box spans from the 25th to the 75th percentile. The whiskers indicate the 5th and 95th percentiles. The two-sided Wilcoxon rank test was used for (C,E,H) and for (I) ****P < 0.0001 by Student unpaired t-test. Source data
Extended Data Fig. 2
Extended Data Fig. 2. Examples of dependencies with different selectivity profiles across TCGADEPMAP and DEPMAP cohorts.
(a) FLT3 was classified as a strongly selective dependency (SSD) with markedly higher dependency in blood lineage cancers of TCGADEPMAP (blue bar, n = 7,021), (b) whereas FLT3 showed higher dependency in some blood lineage cancers but does not meet the threshold of an SSD in DEPMAP (n = 810). (c) ATPV6V0E1 essentiality scores varied widely across TCGADEPMAP (n = 7,021), (d) while ATPV6V0E1 was classified as an SSD that was restricted to only a few lineages in DEPMAP (blue bars, n = 810). (e) PTPN11 was classified as an SSD with very strong dependencies in a subset of breast cancer patients in TCGADEPMAP (blue bar, n = 7,021), (f) whereas no selectivity of PTPN11 essentiality was detected in DEPMAP (n = 810). For (A-F), the center horizontal line represents the median (50th percentile) value. The box spans from the 25th to the 75th percentile. The whiskers indicate the 5th and 95th percentiles (g) Top cancer driver mutations enriched in TCGADEPMAP breast cancer patients that were highly dependent on PTPN11. (h) Top cancer driver mutations depleted in TCGADEPMAP breast cancer patients that were highly dependent on PTPN11. For (g, h), ***FDR < 0.01, **P < 0.01, and *P < 0.05, as determined by Fisher exact test. Source data
Extended Data Fig. 3
Extended Data Fig. 3. Characterization of synthetic lethalities.
(a) STAG1 synthetic lethality with STAG2 mutation (n = 163 for STAG2MUT and n = 7,418 for STAG2WT), (b) SMARCA2 synthetic lethality with SMARCA4 mutation (n = 223 for SMARCA4MUT and n = 7,358 for SMARCA4WT), (c) CREBBP synthetic lethality with EP300 mutation (n = 937 for EP300DEL and n = 6,644 for EP300WT), and (d) CNOT7 synthetic lethality with CNOT8 deletion are examples of synthetic lethalities that were detected by TCGADEPMAP. (n = 550 for CNOT8DEL and n = 7,031 for SMARCA4WT) ***P < 0.001, as determined by the Wilcoxon rank-sum test. (E-I) Comparison of multiplexed CRISPR/Cas12 screens performed using AsCas12a and EnAsCas12a enzymes. Analysis was performed using a Pearson’s correlation and coefficients (r) are displayed on the graphs. (j) Simple Western blots of protein expression of CNOT7, CNOT8 and housekeeping control Beta-Actin of nontargeting (NT) control, single (KO) and dual (DKO) knockout cells 3 days after CRISPR/RNP electroporation. (k) Plots showing the protein abundance ratio of CNOT8 (Y-axis) and copy number status of CNOT7 (X-axis) in the CPTAC Lung Adenocarcinoma (LUAD) and Breast Cancer (BRCA) cohorts showing a significant upregulation of CNOT8 protein in tumors with CNOT7 copy number loss (shallow and deep deletions) compared to diploid and gain tumors (for LUAD n = 7 for gain, n = 51 for diploid and n = 55 for shallow deletion; for BRCA n = 22 for gain, n = 33 for diploid and n = 67 for shallow deletion). For (A-D and K), the center horizontal line represents the median (50th percentile) value. The box spans from the 25th to the 75th percentile. The whiskers indicate the 5th and 95th percentiles. The two-sided Wilcoxon rank test was used for (A-D) ***p < 0.001 and ***p < 0.001 as determined by Student’s unpaired, two-tailed t-test for (K). Source data
Extended Data Fig. 4
Extended Data Fig. 4. Supporting evidence of PAPSS1/2 synthetic lethality.
a, b) PAPSS1 is a novel synthetic lethality in the context of PAPSS2 deletion, which is not detectable in (a) DEPMAP cell lines (n = 905) and is only detectable in (b) TCGADEPMAP patient samples (n = 7,581). (c, d) Likewise, PAPSS1 is not synthetic lethal with PTEN deletion in DEPMAP cell lines (c, n = 905) and is only detectable in TCGADEPMAP patient samples (d, n = 7,581). For (A-D), the center horizontal line represents the median (50th percentile) value. The box spans from the 25th to the 75th percentile. The whiskers indicate the 5th and 95th percentiles. (e) Unlike cultured cell models, PAPSS2 is frequently co-deleted with PTEN in TCGA patients. (f) PAPSS2 is a closely neighboring gene of PTEN. (g) A schematic representation summarizing the hypothesized synthetic lethality of PAPSS1 that is driven by collateral deletion of PAPSS2 with the tumor suppressor gene (TSG), PTEN, in patients but not cell lines. ***P < 0.001, as determined by the Wilcoxon rank-sum test. (h) Endogenous expression by Simple Western of PAPSS1, PAPSS2, and PTEN in the model cell lines UMUC3 and NCI-H1299. (i,j) Validation of PAPSS1 and PAPSS2 single (KO) and double (dKO) knockouts by RNP in spheroid experiments for NCI-H1299 (i) and UMUC3 (j). (k) Validation of PAPSS1 knockout in the UMUC3 xenograft experiment tumors (n = 5 tumors per condition from n = 1 independent experiment). Molecular weight marker lanes are shown in kDa. Data shown in (h-j) are representative from at least 3 independent experiments. The two-sided Wilcoxon rank test was used for (A-D), ***P < 0.001. Source data
Extended Data Fig. 5
Extended Data Fig. 5. Essentiality profiles of genes in cancer versus normal tissues.
(a) ERBB2 essentiality is significantly higher in malignant breast cancer with ERBB2 amplifications (TCGADEPMAP, n = 137 for ERBB2AMP and n = 932 for ERBB2WT) compared with normal breast (GTEXDEPMAP, n = 459). ***P < 0.001, as determined by the Wilcoxon rank-sum test. For the boxplot, the center horizontal line represents the median (50th percentile) value. The box spans from the 25th to the 75th percentile. The whiskers indicate the 5th and 95th percentiles. (b) STRING network analysis of the top 100 LUAD targets with the greatest predicted tolerability in normal lung reveals significant connectivity (p < 1 × 10⁻¹⁶) and gene ontology enrichment for oxidative phosphorylation (blue colored spheres; p = 5.8 × 10⁻¹¹) and mitochondrial translation (red-colored spheres; p = 2.9 × 10⁻²⁰). Source data
Extended Data Fig. 6
Extended Data Fig. 6. TCGADEPMAP outperforms DeepDEP.
a) Precision-recall analysis of pan-cancer lineage predictions by the AUC values are significantly higher for TCGADEPMAP in predicting cancer lineages based on top 100 variable dependencies compared with DeepDEP. (b) The ROC curves for predicting the breast cancer subtypes based on the top 100 variable gene dependencies. The TCGADEPMAP significantly outperforms DeepDEP in predicting any of the breast cancer subtypes (TCGADEPMAP continuous line; DeepDEP dotted line). Source data
Extended Data Fig. 7
Extended Data Fig. 7. Comparison of cross-validated models with models generated using the DepMap confounders dataset as a null distribution, including sex, cas9 activity, age, lineage, primary or metastasis, growth pattern, library, screen quality and cancer type.
(a) Distribution of model performance across expression-only and confounder models. (b) The expression-only gene essentiality models significantly outperformed the models built on confounders, with the 0.2 cross-validation threshold corresponding to p < 0.03 in the confounder distribution (~7000 models). Source data
Extended Data Fig. 8
Extended Data Fig. 8. Gating strategy for Flow Cytometry plots.
Cells were first gated by FSC-A/SSC-A (~95%), and single cells by FSC-A/FSC-H (~98%). DAPI staining was used to gate viable cells (~98%). Unstained cells and/or Heparinase III treated cells were used for establishing the positive 10E4-FITC gate. Source data
Extended Data Fig. 9
Extended Data Fig. 9. The GTEX and TCGA expression profiles were aligned and normalized independently to the same DepMap expression profile and the same models (genes and coefficients) were used for both datasets.
(a) Overall range of effect sizes for both datasets was investigated using a PCA, which demonstrates that the dependency distributions show that the predicted dependency scale is very similar for the two datasets. (b) The distribution of gene essentiality scores is similar between TCGADEPMAP and TCGADEPMAP. Source data

References

    1. Hutter, C. & Zenklusen, J. C. The Cancer Genome Atlas: creating lasting value beyond its data. Cell173, 283–285 (2018). - PubMed
    1. Srivastava, S., Ghosh, S., Kagan, J. & Mazurchuk, R. The PreCancer Atlas (PCA). Trends Cancer4, 513–514 (2018). - PubMed
    1. Sidaway, P. Tracing evolution reveals new biomarkers. Nat. Rev. Clin. Oncol.17, 5 (2020). - PubMed
    1. Zehir, A. et al. Mutational landscape of metastatic cancer revealed from prospective clinical sequencing of 10,000 patients. Nat. Med.23, 703–713 (2017). - PMC - PubMed
    1. Haar, J. et al. Limited evolution of the actionable metastatic cancer genome under therapeutic pressure. Nat. Med.27, 1553–1563 (2021). - PubMed