. 2024 Sep;20(9):1025-1048.
doi: 10.1038/s44320-024-00055-4. Epub 2024 Jul 15.

Proteome-scale characterisation of motif-based interactome rewiring by disease mutations

Affiliations

Proteome-scale characterisation of motif-based interactome rewiring by disease mutations

Johanna Kliche et al. Mol Syst Biol. 2024 Sep.

Abstract

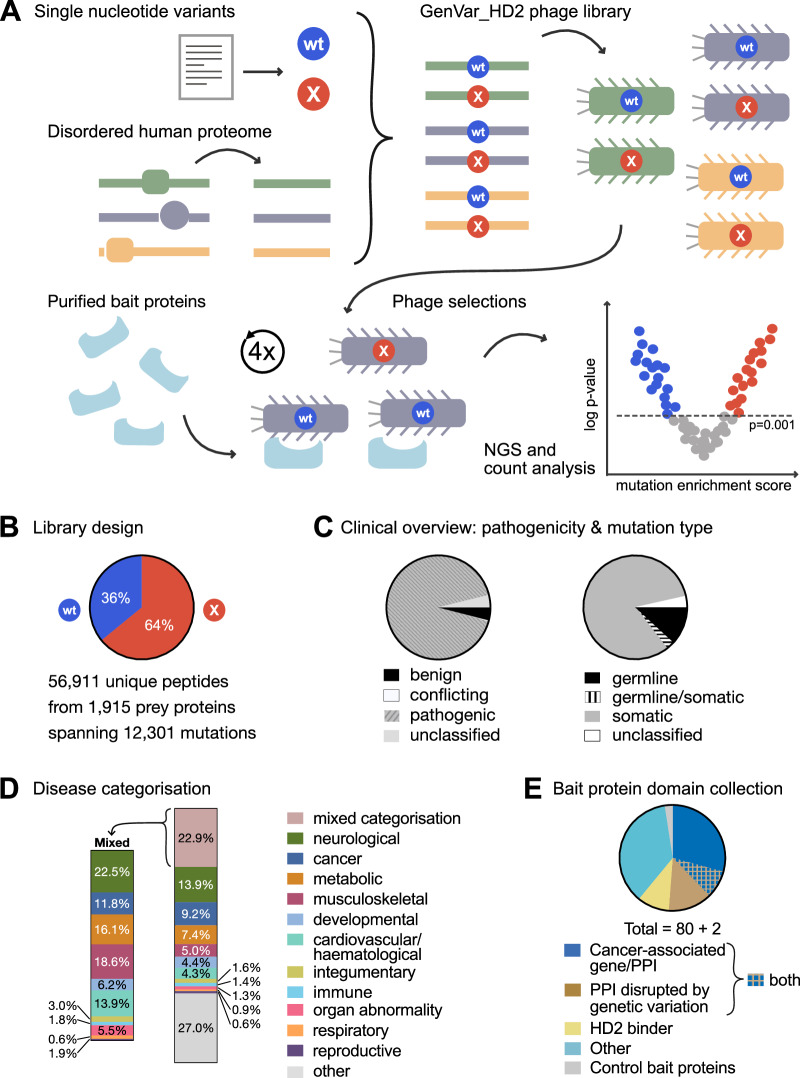
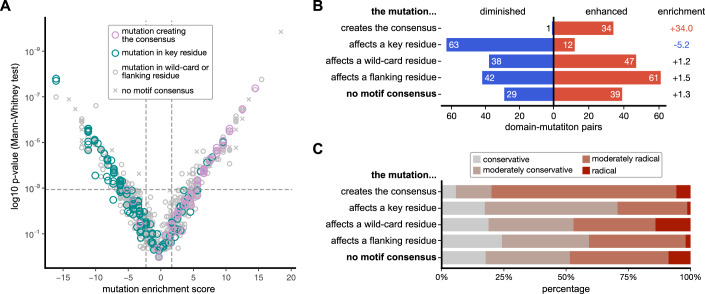
Whole genome and exome sequencing are reporting on hundreds of thousands of missense mutations. Taking a pan-disease approach, we explored how mutations in intrinsically disordered regions (IDRs) break or generate protein interactions mediated by short linear motifs. We created a peptide-phage display library tiling ~57,000 peptides from the IDRs of the human proteome overlapping 12,301 single nucleotide variants associated with diverse phenotypes including cancer, metabolic diseases and neurological diseases. By screening 80 human proteins, we identified 366 mutation-modulated interactions, with half of the mutations diminishing binding, and half enhancing binding or creating novel interaction interfaces. The effects of the mutations were confirmed by affinity measurements. In cellular assays, the effects of motif-disruptive mutations were validated, including loss of a nuclear localisation signal in the cell division control protein CDC45 by a mutation associated with Meier-Gorlin syndrome. The study provides insights into how disease-associated mutations may perturb and rewire the motif-based interactome.

Keywords: CDC45; Genetic Variation; Phage Display; Protein–Protein Interaction; Short Linear Motif.


Conflict of interest statement

The authors declare no competing interests.

Figures

Figure 1
Figure 1. Study and library design.
(A) Overview of the workflow of the GenVar_HD2 library design, phage selections and data analysis. (B) GenVar_HD2 design parameters. (C) Mutation distribution by phenotype (left) and by type of mutation (right). (D) Distribution of disease mutation categories in the library design. Mutations belonging to more than one disease category (e.g. metabolic and cancer) are categorised as mixed. The distribution of the disease categories in the mixed group is indicated in the left panel. (E) Bait protein domain collection and categorisation.
Figure 2
Figure 2. Overview of the GenVar_HD2 phage display selections and validations.
(A) Schematic overview of the phage selection outcome. (B) Summary of selection results by bait categories. (C) ProP-PD selection outcome by bait protein domain. The colour of the bar on the left indicates the bait category. The circle size encodes the number of found binding peptides and the bar on the right indicates the number of domain-mutation pairs (red: mutation enhances, blue: mutation diminishes and grey: neutral effect of the mutation). (D) V-shaped plot depicting the domain-mutation pairs plotted with their mutation enrichment score against the p value of the Mann–Whitney test. Interactions, which are significantly modulated by the mutation (Mann–Whitney test: p value ≤0.001), are coloured in red to indicate an enabling effect and in blue to indicate a disabling effect of the mutation. (E) Correlation of the log2 fold-change in affinity between wild-type and mutant peptides with the mutation enrichment score (Spearman r = 0.54). A positive correlation is judged by at least a twofold change in affinity and indicated by the dotted lines. If within a peptide pair, one of the peptides (wild-type or mutant) did not bind (no displacement), the fold-change was set for visualisation to 20 (log2 value: −4.3 or 4.3) (Table 1). Source data are available online for this figure.
Figure 3
Figure 3. Motif instance mapping and evaluation of the impact of mutations in relation to the motif.
(A) V-shaped plot depicting the domain-mutation pairs plotted with their mutation enrichment score against the p value of the Mann–Whitney test. Domain-mutation pairs where the mutation is within the key residues of the motif instance are in green and those where mutations create the motif instance are in purple. In grey are the pairs, for which the mutation is found in wild-card or flanking residues, and pairs for which the motif of the bait protein domain was not found (x). (B) Overview of the effects of the mutations depending on their position in relation to the key binding determinants. (C) Motif categories of the domain-mutation pairs with the categorisation of the mutation according to the Grantham score (conservative (<51), moderately conservative (51–100), moderately radical (101–150) or radical (>150)).
Figure 4
Figure 4. Exploring the PPI data underlying the mutations.
(A) Domain-mutation pairs enhanced or diminished by mutations as categorised based on the functional processes in which the bait protein domains are involved. (B) V-shaped plot depicting the domain-mutation pairs plotted against the mutation enrichment score and with mapped previously reported interactions (in green). A select set of pairs are indicated with names. (CF) Left: Network of NEDD4 (C), MAP1LC3B (D), CASK (E) and G3BP1 (F) with found mutation-modulated interactions indicated (blue: weakened interaction; red: enhanced interaction). A green dot indicates a previously reported interactor. A dotted line indicates that the expected consensus motif for the bait is missing in the found peptide, and a full line indicates that the motif is present in the peptide. The circle size encodes the confidence level of the found domain-mutation pair. (CF) Middle: Consensus motifs as established by previous selections against the HD2 library. (CF) Right: Fluorescence polarisation-monitored displacement experiments measuring the affinities of NEDD4 WW2 with wild-type and mutant (P616R and P618R) SCNN1B611-626 peptides, MAP1LC3B ATG8 domain with wild-type and mutant (S492F) BUB1486-501 peptides, CASK kinase domain with wild-type and mutant (R723W) MAPT717-731 peptides, and G3BP1 NTF2 domain with wild-type and mutant (S33F) CTNNB127-42 peptides. Measurements were in technical triplets and displayed is the mean with standard deviation. Source data are available online for this figure.
Figure 5
Figure 5. Assessment of disruptive mutations on the cellular level.
(A) Left: Network of KEAP1 and its found prey proteins. Interactions and corresponding mutations disrupted by the mutation are indicated in blue, enhanced in red and neutral effects in grey. A green dot indicates previously reported interacting prey proteins and a straight line if the domain’s binding motif is found in the binding peptide. The circle size encodes the confidence level of the domain-mutation pairs. Right: Consensus motif of KEAP1 KELCH as established with the HD2 library and the aligned SQSTM1 peptide with the P348L mutation site indicated in blue. (B) FP-monitored displacement curves for KEAP1 KELCH domain and the SQSTM1343-356 wild-type and P348L mutant peptides. Measurements were in technical triplets and displayed is the mean with standard deviation. (C) GFP trap of GFP-KEAP1 and probing for co-immunoprecipitation of wild-type/P348L Myc-SQSTM1 in HeLa cells (n = 3). (D) Left: Partial network of KPNA4 and its found prey proteins. The network shows interactions with previous literature support and interactions associated with mutations having a significant effect on binding (Mann–Whitney test: p value ≤0.001). Colouring and size as in (A). Right: Consensus motif of KPNA4 ARM as established with the HD2 library and the aligned CDC45 and ABRAXAS1 peptides with the mutation sites indicated in blue. (E) Displacement curves for KPNA4 ARM domain with wild-type/R157C CDC45152-166 and wild-type/R361Q ABRAXAS1349-364 peptides. Measurements were in technical duplicates and displayed is the mean with standard deviation. (F) GFP trap of EGFP (n = 3), wild-type EGFP-CDC45 (n = 3) or mutant R157C EGFP-CDC45 (n = 2) and probing for co-immunoprecipitation of T7-KPNA7 in HEK293T cells. (G) Displacement curves for KPNA7 ARM domain with wild-type/R157C CDC45152-166, sampling the major pocket. Measurements were in technical triplets and displayed is the mean with standard deviation. (H, I) Representative images of the localisation of wild-type and mutant EGFP-tagged (R361Q) ABRAXAS1 and (R157C) CDC45 in relation to the nuclear Hoechst staining (n = 3 for all except ABRAXAS1 wild-type for which n = 2). The full images are provided in Appendix S8–S11. Source data are available online for this figure.
Figure 6
Figure 6. Mapping back the mutations to the underlying diseases.
(A) Domain-mutation pairs mapped back to the disease categorisation underlying the mutations. Colouring is by the p value of the Mann–Whitney test and the disease category (grey for p > 0.001, disease category colour for p ≤ 0.001) and directionality is by the mutation enrichment score (<0: diminished interaction, >0: enhanced interaction). (B) PPI network of interactions affected by mutations in ion channels (red lines: enhanced interactions, blue lines: diminished interactions; colouring of the prey proteins is by disease category of the associated mutations). Square shapes are for the bait proteins and octagonal shapes for prey proteins. Dotted edges indicate previously reported interactions between prey proteins and green dotted lines indicates when the bait–prey interaction has been previously reported in the literature. (C) PPI network of interactions affected by cancer-associated mutations (red lines: enhanced interactions, blue lines: diminished interactions). Square shapes are for the bait proteins and octagonal shapes for prey proteins. Dotted edges indicate previously reported interactions between prey proteins. A green dotted line indicates when the bait–prey interaction has been previously reported in the literature. Prey proteins with mutations associated with breast/ovarian or gastric/colorectal cancer are indicated in purple and turquoise, respectively. Mutations annotated as cancer hotspots in the TCGA data are indicated with a flash and detailed mutation information. (D) The target development level of prey and bait proteins engaging in mutation-modulated interactions. (E) CRISPR scores from the DepMap portal of the bait/prey protein-encoding genes. Filled circles indicate that the prey or bait protein has been categorised as Tclin or Tchem. Red indicates that the mutation is cancer-associated and that the CRISPR score of the gene encoding the prey or bait protein is <−0.5.

References

    1. Alanis‐Lobato G, Andrade‐Navarro MA, Schaefer MH (2017) HIPPIE v2.0: enhancing meaningfulness and reliability of protein‐protein interaction networks. Nucleic Acids Res 45:D408–D414 10.1093/nar/gkw985 - DOI - PMC - PubMed
    1. Ali M, Khramushin A, Yadav VK, Schueler-Furman O, Ivarsson Y (2023) Elucidation of short linear motif-based interactions of the FERM domains of ezrin, radixin, moesin, and merlin. Biochemistry 62:1594–1607 10.1021/acs.biochem.3c00096 - DOI - PMC - PubMed
    1. Ali M, Simonetti L, Ivarsson Y (2020) Screening intrinsically disordered regions for short linear binding motifs. Methods Mol Biol 2141:529–552 10.1007/978-1-0716-0524-0_27 - DOI - PubMed
    1. Bamshad MJ, Ng SB, Bigham AW, Tabor HK, Emond MJ, Nickerson DA, Shendure J (2011) Exome sequencing as a tool for Mendelian disease gene discovery. Nat Rev Genet 12:745–755 10.1038/nrg3031 - DOI - PubMed
    1. Bekes M, Langley DR, Crews CM (2022) PROTAC targeted protein degraders: the past is prologue. Nat Rev Drug Discov 21:181–200 10.1038/s41573-021-00371-6 - DOI - PMC - PubMed

LinkOut - more resources