. 2024 Aug;25(8):3547-3573.
doi: 10.1038/s44319-024-00189-4. Epub 2024 Jul 15.

Novel immunomodulatory properties of adenosine analogs promote their antiviral activity against SARS-CoV-2

Affiliations

Novel immunomodulatory properties of adenosine analogs promote their antiviral activity against SARS-CoV-2

Giulia Monticone et al. EMBO Rep. 2024 Aug.

Abstract

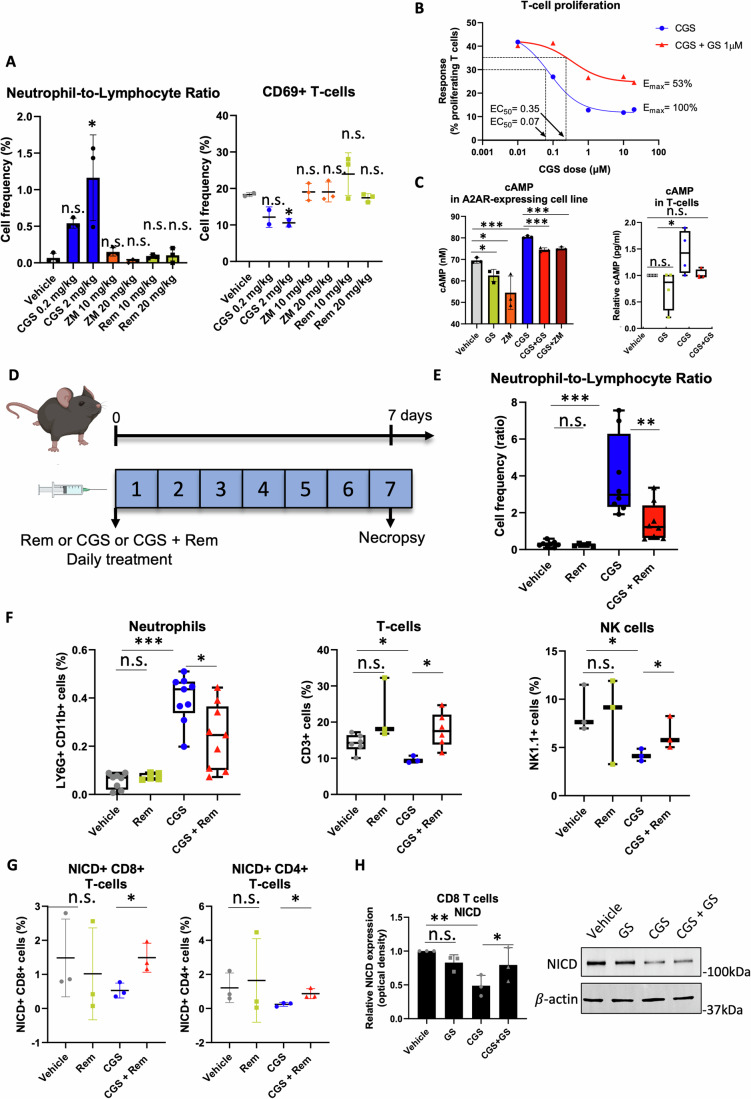
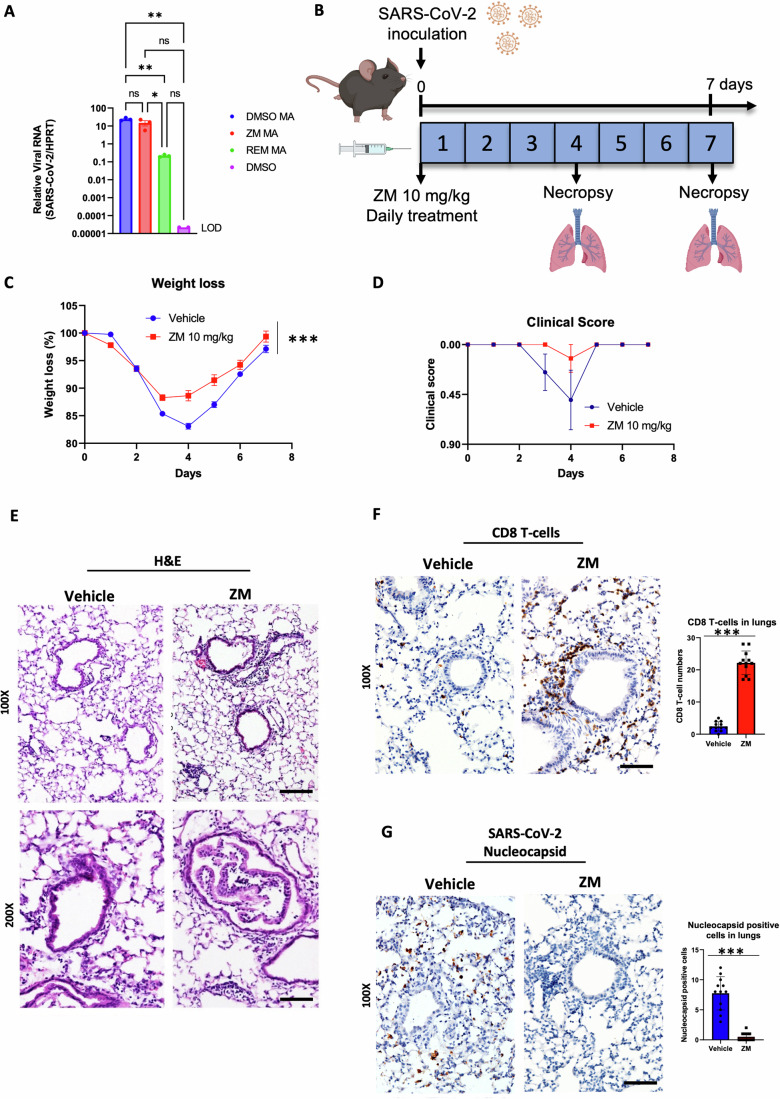
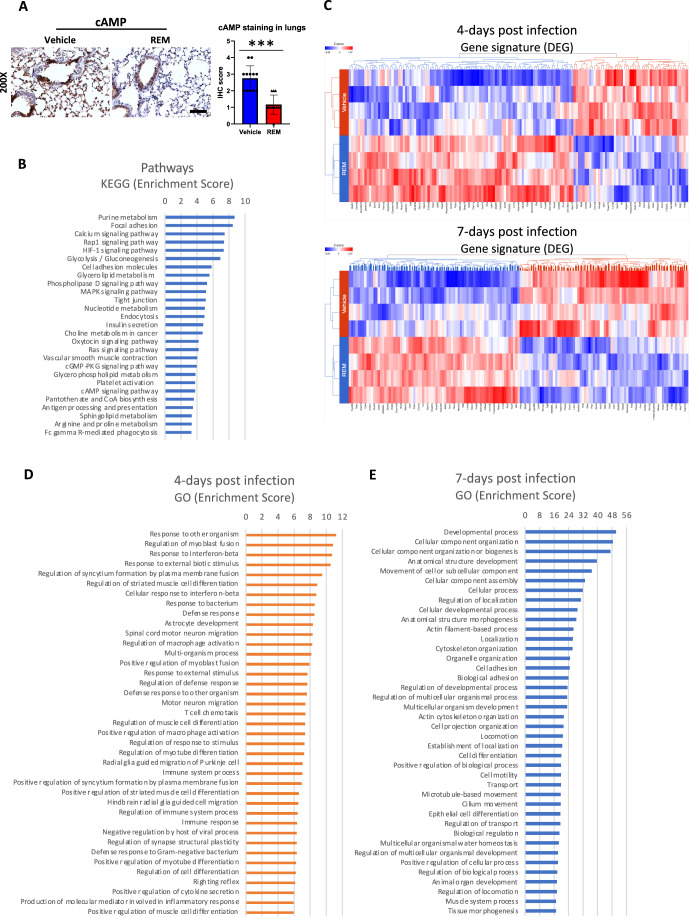
The COVID-19 pandemic reminded us of the urgent need for new antivirals to control emerging infectious diseases and potential future pandemics. Immunotherapy has revolutionized oncology and could complement the use of antivirals, but its application to infectious diseases remains largely unexplored. Nucleoside analogs are a class of agents widely used as antiviral and anti-neoplastic drugs. Their antiviral activity is generally based on interference with viral nucleic acid replication or transcription. Based on our previous work and computer modeling, we hypothesize that antiviral adenosine analogs, like remdesivir, have previously unrecognized immunomodulatory properties which contribute to their therapeutic activity. In the case of remdesivir, we here show that these properties are due to its metabolite, GS-441524, acting as an Adenosine A2A Receptor antagonist. Our findings support a new rationale for the design of next-generation antiviral agents with dual - immunomodulatory and intrinsic - antiviral properties. These compounds could represent game-changing therapies to control emerging viral diseases and future pandemics.

Keywords: Adenosine; Adenosine Analogs; Antivirals; Immunotherapy; Remdesivir.


Conflict of interest statement

The authors declare no competing interests.

Figures

Figure 1
Figure 1. Molecular docking analysis of remdesivir metabolite GS-441524 binding to A2AR.
(A, B) Computational simulation of GS (PubChem ID 44468216) binding to A2AR (PDB ID: 2YDO) using Pymol and Autodock Vina. GS-A2AR Conformation 1 (A) and Conformation 2 (B) are shown with hydrogen bonds formed with E169, N253, S277, and H278. The table shows the calculated binding affinity (ΔG, kcal/mol) for A2AR. (C) Crystallized structure of adenosine binding to A2AR (PDB ID: 2YDO). (D) Detailed presentations of adenosine and GS binding to A2AR showing the conformations from three different angles: left panels, vertical view; middle panels, 90o horizontal rotation of left panel; right panel, top view of the middle panel.
Figure 2
Figure 2. The remdesivir metabolite GS-441524 counteracts the immunological effects of an A2AR agonist.
(A) Left panel: neutrophil-to-lymphocyte ratio (NLR) measured by flow cytometry of lymphocytes and neutrophils in the blood of C57BL/6 mice (n = 3 mice per group) after 7-days treatment with different doses of CGS, ZM, and REM. Right panel: frequency of splenic CD69+ CD8+ T-cells in C57BL/6 mice (n = 3 mice per group) after 7-days treatment with different doses of CGS, ZM, and REM. (B) Dose-response curve of proliferation in anti-CD3/28-activated mouse CD8+ T-cells treated with increasing doses of CGS alone or in combination with a fixed dose of GS (1 uM). (C) Left panel: cAMP production measured by luciferase reporter assay in an A2AR-expressing cell line treated with 0.1 µM CGS or 1 µM GS or 1 µM ZM or CGS + GS and CGS + ZM combinations (n = 3 cultures). Right panel: cAMP production measured by ELISA in anti-CD3/28-activated mouse CD8+ T-cells after treatment with 1 µM CGS or 1 µM GS or a combination of both (n = 4 cultures). (D) Diagram of the experimental timeline. C57BL/6 mice were treated with 10 mg/kg REM or 2 mg/kg CGS or a combination of 2 mg/kg CGS and 10 mg/kg REM through intraperitoneal injection daily for 7 days. Mice were sacrificed on day 7. Blood and spleen were collected for further analysis. (E) NLR determined by flow cytometry analysis of lymphocytes and neutrophils in mouse blood, after 7 days of treatment with REM (n = 5 mice) or CGS (n = 8 mice) or a combination of CGS and REM (n = 8 mice) vs. vehicle (n = 8 mice). Frequencies of neutrophils and CD8+ T-cells were analyzed by flow cytometry and NLR was calculated. (F) Left panel: frequency of neutrophils in mouse blood after treatment with REM (n = 5 mice) or CGS (n = 9 mice) or combination of CGS and REM (n = 9 mice) vs. vehicle (n = 5 mice); middle panel: frequencies of splenic T-cells after treatment with REM (n = 3 mice) or CGS (n = 3 mice) or combination of CGS and REM (n = 6 mice) vs. vehicle (n = 6 mice); right panel: frequencies of NK cells (n = 3 mice) after treatment with REM or CGS or combination of CGS and REM vs. vehicle. (G) Frequencies of Notch1+ CD8+ (left) and CD4+ (right) T-cells in mouse spleens (n = 3 mice). Cell frequency was measured by flow cytometry of blood or spleen samples from mice treated with CGS or a combination of CGS and REM. (H) Right panel: Western blot of Notch intracellular domain (NICD) from mouse primary CD8+ T-cells after treatment with 1 µM CGS or 1 µM GS or a combination of both. Left panel: Normalized band intensity (optical density) was quantified and normalized with β-actin (n = 3 cultures/blots). Data information: “n” indicates biological replicates. The box plots (C, E, F) show minima, maxima, mean, 75 and 25 percentiles. Data were presented as mean ± SD. Statistical significance was calculated by one-way ANOVA with Bonferroni correction. *P ≤ 0.05, **P ≤ 0.01, ***P ≤ 0.001., ns non-significant. Source data are available online for this figure.
Figure 3
Figure 3. Treatment with an A2AR antagonist promotes T-cell infiltration and viral clearance in the lungs of mice infected with SARS-CoV-2.
(A) qRT-PCR titers of supernatants from SARS-CoV-2-infected Vero cells treated with 5 µM REM or 5 µM ZM vs. vehicle vs. a non-infected vehicle control (n = 3 cultures per treatment). (B) Diagram of the experimental timeline. C57BL/6 mice (n = 8 mice for each group) were infected with 105 PFU SARS-CoV-2 through intranasal inoculation on day 0. The A2AR antagonist ZM (10 mg/kg) or vehicle were intraperitoneally administered to mice daily for 7 days. Mice were sacrificed on day 4 and day 7 and lungs were subject to analysis. (C) Body weight change in mice for each group over time (n = 8 mice for each group). (D) Clinical scores for each group over time (n = 8 mice for each group). (E) H&E staining, (F) IHC and quantification of CD8+ T-cells (n = 12 image fields), and (G) IHC and quantification of SARS-CoV-2 nucleocapsid positive cells (n = 12 image fields) in mouse lungs at day 4. Data information: “n” indicates biological replicates. Data were presented as mean ± SD. Scale bars = 50 and 100 µm for 200x and 100x microscopic images, respectively. Statistical significance in qRT-PCR and IHC quantifications was calculated by two-tailed unpaired t-test and in mouse weight by non-linear regression. ***P ≤ 0.001., ns non-significant. Source data are available online for this figure.
Figure 4
Figure 4. Treatment with an A2AR antagonist stimulates T-cell functions.
(A) Western blot of Notch intracellular domain (NICD) in mouse CD8+ T-cells treated with the A2AR agonist CGS or A2AR antagonist ZM or a combination of both. Band intensity (O. D.) was quantified and normalized with β-actin. A representative blot is shown (n = 3 blots/cultures). (B) NICD-positive CD4+ T-cells were measured using flow cytometry after treatment with CGS or ZM or a combination of both (n = 3 cultures). (C) Mouse CD8+ T-cell (n = 4 cultures) and (D) CD4+ T-cell (n = 3 cultures) proliferation measurement after treatment with CGS or ZM or a combination of both. The percentage of proliferating cells was measured by CFSE staining and flow cytometry. (E) IFN-γ production was measured by ELISA in supernatants of mouse CD8+ T-cells treated with CGS or ZM or a combination of both (n = 3 cultures). (F) Flow cytometry analysis of IFN-γ-producing Th1 CD4+ T-cells (n = 3 cultures), (G) IL-10-producing Th2 CD4+ T-cells (n = 4 cultures), (H) IL-17-producing Th17 CD4+ T-cells treated with CGS or ZM or combination of both (n = 3 cultures). The drug concentration used is 1 µM for all treatments. All assays were performed in cultures of anti-CD3/28-activated primary immune cells isolated from uninfected C57BL/6 mice. Data information: “n” indicates biological replicates. Data were presented as mean ± SD. Statistical significance was calculated by one-way ANOVA with Bonferroni correction. *P ≤ 0.05, **P ≤ 0.01, ***P ≤ 0.001., ns non-significant. Source data are available online for this figure.
Figure 5
Figure 5. Remdesivir promotes antiviral immune responses which contribute to the clearance of SARS-CoV-2.
(A) Diagram of the experimental timeline. C57BL/6 mice (n = 8 mice for each group) were infected with 105 pfu SARS-CoV-2 through intranasal inoculation on day 0. REM (10 mg/kg) or vehicle was administered to mice daily for 7 days. Mice were sacrificed on day 4 and day 7 and lungs were subject to analysis. (B) Mouse body weight change for each group over time (n = 8 mice per group). (C) Left panel: viral clearance rate based on viral copy number measured by RT-PCR in mouse lungs at different post-infection times (n = 4 mice). Right panel: IHC labeling of SARS-CoV-2 nucleocapsid positive cells in the lungs of mice sacrificed on day 4. (DG) Lung sections of mice sacrificed on day 4 were stained with (D) H&E and immunolabeled for (E) CD8, (F) Ly6G, and (G) Neutrophil elastase. Representative pictures are shown. (H) GESA transcriptional analysis of IFN-γ response pathway (left) and IL-2-STAT5 pathway (right) between control and REM-treated groups sacrificed on day 4 (Class A: vehicle group; Class B: REM-treated group). (I) A number of CD8+ T-cells in the lungs in vehicle and REM-treated mice were quantified in IHC lung sections (n = 12 image fields). (J) The neutrophil-to-lymphocyte ratio in the blood of mice sacrificed on day 4 (n = 4 mice). The box plot shows minima, maxima, mean, 75, and 25 percentiles. Data information: “n” indicates biological replicates. Data were presented as mean ± SD. Scale bars = 50 and 100 µm for 200x and 100x microscopic images, respectively. Statistical significance was calculated by a two-tailed unpaired t-test (C, I, J) or non-linear regression (B). *P ≤ 0.05, **P ≤ 0.01, ***P ≤ 0.001. Source data are available online for this figure.
Figure 6
Figure 6. Gene and pathway signatures in remdesivir-treated mice reflect A2AR antagonism, immune responses, and tissue repair.
(A) IHC labeling and quantification of cAMP in the lungs of vehicle and REM-treated groups (n = 12 image fields). Scale bar = 50 µm. (B) KEGG pathway analysis of significantly changed pathways in the lungs of REM treated vs. vehicle group. (C) Heatmaps of differentially expressed genes (DEG) in the lungs of vehicle and REM-treated groups on day 4 (top) and day 7 (bottom) (n = 4 mice per group per time point). (D, E) Gene Ontology (GO) analysis of the top 40 significantly changed pathways in the lungs of REM treated vs. vehicle group on day 4 (left) and day 7 (right). Data information: “n” indicates biological replicates. Data were presented as mean ± SD. Statistical significance was calculated by a two-tailed unpaired t-test. ***P ≤ 0.001. Source data are available online for this figure.
Figure EV1
Figure EV1. Structure similarities and molecular docking simulations between GS-441524 and adenosine.
(A) Crystallized structure (Top) and simulated structure (bottom) of adenosine binding to A2AR. (B) Structure of adenosine (PubChem ID 60961) (top) and GS (PubChem ID 44468216) (bottom). (C) Nine simulated states of GS binding to A2AR. Calculated binding affinities (ΔG, kcal/mol) are shown in the bottom table.
Figure EV2
Figure EV2. Detailed analysis of molecular bonds and interaction between GS-441524 and A2AR.
(A) Detailed presentation of Fig. 3D showing the surface (mesh) of E169, N253, S277, and H278 residues in the A2AR active site in contact with GS. (B) 2D presentation of detailed molecular bonds and interactions of GS confirmation 1 and 2 (left and middle panels) or adenosine (right panel) with A2AR predicted using Discovery Studio software.
Figure EV3
Figure EV3. Molecular docking between GS-441524 and A1R.
(A) Simulated binding of GS to A1R (PDB ID: 6D9H). (B) Simulated binding of adenosine to A1R. (C) Calculated binding affinities (ΔG, kcal/mol) of GS and adenosine to A1R.
Figure EV4
Figure EV4. Molecular docking between GS-441524 and A2BR.
(A) Simulated binding of GS to A2BR (PDB ID: 8HDP). (B) Simulated binding of adenosine to A2BR. (C) Calculated binding affinities (ΔG, kcal/mol) of GS and adenosine to A2BR.
Figure EV5
Figure EV5. Clinical and immunological readouts in SARS-CoV-2-infected mice treated with remdesivir.
(A) Clinical score of SARS-CoV-2-infected mice treated with vehicle or 10 mg/kg REM over 7 days (n = 8 mice per group). (B) Table of disease manifestations and corresponding clinical score. (C) Quantification of SARS-CoV-2 nucleocapsid positive cells, neutrophils, and neutrophil elastase staining in IHC of lung sections from SARS-CoV-2-infected mice treated with REM vs. vehicle (n = 12 image fields per staining). (D, E) frequencies of (D) T-cells and (E) neutrophils in the lungs after treatment with REM vs. vehicle (n = 4 mice per group). The box plots show minima, maxima, mean, 75, and 25 percentiles. (F) GESA transcriptomic analysis of lung RNA from vehicle group vs. REM-treated group. (Class A: vehicle group. Class B: REM-treated group). Data were presented as mean ± SEM. Data information: “n” indicates biological replicates. Data were presented as mean ± SD. Statistical significance was calculated by one-way ANOVA with Bonferroni correction (A) or two-tailed unpaired t-test (CE). *P ≤ 0.05, ***P ≤ 0.001., ns non-significant.

References

    1. Ahern DJ, Ai Z, Ainsworth M, Allan C, Allcock A, Angus B, Ansari MA, Arancibia-Cárcamo CV, Aschenbrenner D, Attar M et al (2022) A blood atlas of COVID-19 defines hallmarks of disease severity and specificity. Cell 185:916–938.e958 10.1016/j.cell.2022.01.012 - DOI - PMC - PubMed
    1. Amstutz A, Speich B, Mentré F, Rueegg CS, Belhadi D, Assoumou L, Burdet C, Murthy S, Dodd LE, Wang Y et al (2023) Effects of remdesivir in patients hospitalised with COVID-19: a systematic review and individual patient data meta-analysis of randomised controlled trials. Lancet Respir Med 11:453–464 10.1016/S2213-2600(22)00528-8 - DOI - PMC - PubMed
    1. Antonioli L, Blandizzi C, Pacher P, Haskó G (2013) Immunity, inflammation and cancer: a leading role for adenosine. Nat Rev Cancer 13:842–857 10.1038/nrc3613 - DOI - PubMed
    1. Barnes BJ, Adrover JM, Baxter-Stoltzfus A, Borczuk A, Cools-Lartigue J, Crawford JM, Daßler-Plenker J, Guerci P, Huynh C, Knight JS et al (2020) Targeting potential drivers of COVID-19: neutrophil extracellular trapsNeutrophil extracellular traps in COVID-19. J Exp Med 217:e20200652 10.1084/jem.20200652 - DOI - PMC - PubMed
    1. Beigel JH, Tomashek KM, Dodd LE, Mehta AK, Zingman BS, Kalil AC, Hohmann E, Chu HY, Luetkemeyer A, Kline S et al (2020) Remdesivir for the treatment of Covid-19 — final report. N Engl J Med 383:1813–1826 10.1056/NEJMoa2007764 - DOI - PMC - PubMed

MeSH terms