. 2024 Sep;27(9):1844-1857.
doi: 10.1038/s41593-024-01697-1. Epub 2024 Jul 15.

Unlocking opioid neuropeptide dynamics with genetically encoded biosensors

Affiliations

Unlocking opioid neuropeptide dynamics with genetically encoded biosensors

Chunyang Dong et al. Nat Neurosci. 2024 Sep.

Abstract

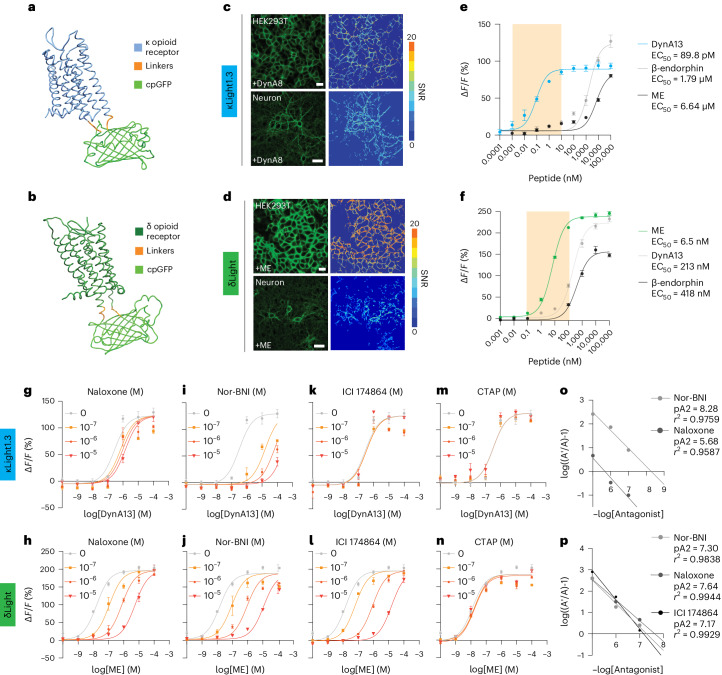
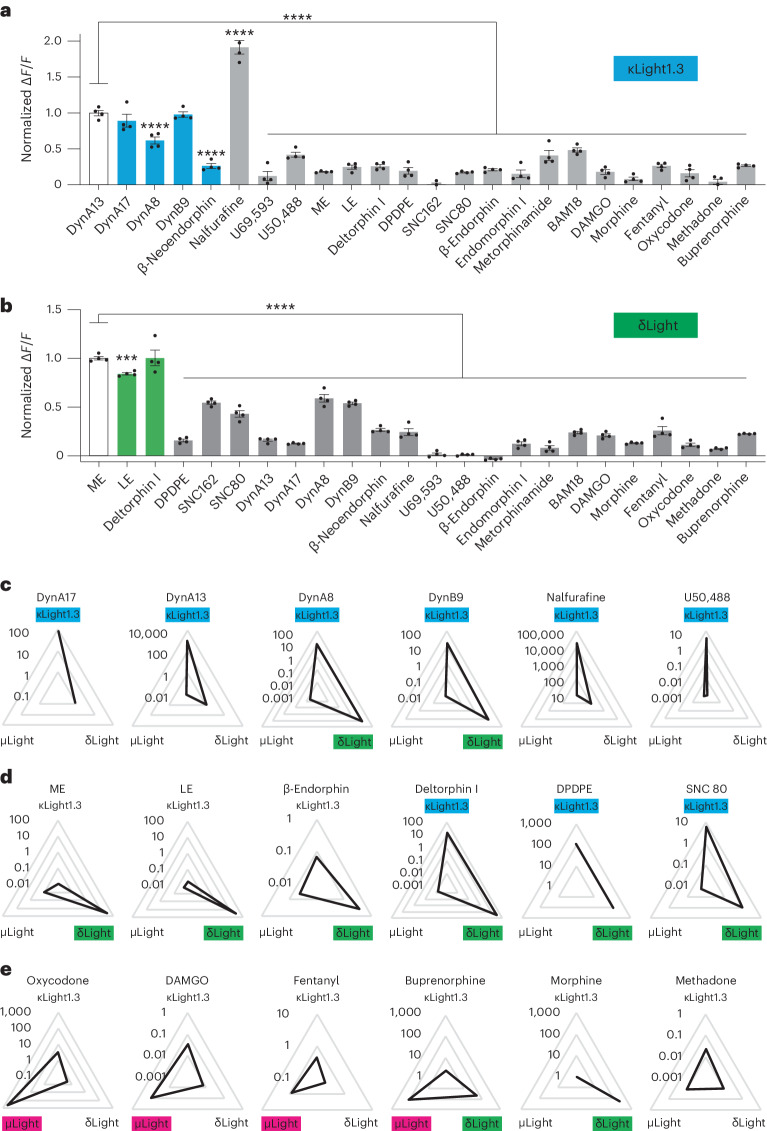
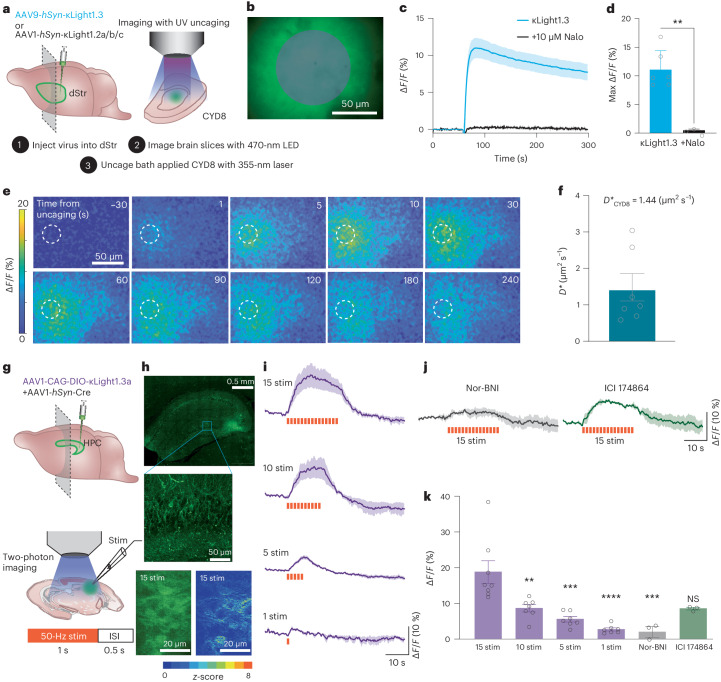
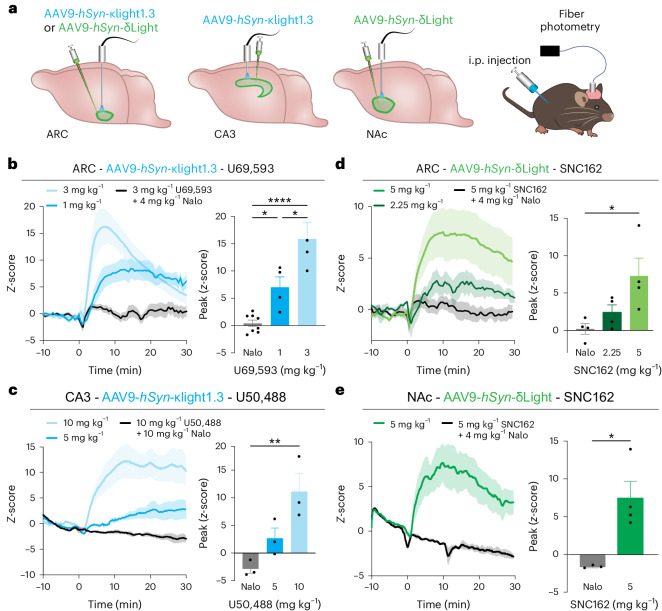
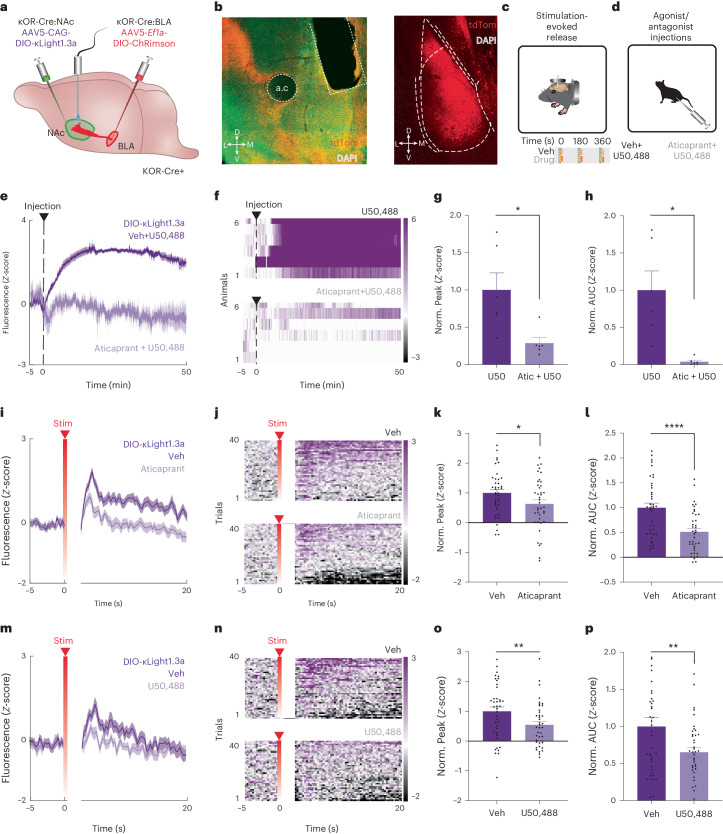
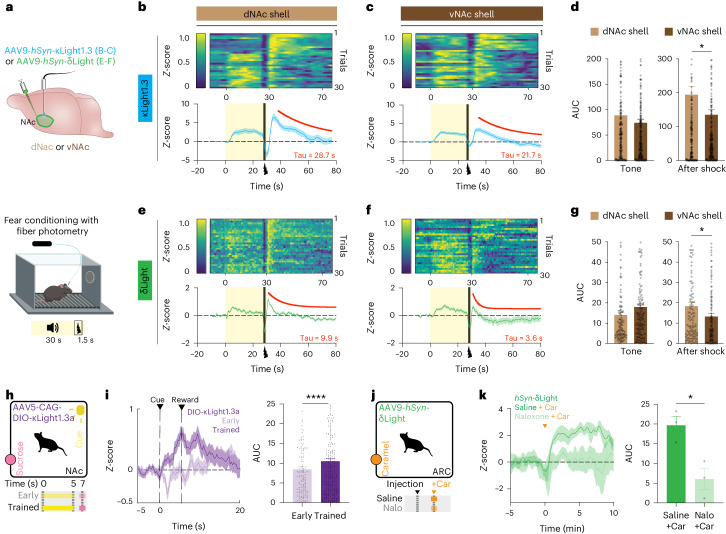
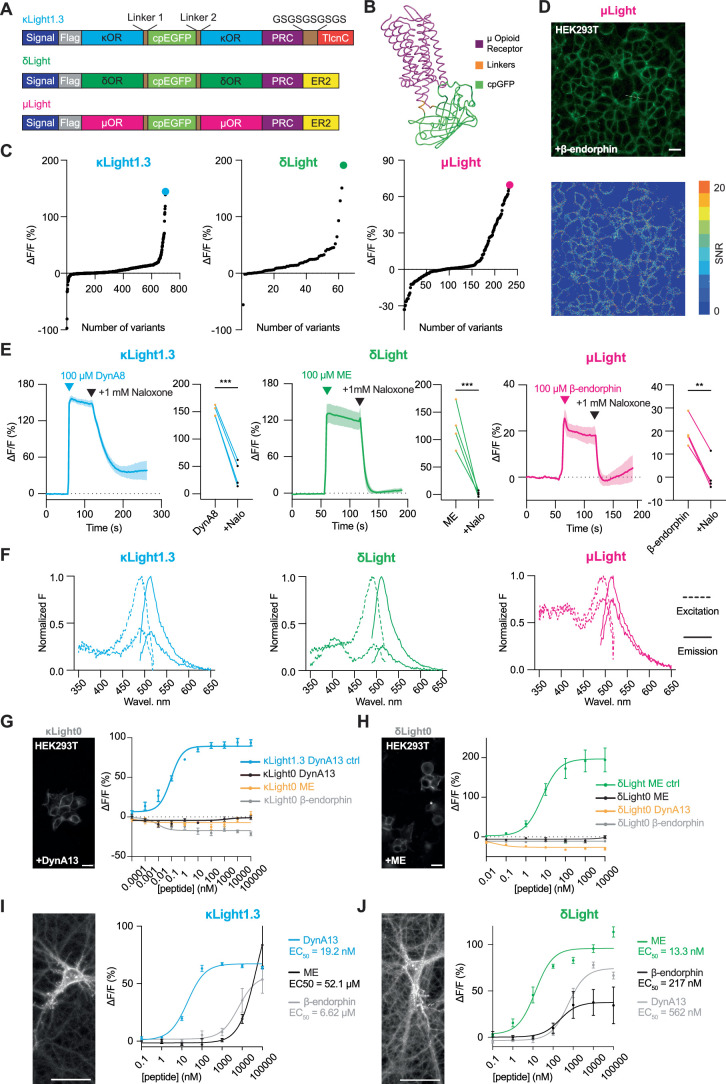
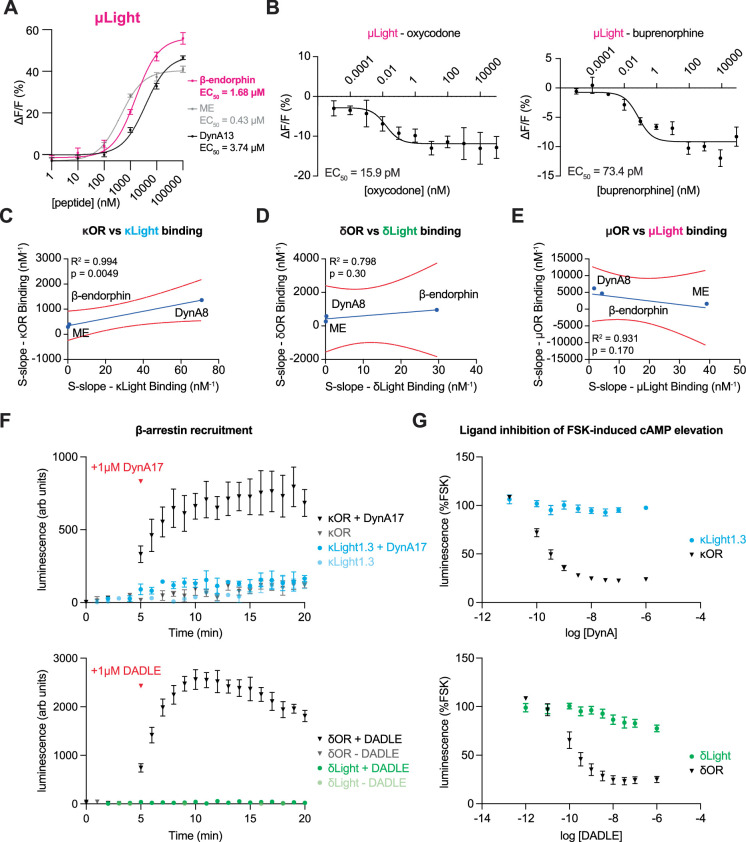
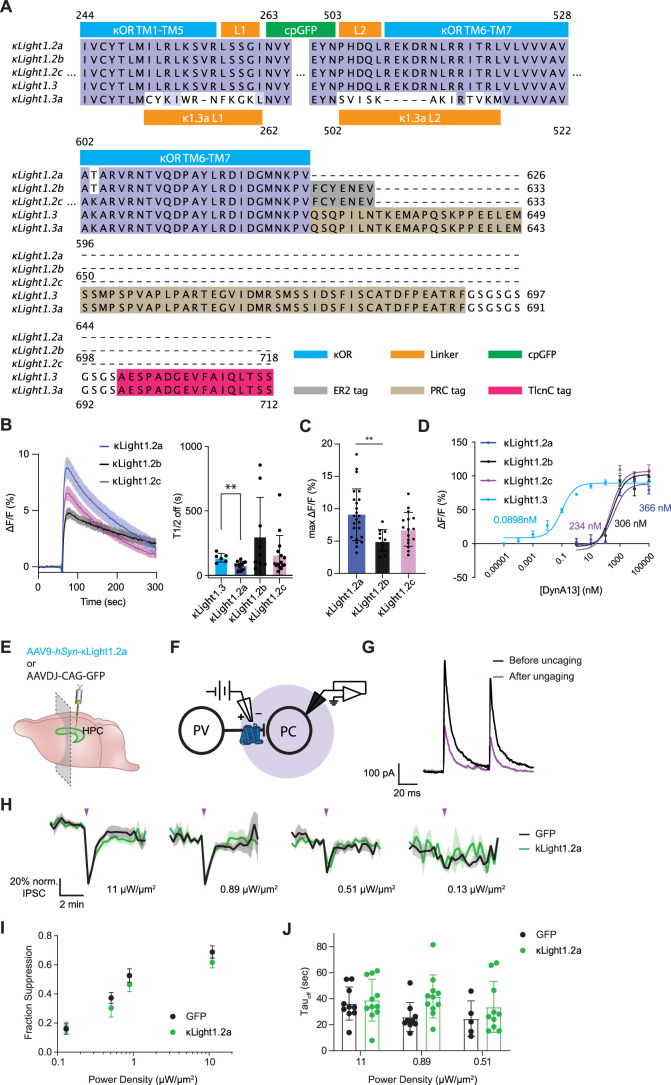
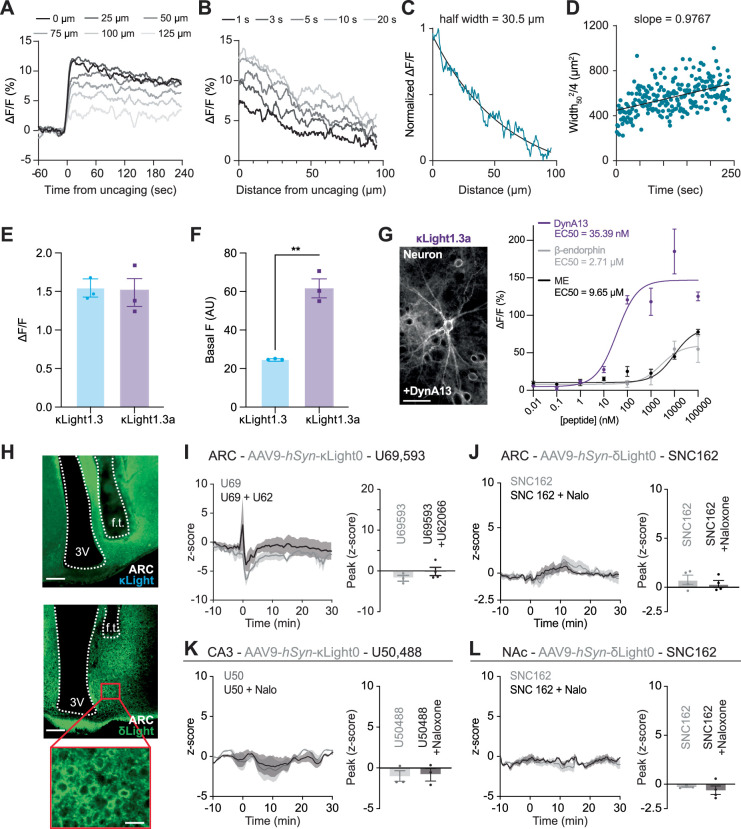
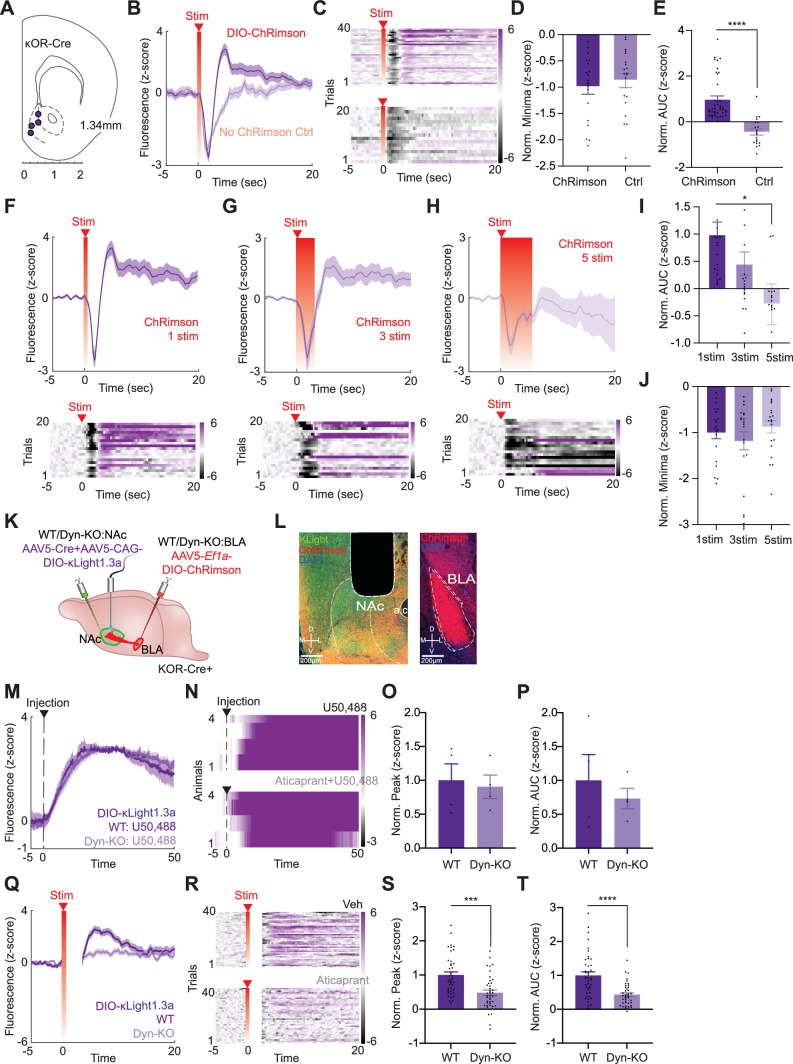
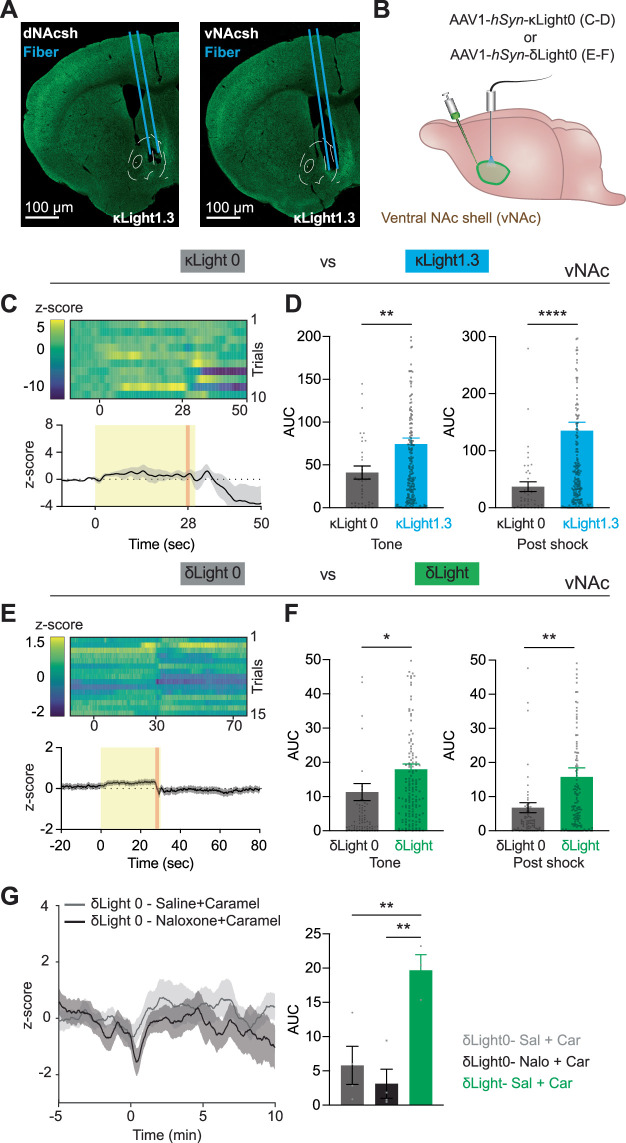
Neuropeptides are ubiquitous in the nervous system. Research into neuropeptides has been limited by a lack of experimental tools that allow for the precise dissection of their complex and diverse dynamics in a circuit-specific manner. Opioid peptides modulate pain, reward and aversion and as such have high clinical relevance. To illuminate the spatiotemporal dynamics of endogenous opioid signaling in the brain, we developed a class of genetically encoded fluorescence sensors based on kappa, delta and mu opioid receptors: κLight, δLight and µLight, respectively. We characterized the pharmacological profiles of these sensors in mammalian cells and in dissociated neurons. We used κLight to identify electrical stimulation parameters that trigger endogenous opioid release and the spatiotemporal scale of dynorphin volume transmission in brain slices. Using in vivo fiber photometry in mice, we demonstrated the utility of these sensors in detecting optogenetically driven opioid release and observed differential opioid release dynamics in response to fearful and rewarding conditions.


Conflict of interest statement

L.T. is a co-founder of Seven Biosciences. All other authors declare no competing interests.

Figures

Fig. 1
Fig. 1. Development of the opioid sensors.
a,b, Simulated structure of κLight (a) and δLight (b). c,d, Representative images of four independent transient transfections of κLight1.3 (c) and δLight (d) in HEK293T cells and cultured hippocampal neurons. Heat map indicates SNR upon addition of DynA8 (100 μM) or ME (100 μM). Scale bar, 20 μm (cells) and 50 μm (neurons). e,f, In situ titration of κLight1.3 (e) and δLight (f)-expressing HEK293T cells respond to ligands in a concentration-dependent manner (DynA13, blue; β-endorphin, gray; ME, black). Error bars represent the s.e.m. The highlighted area corresponds to a concentration range from 1 pM to 10 nM or 100 pM to 100 nM. Dyn, dynorphin. g,h, Schild plot of κLight1.3 (g) and δLight (h) dose response with 100 nM, 1 μM and 10 μM of naloxone. i,j, Schild plot of κLight1.3 (i) and δLight (j) dose response with 100 nM, 1 μM and 10 μM of Nor-BNI. k,l, Schild plot of κLight1.3 (k) and δLight (l) dose response with 100 nM, 1 μM and 10 μM of ICI 174864. m,n, Schild plot of κLight1.3 (m) and δLight (n) dose response with 100 nM, 1 μM and 10 μM of CTAP. o, Combined Schild regression with Nor-BNI and naloxone on κLight1.3. p, Combined Schild regression with Nor-BNI, naloxone and ICI 174864 on δLight. eo, n = 4. Error bars represent the s.e.m.
Fig. 2
Fig. 2. Pharmacological characterization of κLight and δLight.
a, Normalized ΔF/F of κLight1.3 upon addition of the listed compounds (10 nM). ΔF/F of all compounds are normalized to DynA13 (DynA13: 1 ± 0.03, DynA17: 0.89 ± 0.08, DynA8: 0.61 ± 0.04, DynB9: 0.97 ± 0.03, β-neoendorphin: 0.26 ± 0.03, nalfurafine: 1.91 ± 0.09, U69,593: 0.12 ± 0.06, U50,488: 0.42 ± 0.03, ME: 0.18 ± 0.005, LE: 0.24 ± 0.02, deltorphin I: 0.26 ± 0.02, DPDPE: 0.19 ± 0.04, SNC162: 0.009 ± 0.02, SNC 80: 0.17 ± 0.008, β-endorphin: 0.21 ± 0.01, endomorphin I: 0.15 ± 0.05, metorphinamide: 0.41 ± 0.06, BAM18: 0.48 ± 0.03, DAMGO: 0.17 ± 0.03, morphine: 0.08 ± 0.02, fentanyl: 0.26 ± 0.02, oxycodone: 0.16 ± 0.04, methadone: 0.04 ± 0.03, buprenorphine: 0.27 ± 0.01; n = 4 wells each. ****P < 0.0001, one-way analysis of variance (ANOVA) compared to DynA13 with Sidak’s multiple-comparisons test). Error bars represent the s.e.m. b, Normalized ΔF/F of δLight upon addition of the listed compounds (10 nM). ΔF/F of all compounds were normalized to ME (ME: 1 ± 0.01, LE: 0.84 ± 0.01, deltorphin I: 1 ± 0.07, DPDPE: 0.15 ± 0.01, SNC162: 0.54 ± 0.02, SNC80: 0.42 ± 0.03, DynA13: 0.15 ± 0.01, DynA17: 0.12 ± 0.004, DynA8: 0.58 ± 0.03, DynB1-9: 0.53 ± 0.01, β-neoendorphin: 0.26 ± 0.01, nalfurafine: 0.24 ± 0.03, U69,593: 0.014 ± 0.014, U50,488: 0.009 ± 0.004, β-endorphin: −0.03 ± 0.004, endomorphin I: 0.12 ± 0.01, metorphinamide: 0.07 ± 0.02, BAM18: 0.23 ± 0.01, DAMGO: 0.2 ± 0.01, morphine: 0.12 ± 0.005, fentanyl: 0.25 ± 0.04, oxycodone: 0.11 ± 0.01, methadone: 0.06 ± 0.006, buprenorphine: 0.22 ± 0.003; n = 4 wells each. ****P < 0.0001, ***P = 0.0006, one-way ANOVA compared to DynA13 with Dunnett’s multiple-comparisons test). Error bars represent the s.e.m. ce, log s-slope values (in nM−1) of κOR (c), δOR (d) and µOR (e)-specific ligands plotted in triangle plots (κLight, blue; δLight, green; µLight, magenta). Higher s-slope values are located on the outer triangle. Enk, enkephalin.
Fig. 3
Fig. 3. κLight1.3 characterization in acute brain slices.
a, Schematics shows imaging of striatal acute brain slices and photo-uncaging CYD8 with a 355-nm laser. b, Time-lapse images (semitransparent gray circle shows the field of UV illumination). Scale bar, 50 μm. c, Response of κLight1.3 to CYD8 photo-uncaging (blue, n = 6 slices) in the absence and presence of naloxone (Nalo, 10 μM; black, n = 3 slices). Solid lines represent the mean, and the shaded areas represent the s.e.m. d, Quantification of the peak ΔF/F evoked by CYD8 photo-uncaging. κLight1.3 (blue); 11.1% ± 1.36%, n = 6, + naloxone (black); 0.51% ± 0.12%, n = 3, P = 0.0011, two-tailed unpaired t-test. e, Time course of κLight1.2a after CYD8 (5 μM) photo-uncaging in the dStr. The dashed circle indicates the site of UV illumination. Heat map indicates ΔF/F (%). Scale bar, 50 µm. f, Summary of experiments determining the apparent diffusion coefficient, n = 7 slices from 4 mice. D* = 1.439 ± 0.37 μm2 s−1. g, Schematics show local electrical stimulation of hippocampal slice with trains of 1-s, 50-Hz stimuli with a 0.5-s interstimulus interval. HPC, hippocampus; ISI, interstimulation interval. h, Representative image showing expression of κLight1.3a in CA3 (top; scale bar, 0.5 mm) and zoomed in to visualize the localization of localization κLight1.3a to the membranes of neuronal processes in the dentate gyrus (middle; scale bar, 50 μm). Representative two-photon field of view from 15 stimulations (bottom) indicating the averaged intensity across all frames and z-score of responses in the representative field of view; scale bar, 20 μm. i,j, Average κLight1.3a responses to various electrical stimulation in the absence (i) and presence (j) of antagonists, Nor-BNI (gray) and ICI 174864 (green). Solid lines represent the mean, and shaded areas represent the s.e.m. k, Bar graph summarizing the peak fluorescence response to each stimulation condition. 15 stim (n = 8 slices): 14.3% ± 2.4%, 10 stim (n = 7 slices): 6.62% ± 0.8%, 5 stim (n = 7 slices): 4.28% ± 0.6%, 1 stim (n = 7 slices): 2.12% ± 0.3%, Nor-BNI (100 µM, n = 3 slices): 1.57% ± 1.2%, ICI 174864 (100 µM, n = 3 slices): 6.44% ± 0.3%. Ordinary one-way ANOVA with Bonferroni’s multiple-comparisons test, individual conditions compared to 15 stim, 15 stim versus 10 stim: **P = 0.044, 15 stim versus 5 stim: ***P = 0.0001, 15 stim versus 1 stim: ****P < 0.0001, 15 stim versus Nor-BNI: ***P = 0.0002, 15 stim versus ICI 174864: not significant (NS), P = 0.0525. Error bars represent the s.e.m.
Fig. 4
Fig. 4. In vivo drug pharmacology imaged with κLight and δLight.
a, Experimental schematics of κLight1.3 and δLight injection in the hypothalamus (ARC), the hippocampal CA3 and the NAc, followed by imaging with fiber photometry during drug injection. b, κLight1.3 response in ARC to different doses of U69,593, 3 mg per kg body weight (light blue), 1 mg per kg body weight (blue) and 3 mg per kg body weight U69,593 + 4 mg per kg body weight naloxone (black); n = 7 animals. Solid lines represent the mean, and the shaded area represents the s.e.m. Bar graph indicating the peak z-score of each response, 3 mg per kg body weight + naloxone: 0.4% ± 0.6%, 1 mg per kg body weight: 7.0% ± 1.9%, 3 mg per kg body weight: 15.9% ± 3.1%, ordinary one-way ANOVA with Tukey’s multiple-comparisons test, 1 versus 3 *P = 0.012, 1 versus Nalo *P = 0.029, 3 versus Nalo ****P < 0.0001. c, κLight1.3 response to different doses of U50,488 in CA3, 10 mg per kg body weight (light blue), 5 mg per kg body weight (blue) and 10 mg per kg body weight U50,488 + 10 mg per kg body weight naloxone (black) in CA3; n = 3 animals. Solid lines represent the mean, and shaded areas represent the s.e.m. Bar graph indicating the peak z-score of each response, 10 mg per kg body weight + naloxone: −2.9% ± 0.8%, 5 mg per kg body weight: 2.7% ± 1.8%, 10 mg per kg body weight: 11.1% ± 3.2%, ordinary one-way ANOVA with Dunnett’s multiple-comparisons test, **P = 0.0072. d,e, δLight response to different doses of SNC162 in ARC (d) and NAc (e), 5 mg per kg body weight (light green), 2.25 mg per kg body weight (green) and 5 mg per kg body weight SNC162 + 4 mg per kg body weight naloxone (black) in ARC and NAc; n = 4 animals. Solid lines represent the mean, and shaded areas represent the s.e.m. Bar graph indicating the peak z-score of each response; in ARC: 0.2% ± 0.7%, 2.25 mg per kg body weight: 2.4% ± 1.0%, 5 mg per kg body weight: 7.3% ± 2.4%, ordinary one-way ANOVA with Tukey’s multiple-comparisons test, *P = 0.0258; in NAc: 1.7 ± 0.1%, 5 mg per kg body weight: 7.5% ± 2.2%; two-tailed unpaired t-test, *P = 0.0185. In be, error bars represent the s.e.m.
Fig. 5
Fig. 5. Imaging optogenetically stimulated dynorphin release with κLight1.3a.
a, Schematic showing κLight1.3a-expressed NAcSh and ChRimson into the BLA of κOR-Cre+ mice. b, Representative ×20 coronal image (left) showing expression of κLight1.3a (green), ChRimson (red), DAPI (white) and fiber placement in the NAcSh (left; scale bar, 200 μm), and ChRimson (red) and DAPI (white) in the BLA (right; scale bar, 200 μm) from six animals, which showed similar results. c,d, Schematic of in vivo head-fixed stimulation-evoked dynorphin release (stimuli occurred at 0, 180 and 360 s; c) and agonist/antagonist drug injection (10 mg per kg body weight U50,488 and 3 mg per kg body weight aticaprant + 10 mg per kg body weight U50,488; d) experiments. e,f, Mean (e) and heat map (f) of κLight1.3a activity either averaged across all animals (e) or from individuals (f) following i.p. injections of vehicle (veh) + U50,488 (dark) and aticaprant + U50,488 (light; n = 6 animals). Solid lines represent the mean, and shaded areas represent the s.e.m. g,h, Normalized peak fluorescence (g) and AUC (h) of single trials during the injection period (0–50 min; U50: 1 ± 0.23, Atic + U50: 0.29 ± 0.07; two-tailed paired t-test, *P = 0.034, *P = 0.014, n = 6 animals). Data are represented as the mean ± s.e.m. Atic, aticaprant; U50, U50,488. i, Mean κLight1.3a activity averaged across all trials following vehicle (dark) and aticaprant (light) treatment during ChRimson stimulation-evoked trials (n = 4 animals). Solid lines represent the mean, and shaded areas represent the s.e.m. j, Heat map raster plot of κLight1.3a activity averaged across all trials following vehicle (top) and aticaprant (bottom) treatment during ChRimson stimulation-evoked trials (n = 4 animals) displayed in ascending trial order by average activity across trials. ‘Stim’ indicates the time of stimulus application. k,l, Normalized peak fluorescence (k) and AUC of single trials (l) across vehicle and aticaprant treatment during all ChRimson stimulation-evoked trials (0–20 s; veh: 1 ± 0.12, Atic: 0.63 ± 0.14; two-tailed paired t-test, *P = 0.037, ****P < 0.000, n = 4 animals). Data are represented as the mean ± s.e.m. m,n, Mean (m) and heat map raster plot (n) of recorded κLight1.3a activity averaged across all trials following vehicle (dark) and U50,488 (light) treatment during ChRimson stimulation-evoked trials (n = 4 animals). Solid lines represent the mean, and shaded areas represent the s.e.m. o,p, Normalized peak fluorescence (o) and AUC of single trials (p) across vehicle and U50,488 treatment during all ChRimson stimulation-evoked trials (0–20 s; veh: 1 ± 0.15, U50: 0.55 ± 0.12; two-tailed paired t-test, **P = 0.002, **P = 0.007, n = 4 animals). Data are represented as the mean ± s.e.m.
Fig. 6
Fig. 6. Imaging dynorphin and enkephalin dynamics during aversive and rewarding behavior.
a, Schematics show expression of κLight1.3 or δLight in the dNAc shell or the vNAc shell (top), followed by a fear conditioning protocol during fiber photometry recording. b,c, κLight1.3 response in the dNAc (b) and the vNAc (c): Top, sorted shock trials averaged across animals from top to bottom in chronological order (trial 1 at the top, trial 30 at the bottom). Bottom, average trace of κLight1.3 response (blue) during fear conditioning, tone (0–30 s, yellow shaded area) and shock (27.5–29 s, black). Solid blue line represents the mean, and the shaded area represents the s.e.m. dNAc, n = 7 animals; vNAc, n = 8 animals. One-phase decay fit from 35 s to 80 s (red). Tau indicates the decay constant. d, AUC of single trials in b and c during tone and after shock. Tone AUC in dNAc: 89 ± 8.5, tone AUC in vNAc: 74 ± 7, two-tailed unpaired t-test, P = 0.1829, NS. Post-shock AUC in dNAc: 194 ± 24, post-shock AUC in vNAc: 135 ± 15, two-tailed unpaired t-test, *P = 0.0355. e,f, δLight response in the dNAc (e) and the vNAc (f). Experimental details same in b and c. dNAc, n = 4 animals; vNAc, n = 5 animals. One-phase decay fit from 31 s to 80 s (red). g, AUC of single trials in e and f during tone and after shock. Tone AUC in the dNAc: 14 ± 1.4, tone AUC in the vNAc: 18 ± 1.5, two-tailed unpaired t-test, P = 0.0582, NS. Post-shock AUC in the dNAc; 18 ± 1.8, post-shock AUC in vNAc; 13 ± 1.4, two-tailed unpaired t-test, *P = 0.0276. Error bars represent the s.e.m. In d and g, all single trial AUCs are plotted and compared for tone (0–25 s) and after shock (30–70 s) from n = 4 animals for δLight response in the dNAc and n = 5 animals for δLight response in the vNAc. h, Schematic shows classical Pavlovian conditioning. i, Left, mean κLight1.3a activity averaged across all trials during day 1 (early; light purple) and day 7 (trained; dark purple) of Pavlovian conditioning (n = 6 animals). Solid lines represent the mean, and shaded areas represent the s.e.m. Right, AUC of single trials across early and trained stages of Pavlovian conditioning; early: 8.4 ± 0.74, trained: 10.51 ± 0.77, two-tailed paired t-test, ****P < 0.0001. Error bars represent the s.e.m. j, Schematic shows caramel retrieval experiment. k, Left, averaged δLight activity upon caramel retrieval after injection of saline (dark green) or 4 mg per kg body weight naloxone (light green; n = 3 animals). Solid line represents the mean, and shaded area represent the s.e.m. Right, AUC of single trials compared between saline and naloxone conditions, saline: 20 ± 2.3, naloxone: 6 ± 2.7, *P = 0.0197, two-tailed unpaired t-test. Error bars represent the s.e.m.
Extended Data Fig. 1
Extended Data Fig. 1. Screening and characterization of the opioid sensors.
(a) Schematic diagrams showing the components of recombinant DNA for each opioid sensor. (b) Simulated structure of µLight. Mu opioid receptor (µOR, magenta), linkers (orange), cpGFP (light green). (c) Optimization of the opioid sensor variants. Dots representing ΔF/F (%) of variants screened along optimizations, including cpGFP insertion sites, linker screening, and point mutations. A ligand concentration of 100 μM was used for screening; U50,488 for κLight (blue), ME for δLight (green) and DAMGO for µLight (magenta). Variants with the highest ΔF/F (%) indicated as κLight1.3 (144.47%) with 698 variants screened; δLight (191%) with 63 variants screened; µLight (69.6%) with 233 variants screened. (d) (Top) Representative image of 4 independent transient transfection of µLight in HEK293T cells. (Bottom) Heatmap indicating signal-to-noise-ration (SNR) upon addition of 100 μM β-endorphin. Scale bar, 20 μm. (e) (Left) Agonist (100 μM DynA8) and antagonist (1 mM naloxone) response of κLight1.3 transiently expressed in dissociated hippocampal neuron cultures. n = 4 wells. Solid blue line represents the mean, and shaded area represents SEM. ΔF/F (%) comparison between two states: agonist response (151 ± 5.0 %), + antagonist response (36.9 ± 11.7 %), two-tailed unpaired t test, ***p = 0.0001. Nalo = Naloxone. (middle) Agonist (100 μM ME) and antagonist (1 mM naloxone) response of δLight transiently expressed in dissociated hippocampal neuron cultures. n = 4 wells. Solid green line represents the mean, and the shaded area represents SEM. ΔF/F (%) comparison between two states: agonist response (123 ± 19.4 %), + antagonist response (1.82 ± 2.4 %), two tailed unpaired t test, ***p = 0.0008. (right) Agonist (100 μM β-endorphin) and antagonist (1 mM naloxone) response of µLight transiently expressed in dissociated hippocampal neuron cultures. n = 4 wells. Solid magenta line represents the mean, and the shaded area represents SEM. ΔF/F (%) comparison between two states: agonist response (19.6 ± 3.2 %), + antagonist response (0.75 ± 3.6 %), two tailed unpaired t test, ***p = 0.0082. (Right). (f) Excitation-emission spectra of the three opioid sensors under both bound (upper lines, 100 μM DynA8 for κLight -blue, 100 μM ME for δLight -green, and 100 μM β-endorphin for µLight -magenta) and unbound (lower lines) states. Excitation (dotted lines) of all three sensors peaks at ~490 nm, and emission (solid lines) of all three sensors peaks at ~515 nm. (g) (Left) representative imaging showing κLight0-expressing HEK293T cells, scale bar 20 μm. (Right) κLight0-expressing HEK293T cells respond to ligands in a concentration-dependent manner plotted together with κLight1.3 (DynA13-κLight1.3 – blue, DynA13-κLight0 – black, β-endorphin-κLight0 – gray, ME-κLight0 – yellow). Error bars represent SEM. n = 4 wells each. Dyn = dynorphin, ME = met-enkephalin. (h) (Left) representative imaging showing δLight0-expressing HEK293T cells, scale bar 20 μm. (Right) δLight0-expressing HEK293T cells respond to ligands in a concentration-dependent manner plotted together with δLight (ME-δLight – green, ME-δLight0 – black, β-endorphin- δLight0 – gray, DynA13- δLight0 – yellow). Error bars represent SEM. n = 4 wells each. Dyn = dynorphin, ME = met-enkephalin. (I) (Left) representative imaging showing κLight1.3 - expressing dissociated hippocampal neurons, scale bar 50 μm. (Right) κLight1.3-expressing dissociated hippocampal neurons respond to ligands in a concentration-dependent manner (DynA13 – blue, β-endorphin – gray, ME – black). Error bars represent SEM. n = 4 wells each. Dyn = dynorphin, ME = met-enkephalin. (j) (Left) representative imaging showing δLight - expressing dissociated hippocampal neurons, scale bar 50 μm. (Right) δLight-expressing dissociated hippocampal neurons respond to ligands in a concentration-dependent manner (ME – green, DynA13 – gray, β-endorphin – black). Error bars represent SEM. n = 4 wells each. Dyn = dynorphin, ME = met-enkephalin, scale bar, 50 μm.
Extended Data Fig. 2
Extended Data Fig. 2. Binding studies of selected compounds on the opioid sensors and receptors.
(a) Concentration-response curves of µLight-expressing HEK293T cells to three peptide ligands (β-endorphin – magenta, ME – gray, DynA13 – black). Error bars represent SEM. (b) Concentration-response curve of µLight-expressing HEK293T cells to oxycodone and buprenorphine. Error bars represent SEM. (c) Linear regression plot between the s-slope (maximum displacement / IC50, in nM-1) for κOR (S-slope - κOR Binding) and κLight1.3 (S-slope - κLight Binding) measured with a radio-ligand binding assay. Red curves indicate 95 % confidence interval. (d) Linear regression plot between the s-slope (maximum displacement / IC50, in nM-1) for δOR (S-slope - δOR Binding) and δLight (S-slope - δLight Binding) measured from radio-ligand binding assay. Red curves indicate 95 % confidence interval. (e) Linear regression plot between the s-slope (maximum displacement / IC50, in nM-1) for µOR (S-slope - µOR Binding) and µLight (S-slope - µLight Binding) measured from radio-ligand binding assay. Red curves indicate 95 % confidence interval. (f) NanoBiT assay (κOR / κLight1.3 or δOR / δLight + SmBiT-βarr1 + LgBiT-CAAX) measuring βarrestin1 translocation to plasma membrane upon stimulation with 1 µM DynA17 (top: κOR + DynA17 (black), κOR (gray), κLight1.3 + DynA17 (blue), κLight1.3 (light blue), 1 µM DynA17 added at 5 min) or 1 µM DADLE (bottom: δOR + DADLE (black), δOR (gray), δLight + DADLE (green), δLight (light green), 1 µM DADLE added at 5 min), n = 3 for each experiment, error bars represent SEM. (g) GloSensor cAMP assay measuring DynA17 inhibition of forskolin (FSK)-induced cAMP elevation between top: κOR (black) and κLight1.3 (blue), n = 5, and bottom: δOR (black) and δLight (green), n = 4, error bars represent SEM.
Extended Data Fig. 3
Extended Data Fig. 3. Comparison of top κLight variants and buffering effect study.
(a) Sequence alignment of κLight1.2a, κLight1.2b, κLight1.2c, κLight1.3, and κLight1.3a. Purple indicates the same residues across all variants. Blank indicates different residues. Blue color indicates κOR sequence. Orange indicates linkers. Green indicates cpGFP sequences. Gray indicates the sequence for the ER2 tag. Khaki indicates the sequence for the PRC tag, and magenta indicates the TlcnC tag. (b) (left) CYD8 uncaging response comparison between κLight1.2a (dark blue, n = 12 videos), κLight1.2b (black n = 9 videos), and κLight1.2c (magenta, n = 15 videos) expressed in dStr in acute brain slices. The solid line represents the mean, and the shaded area represents SEM. (right) κLight1.2a showed faster T1/2 off dynamics compared to κLight1.3 (κLight1.3 T1/2 extracted from Fig. 3c, 137 ± 14, n = 6; κLight1.2a, 79 ± 8.9, n = 12; κLight1.2b, 301 ± 101, n = 9; κLight1.2c, 156 ± 40, n = 15, **p = 0.001, one-way ANOVA). Error bars represent SEM. (c) Max ΔF/F (%) at the peak of the CYD8 uncaging responses for κLight1.2a (blue, n = 24 videos), κLight1.2b (black, n = 11 videos), and κLight1.2c (magenta, n = 16 videos). κLight1.2a: 9.09 ± 0.8 %, κLight1.2b: 5.1 ± 0.5 %, κLight1.2c: 6.84 ± 0.7 %. **p = 0.0027, ordinary one-way ANOVA with Dunnett’s multiple comparisons test. Error bars represent SEM. (d) Dose response curves for DynA13 at κLight1.2a (dark blue, n = 3 wells, EC50 = 366 nM), κLight1.2b (black, n = 5 wells, EC50 = 306 nM), κLight1.2c (magenta, n = 4 wells, EC50 = 234 nM), and reused κLight1.3 trace from Fig. 1e (blue, n = 4 wells, 0.0898 nM). Error bars represent SEM. (e) Schematic indicating injection of C57/B6J pups with AAV1-hSyn-κLight1.2a or AAV-DJ-CAG-GFP in the hippocampus followed by 3 weeks of expression prior to preparation of acute brain slices for electrophysiology. (f) Schematic of the electrophysiological recording configuration. Whole-cell voltage-clamp recordings are obtained from pyramidal cells (PCs) held at 0 mV while parvalbumin (PV) basket cell axons are preferentially stimulated with a narrow-tipped theta-glass-based bipolar stimulating electrode. Two electrical stimuli are applied 50 ms apart to drive synaptic inhibition. A 5 ms flash of 355 nm light (semitransparent purple circle) is applied to photorelease DynA8, which acts on presynaptic mu and delta opioid receptors on the PV cell to suppress the synaptic output. (g) Example inhibitory post-synaptic currents (IPSCs) before (black) and after (purple) DynA8 photorelease. (h) Time-course of IPSC suppression in response to DynA8 photorelease in slices expressing κLight1.2a (n = 13 cells from 3 mice, green) or GFP (n = 10 cells from 3 mice, black) using different intensities of UV light. Traces indicate the mean peak IPSC (normalized to 100%) over time, which was probed every 20 sec. Purple arrows indicate the application of UV light. The solid lines represent the mean, and the shaded areas represent SEM. (i) Power-response curve summarizing the fraction of the baseline IPSC suppressed by DynA8 photorelease in slices expressing κLight1.2a (n = 13 cells from 3 mice, green) or GFP (n = 10 cells from 3 mice, black). No significant differences were detected at different power densities (Two tailed multiple Mann-Whitney tests between GFP and κLight1.2a at different power densities: 0.13 µW/µm2: p = 0.91, 0.51 µW/µm2: p = 0.71, 0.89 µW/µm2: p = 0.71, 11 µW/µm2: p = 0.70, non-significant). (j) Average time constant of IPSC recovery after DynA8 photorelease in slices expressing κLight1.2a (n = 3 mice, green) or GFP (n = 3 mice, black). No significant differences were detected (Two tailed multiple Mann-Whitney tests between GFP and κLight1.2a at different power densities: 0.51 µW/µm2: κLight1.2a n = 10 cells, GFP n = 5 cells, p = 0.52; 0.89 µW/µm2: κLight1.2a n = 11 cells, GFP n = 9 cells, p = 0.04; 11 µW/µm2: κLight1.2a n = 11 cells, GFP n = 10 cells, p = 0.56, non-significant). Error bars represent SEM.
Extended Data Fig. 4
Extended Data Fig. 4. Dynorphin diffusion analysis and in vivo pharmacology with control sensors.
(a) Representative example of the fluorescence response of κLight1.2a for single pixels along the center of the imaging field at various distances from the site of DynA8 photorelease. (b) Representative examples of fluorescence profile as a function of distance from the uncaging site at differing time points after uncaging. (c) Representative example of a fluorescence profile at a single time (5 sec, as in Extended Data Fig. 4b), normalized and fit to an exponential function in order to extract the half width (30.5 µm). (d) Representative plot of the half-width squared/4 vs. time for determination of the apparent diffusion coefficient D*. The fluorescence profile fits (for example Extended Data Fig. 4c) were repeated in 1 second time bins to extract the half-width. The slope of this linear regression is the apparent diffusion coefficient D*. (e) Fluorescence response (ΔF/F) to U50,488 (100 μM) compared between κLight1.3 (blue, n = 3 wells), and κLight1.3a (magenta, n = 3 wells). κLight1.3: 1.56 ± 0.12, κLight1.3a: 1.474 ± 0.18, two tailed unpaired t test, p = 0.724, non-significant. Error bar represents SEM. (f) Basal fluorescence compared between κLight1.3 (blue, n = 3 wells), and κLight1.3a (magenta, n = 3 wells). κLight1.3: 25.0 ± 0.08, κLight1.3a: 61.01 ± 4.49, two tailed unpaired t test, **p = 0.0013. Error bar represents SEM. (g) (Left) representative imaging showing κLight1.3a - expressing dissociated hippocampal neurons, scale bar 50 μm. (Right) κLight1.3a-expressing dissociated hippocampal neurons respond to ligands in a concentration-dependent manner (DynA13 – magenta, β-endorphin – gray, ME – black). Error bars represent SEM. n = 4 wells each. Dyn = dynorphin, ME = met-enkephalin. (h) Representative images showing κLight (top), δLight (middle), and zoomed-in image for δLight (bottom) expression in ARC. Scale bar 150 µm for both κLight and δLight. δLight zoomed insert has scale bar = 30 µm. Abbreviations: ventricle (3 V), fiber track (f.t.). (i) (Left) κLight0 response to 3 mg/kg U69,593 (gray, n = 3 animals), and 3 mg/kg U69,593 + 1 mg/kg U62,066 (black, n = 4 animals) in ARC, Solid lines represent the mean, and shaded areas represent SEM. (Right) bar graph indicating the peak z-score of each response, U69,593: -1.9 ± 0.7 %, U69,593 + U62,066: −0.2 ± 1 %, unpaired t test, p = 0.2625, non-significant. U69 = U69,593, U62 = U62,066. Error bars represent SEM. (j) (Left) δLight0 response to 5 mg/kg SNC162 (gray, n = 4 animals), and 5 mg/kg SNC162 + 4 mg/kg naloxone (black, n = 4 animals) in ARC. Solid lines represent the mean, and shaded areas represent SEM. (Right) bar graph indicating the peak z-score of each response, SNC162: 0.77 ± 0.5 %, SNC162 + naloxone: 0.33 ± 0.4 %, unpaired t test, p = 0.4948, non-significant. Nalo = Naloxone. Error bars represent SEM. (k) (Left) κLight0 response to 10 mg/kg U50,488 (gray, n = 3 animals), and 10 mg/kg U50,488 + 10 mg/kg naloxone (black, n = 3 animals) in CA3. Solid lines represent the mean, and shaded areas represent SEM. (Right) bar graph indicating the peak z-score of each response, U50,488: −1 ± 0.7 %, U50,488 + naloxone: −0.75 ± 0.8 %, two tailed unpaired t test, p = 0.8123, non-significant. U50 = U50,488, Nalo = Naloxone. Error bars represent SEM. (l) (Left) δLight0 response to 5 mg/kg SNC162 (gray, n = 4 animals), and 5 mg/kg SNC162 + 4 mg/kg naloxone (black, n = 3 animals) in ARC, Solid lines represent the mean, and shaded areas represent SEM. (Right) bar graph indicating the peak z-score of each response, SNC162: −0.61 ± 0.4 %, SNC162 + naloxone: −0.27 ± 0.07 %, two tailed unpaired t test, p = 0.5451, non-significant. Nalo = Naloxone. Error bars represent SEM.
Extended Data Fig. 5
Extended Data Fig. 5. Controls for in vivo fiber photometry with optogenetics and other stimulation parameters.
(a) Coronal brain schematic showing photometry fiber placements in the NAcSh of κOR-Cre+ mice. (b) Mean recorded κLight1.3a fluorescence averaged across all stimulation-evoked trials in ChRimson-injected (dark purple; n = 4 mice) or control mice (light purple; n = 2 mice). Solid lines represent the mean, and shaded areas represent SEM. (c) Heatmap raster plot of recorded κLight1.3a fluorescence averaged across all stimulation-evoked trials in ChRimson-injected (top; n = 4 mice) or control mice (bottom; n = 2 mice). (d) Normalized fluorescence minima during all stimulation-evoked trials. (0-20 sec; ChRimson – n = 4 animals: −1 ± 0.14, Control - n = 2 animals: -0.87 ± 0.14, two tailed unpaired t test, p = 0.51, non-significant). Data represented as mean ± SEM. (e) Normalized fluorescence area under the curve of single trails during all stimulation-evoked trials (0-20 sec; ChRimson – n = 4 animals: 0.98 ± 0.15, Control - n = 2 animals: −0.45 ± 0.13, two tailed unpaired t test, ****p < 0.0001). Data represented as mean ± SEM. (f) Mean trace and heatmap raster plot of recorded κLight1.3a fluorescence averaged across all 1 second stimulation-evoked trials in ChRimson-injected mice (n = 4 animals). Stim indicates the time of stimulus application. Solid lines represent the mean, and shaded areas represent SEM. (g) Mean trace and heatmap raster plot of recorded κLight1.3a fluorescence averaged across all 3 second stimulation-evoked trials in ChRimson-injected mice (n = 4 animals). Stim indicates the time of stimulus application. Solid lines represent the mean, and shaded areas represent SEM. (h) Mean trace and heatmap raster plot of recorded κLight1.3a fluorescence averaged across all 5 second stimulation-evoked trials in ChRimson-injected mice (n = 4 animals). Stim indicates the time of stimulus application. Solid lines represent the mean, and shaded areas represent SEM. (i) Normalized fluorescence area under the curve of single trails during all stimulation-evoked trials (0-20 sec; 1 stim (dark purple): 1 ± 0.22, 3 stim (medium purple): 0.46 ± 0.22, 5 stim (light purple): −0.29 ± 0.37, ordinary one-way ANOVA with Dunnett’s multiple comparisons test, *p = 0.0167, n = 4 animals). Data represented as mean ± SEM. (j) Normalized fluorescence minima during all stimulation-evoked trials (0-20 sec; 1 stim (dark purple): −1 ± 0.14, 3 stim (medium purple): −1.18 ± 0.2, 5 stim (light purple): −0.87 ± 0.14, ordinary one-way ANOVA with Dunnett’s multiple comparisons test, p > 0.05, n = 4 animals). Data represented as mean ± SEM. (k) Schematic of viral injection sites for κLight1.3a into NAcSh and ChRimson into BLA of WT or DYN-KO mice. (l) Representative 20X coronal image (left panel) showing expression of κLight1.3a (green), ChRimson (red), DAPI (blue), and fiber placement in NAcSh (left; scalebar – 200 μm), and ChRimson (red) and DAPI (blue) in BLA (right; scalebar – 200 μm) from 6 animals and showed similar results. (m) Mean recorded κLight1.3a activity averaged across all animals following i.p injections of U50,488 in WT (dark; n = 4 animals) and DYN-KO (light; n = 4 animals). Solid lines represent the mean, and shaded areas represent SEM. (n) Heatmap raster plot of recorded κLight1.3a activity averaged across all animals following i.p injections of U50,488 in WT (dark; n = 4 animals) and DYN-KO (light; n = 4 animals) displayed in animal ascending order by average activity following injection. (o) Normalized peak fluorescence during injection period (0-50 min; WT: 1 ± 0.24, DYN-KO: 0.9 ± 0.17; two tailed paired t test, p = 0.8078, n = 4 animals). Data represented as mean ± SEM. U50 = U50,488. (p) Normalized fluorescence area under the curve of single trails during injection period (0-50 min; WT: 1 ± 0.38, DYN-KO: 0.73 ± 0.3; two tailed paired t test, p = 0.6123, n = 4 animals). Data represented as mean ± SEM. U50 = U50,488. (q) Mean recorded κLight1.3a activity averaged across all trials during ChRimson stimulation-evoked trials in WT and DYN-KO (n = 4 animals). Solid lines represent the mean, and shaded areas represent SEM. Stim indicates the time of stimulus application. (r) Heatmap raster plot of recorded κLight1.3a activity averaged across all trials during ChRimson stimulation-evoked trials in WT and DYN-KO (n = 4 animals) displayed in ascending trial order by average activity across trials. Stim indicates the time of stimulus application. (s) Normalized peak fluorescence across vehicle and aticaprant treatment during all ChRimson stimulation-evoked trials (0-20 sec; WT: 1 ± 0.09, DYN-KO: 0.48 ± 0.08; two tailed paired t test, ***p = 0.0004, n = 4 animals). Data represented as mean ± SEM. (t) Normalized fluorescence area under the curve of single trails across vehicle and aticaprant treatment during all ChRimson stimulation-evoked trials (0-20 sec; WT: 1 ± 0.1, DYN-KO: 0.43 ± 0.05; two tailed paired t test, ****p < 0.0001, n = 4 animals). Data represented as mean ± SEM.
Extended Data Fig. 6
Extended Data Fig. 6. In vivo fiber photometry during aversive and rewarding behaviors with control sensors.
(a) Representative images indicating κLight1.3 expression in dNAcsh from 7 animals (left) and vNAcsh from 8 animals (right) showing similar results. Blue lines indicate the fiber tract. Scale bar = 100 μm. (b) Experimental schematic indicating injection of κLight0 and δLight0 into vNAc individually, followed by fear conditioning protocol (30 sec tone, co-terminated with 1.5 sec shock, as described in Fig. 6a), recorded with fiber photometry. (c) κLight0 response in vNAc: (Top) Sorted shock trials averaged across animals from top to bottom in chronological order (trial 1 at the top, trial 10 at the bottom). (Bottom) Average trace of κLight0 response (black) during fear conditioning, tone (0-30 sec, yellow shade), shock, (27.5-29 sec, orange). Solid line represents the mean, and shaded areas represent SEM. n = 5 animals. (d) Area under the curve of single trails in (Extended Data Fig. 6c) and (Fig. 6c) during tone and post-shock. Tone AUC κLight0 (gray): 41 ± 7.6, tone AUC κLight1.3 (blue): 74 ± 7, two tailed unpaired t test, **p = 0.0016. Post-shock AUC κLight0 (gray): 37 ± 8.5, post-shock AUC κLight1.3 (blue): 135 ± 15, two tailed unpaired t test, ****p = 0.0001. κLight1.3 bar graph data reused from Fig. 6d. Error bars represent SEM. Plotted and compared all single trial AUCs for tone (0–25 sec) and post-shock (30–70 sec) from n = 5 animals for κLight0 and n = 8 animals for κLight1.3. (e) δLight0 response in vNAc: (Top) Sorted shock trials averaged across animals from top to down in chronological order (trial 1 at the top, trial 15 at the bottom). (Bottom) Average trace of δLight response (black) during fear conditioning, tone (0-30 sec, yellow shade), shock, (27.5–29 sec, orange). Solid line represents the mean, and shades represent SEM. n = 5 animals. (f) Area under the curve of single trails in (Extended Data Fig. 6e) and (Fig. 6f) during tone and post-shock. Tone AUC δLight0 (gray): 11 ± 2.5, tone AUC δLight (green): 18 ± 1.5, two tailed unpaired t test, *p = 0.025. Post-shock AUC δLight0 (gray): 6.8 ± 1.5, post-shock AUC δLight (green): 16 ± 2.7, two tailed unpaired t test, **p = 0.0034. δLight bar graph data reused from Fig. 6g. Error bars represent SEM. Plotted and compared all single trial AUCs for tone (0–25 sec) and post-shock (30–70 sec) from n = 5 animals for δLight0 and n = 5 animals for δLight. (g) (Left) Averaged δLight0 fluorescence upon caramel retrieval after injection of saline (gray) or 4 mg/kg naloxone (black) (n = 4 animals). Solid lines represent the mean, and shaded areas represent SEM. (Right) Area under the curve of single trails between δLight0-saline, δLight0-naloxone, and δLight-saline conditions, δLight0-saline (gray): 5.8 ± 2.8, δLight0-naloxone (black): 3.1 ± 2.1, δLight-saline (green): 20 ± 2.3, δLight-saline vs δLight0-saline **p = 0.0088, δLight-saline vs δLight0-naloxone **p = 0.0032, ordinary one-way ANOVA with Dunnett’s multiple comparisons test. δLight-saline bar graph data reused from Fig. 6k. Error bars represent SEM. Abbreviations: saline (Sal), naloxone (Nalo), caramel (Car).

References

    1. Greco, M. A. et al. Opioidergic projections to sleep-active neurons in the ventrolateral preoptic nucleus. Brain Res.1245, 96–107 (2008). 10.1016/j.brainres.2008.09.043 - DOI - PMC - PubMed
    1. Hökfelt, T. et al. Neuropeptide and small transmitter coexistence: fundamental studies and relevance to mental illness. Front. Neural Circuits12, 106 (2018). 10.3389/fncir.2018.00106 - DOI - PMC - PubMed
    1. Holden, J. E., Jeong, Y. & Forrest, J. M. The endogenous opioid system and clinical pain management. AACN Clin. Issues16, 291–301 (2005). 10.1097/00044067-200507000-00003 - DOI - PubMed
    1. Klenowski, P., Morgan, M. & Bartlett, S. E. The role of δ-opioid receptors in learning and memory underlying the development of addiction. Br. J. Pharmacol.172, 297–310 (2015). 10.1111/bph.12618 - DOI - PMC - PubMed
    1. Nummenmaa, L. & Tuominen, L. Opioid system and human emotions. Br. J. Pharmacol.175, 2737–2749 (2018). 10.1111/bph.13812 - DOI - PMC - PubMed