. 2024 Jul 15;21(1):171.
doi: 10.1186/s12974-024-03158-9.

Early depletion of gut microbiota shape oligodendrocyte response after traumatic brain injury

Affiliations

Early depletion of gut microbiota shape oligodendrocyte response after traumatic brain injury

Kirill Shumilov et al. J Neuroinflammation. .

Abstract

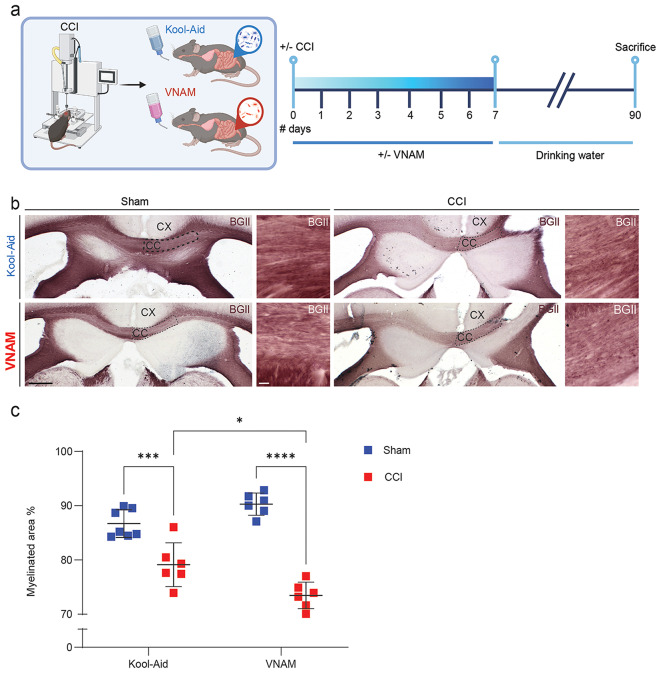
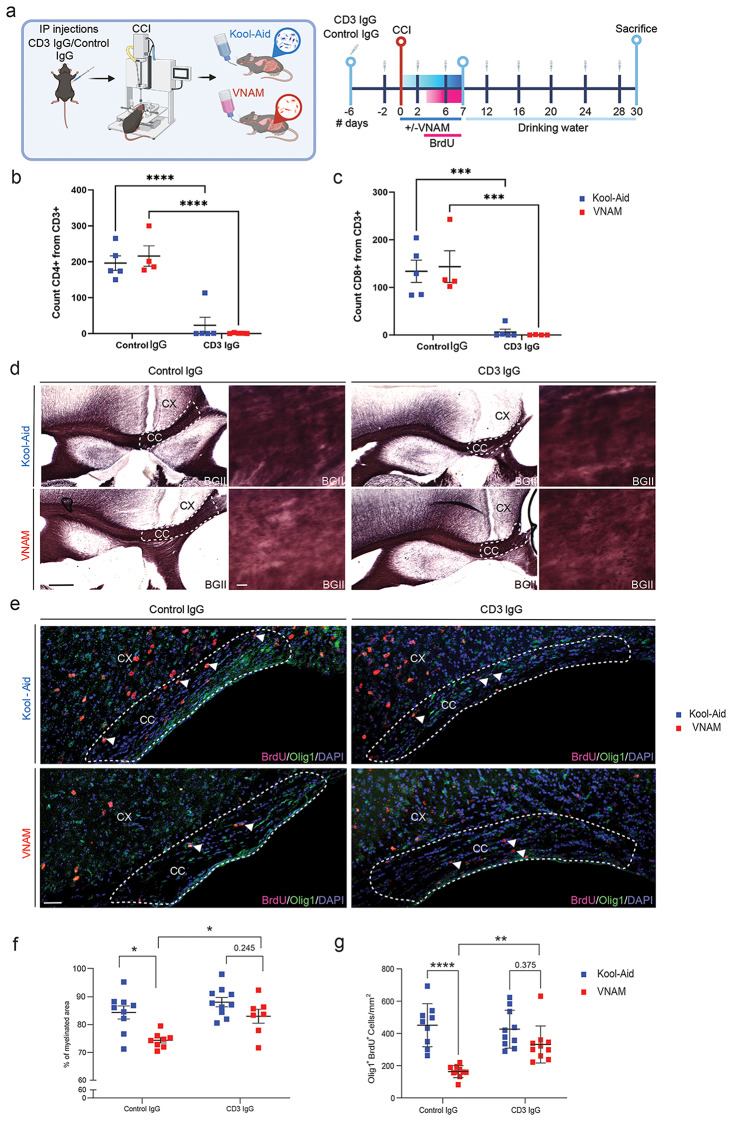
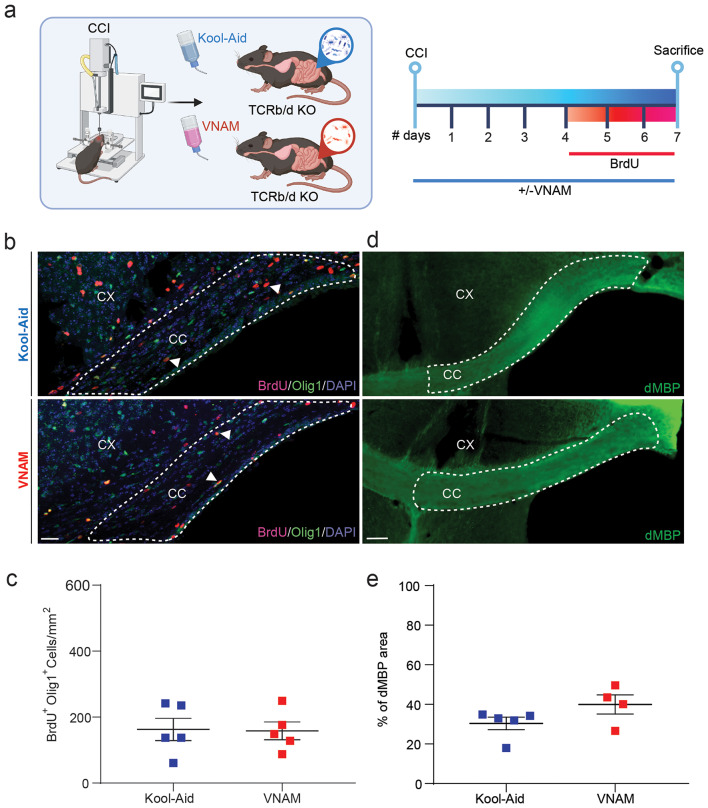
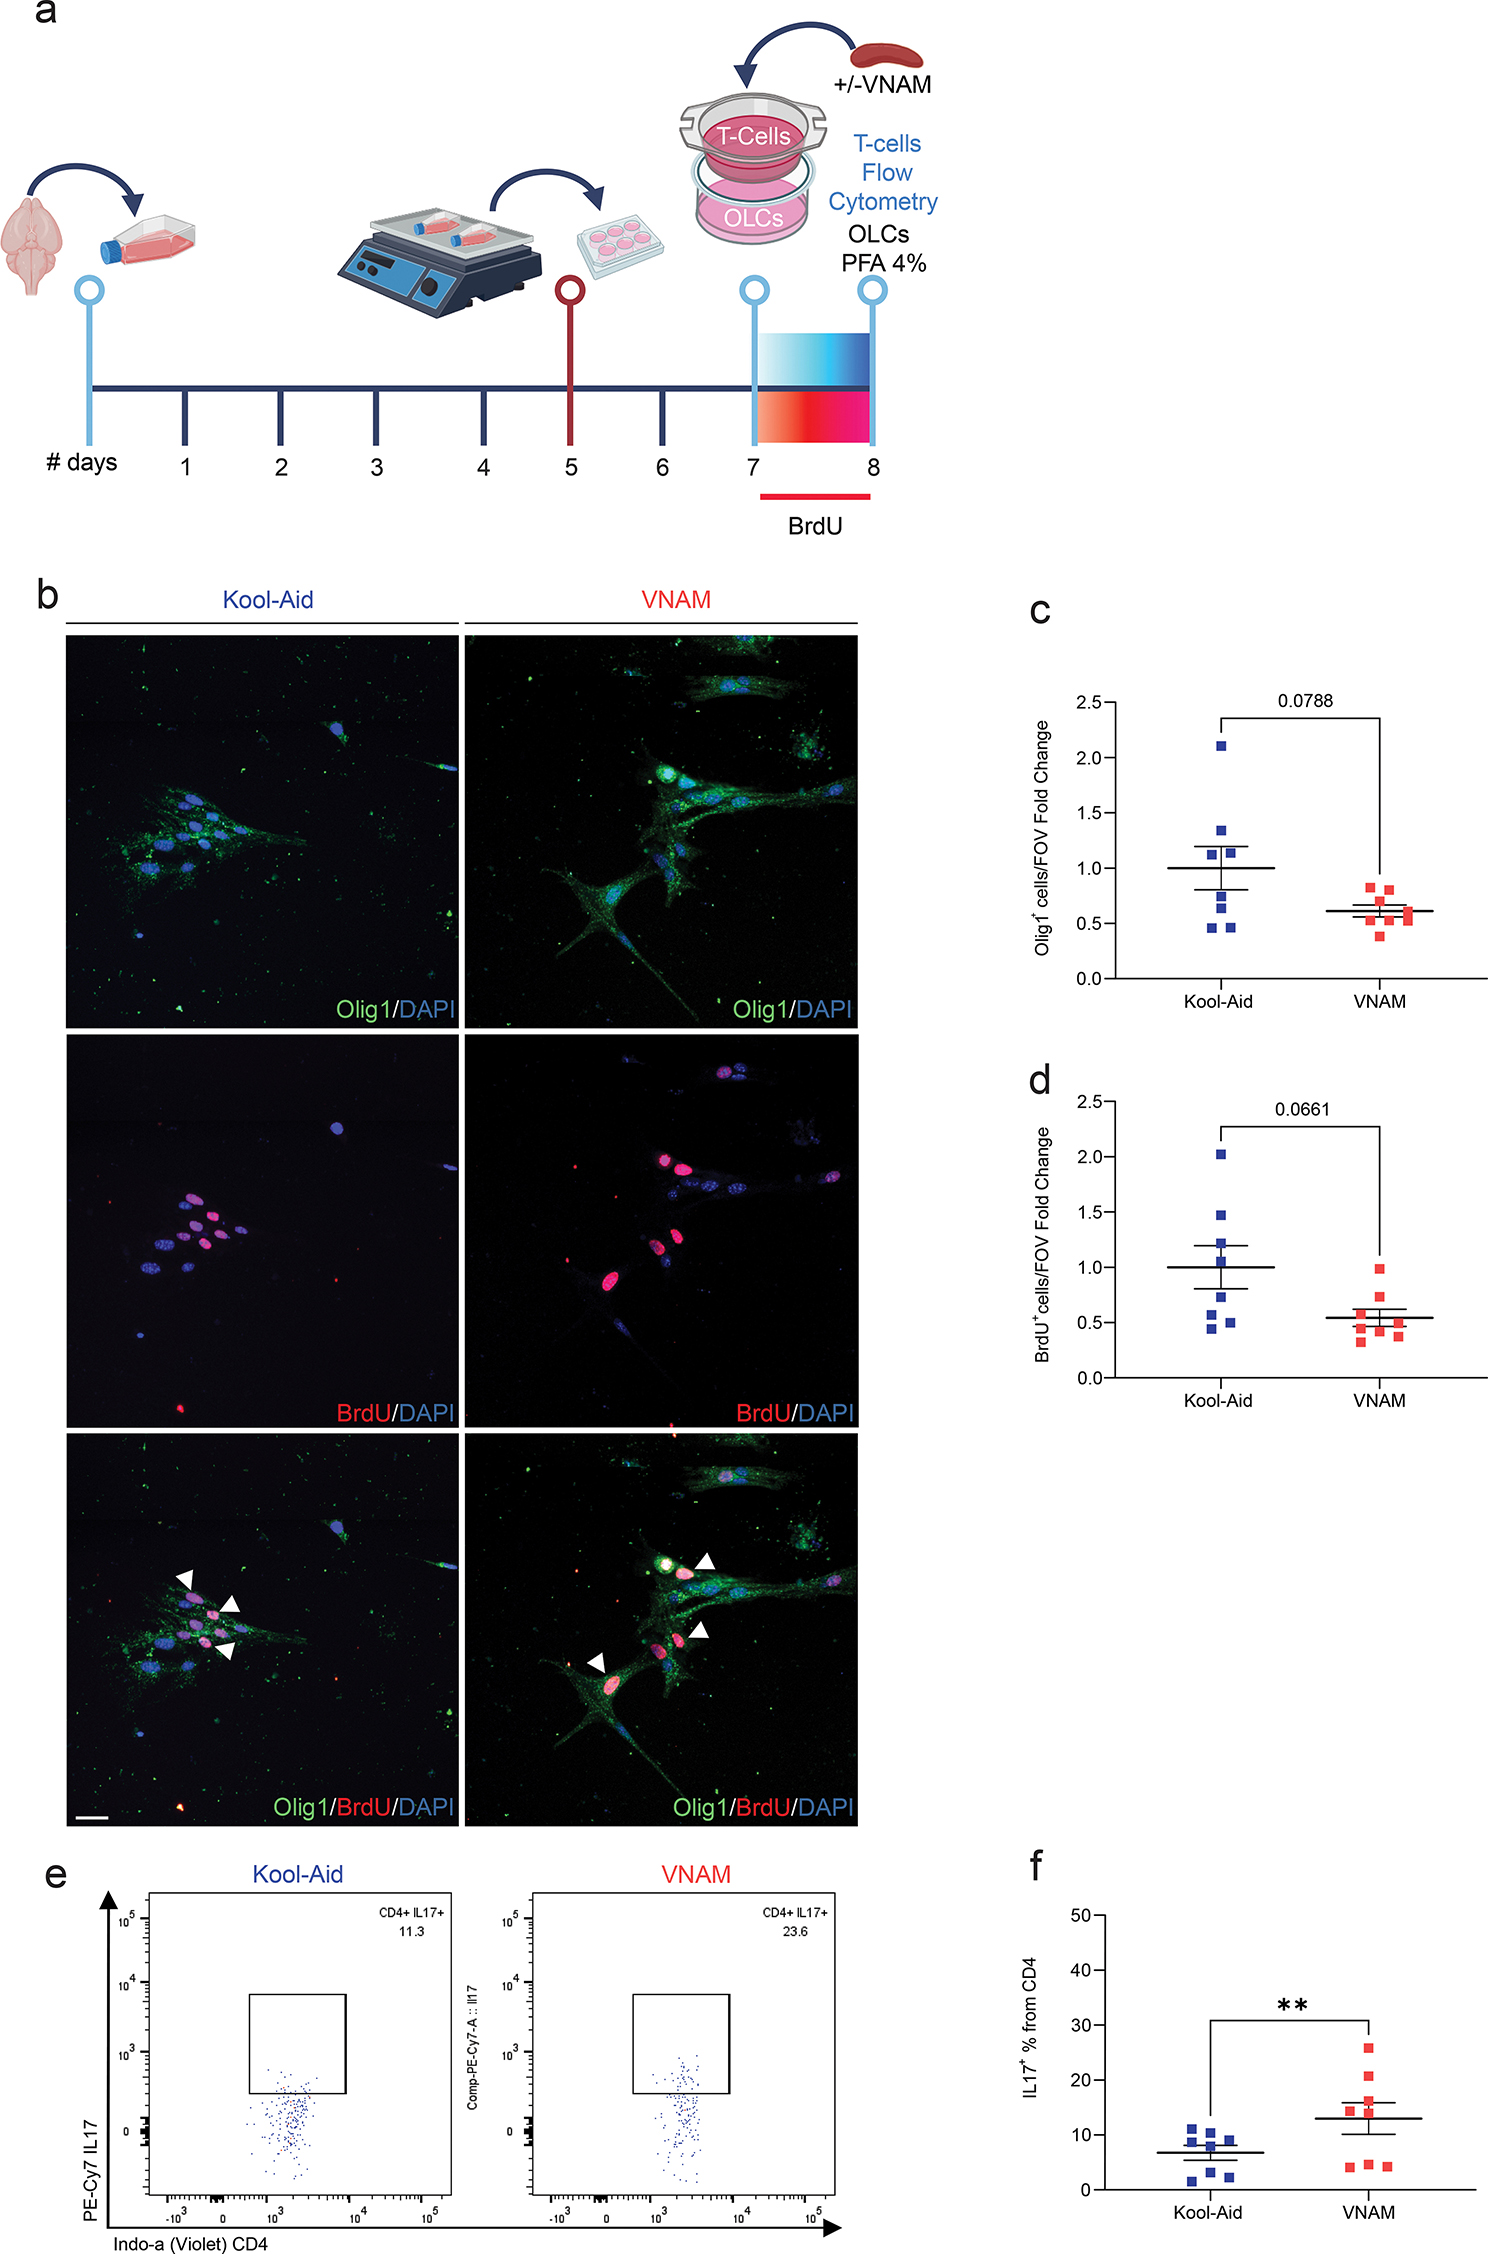
White matter injury (WMI) is thought to be a major contributor to long-term cognitive dysfunctions after traumatic brain injury (TBI). This damage occurs partly due to apoptotic death of oligodendrocyte lineage cells (OLCs) after the injury, triggered directly by the trauma or in response to degenerating axons. Recent research suggests that the gut microbiota modulates the inflammatory response through the regulation of peripheral immune cell infiltration after TBI. Additionally, T-cells directly impact OLCs differentiation and proliferation. Therefore, we hypothesized that the gut microbiota plays a critical role in regulating the OLC response to WMI influencing T-cells differentiation and activation. Gut microbial depletion early after TBI chronically reduced re-myelination, acutely decreased OLCs proliferation, and was associated with increased myelin debris accumulation. Surprisingly, the absence of T-cells in gut microbiota depleted mice restored OLC proliferation and remyelination after TBI. OLCs co-cultured with T-cells derived from gut microbiota depleted mice resulted in impaired proliferation and increased expression of MHC-II compared with T cells from control-injured mice. Furthermore, MHC-II expression in OLCs appears to be linked to impaired proliferation under gut microbiota depletion and TBI conditions. Collectively our data indicates that depletion of the gut microbiota after TBI impaired remyelination, reduced OLCs proliferation with concomitantly increased OLC MHCII expression, and required the presence of T cells. This data suggests that T cells are an important mechanistic link by which the gut microbiota modulate the oligodendrocyte response and white matter recovery after TBI.

Keywords: Gut microbiota; Neuroinflammation; Oligodendrocytes; Remyelination; T cells; Traumatic brain injury; White matter injury.


Conflict of interest statement

The authors declare no competing interests.

Figures

Fig. 1
Fig. 1
Gut microbial depletion impairs remyelination after TBI. a Experimental design: one week of VNAM treatment after TBI; animals were sacrificed 3 months after injury. b Representative images of the CC (black dashed lines) areas stained with BGII. c Quantification of percentage of the myelinated area of CC interaction of injury and gut microbiome F(1,21) = 16.29 p = 0.0006 interaction of VNAM and CCI. Mean values are plotted ± SEM. ***p = 0.0006; ****p < 0.0001. Two-way ANOVA followed by Tukey multiple comparison post hoc test was used to determine statistical differences; n = 6–7 mice per group. Scale bar = 200 μm and 50 μm in the inserts. Abbreviations: CC: corpus callosum; CCI: controlled cortical impact; CX: cortex; BGII: myelin black gold II; VNAM: vancomycin, neomycin-sulfate, ampicillin, and metronidazole
Fig. 2
Fig. 2
Gut microbial depletion reduces oligodendrocyte lineage cell proliferation after TBI. a Experimental design: one week of VNAM treatment after TBI; animals were sacrificed one week after injury. Representative images of CC (white dashed lines) stained with b dMBP, c Olig1+/BrdU+, and d bAPP. e Quantification of percentage of the dMBP-stained area of the CC. f Quantification of Olig1+/BrdU+ cells in the ipsilateral CC. g Quantification of βAPP axonal swelling density of the CC. h Experimental design: Germ free (GF) mice were gavaged with two fecal microbiota transplants (FMT) of the gut microbiota from mice treated with VNAM or Kool-Aid uninjured animals on Day − 7 and day − 17 prior to injury. i Representative fluorescent images of CC (white dashed lines) stained with dMBP. j Quantification of percentage of the dMBP-stained area of the CC. Mean values are plotted ± SEM. *p < 0.05. Unpaired t tests was used to determine statistical differences; n = 5–9 mice per group. Scale bar = 200 μm and 50 μm in the inserts. Abbreviations: CC: corpus callosum; CCI: controlled cortical impact; CX: cortex; dMBP: degraded myelin basic protein; FMT: fecal matter transplant; GF: germ free; SPF: specific pathogens free; VNAM: vancomycin, neomycin-sulfate, ampicillin, and metronidazole
Fig. 3
Fig. 3
Pharmacological depletion and genetical deletion of T-cells restore OLCs proliferation after TBI and gut microbial depletion. a Experimental design: six days before injury animals received the first injection of CD3 IgG/control IgG then every four days; one week of VNAM treatment after TBI; animals were sacrificed one month after injury. Quantification of cell absolute numbers in the blood for b CD4 T-cells (CD11bCD3+CD4+) and c CD8 T-cells (CD11bCD3+CD8+). d Representative images of the CC (black dashed lines) areas stained with BGII. e Representative fluorescent images of CC (white dashed lines) stained with Olig1/BrdU. f Quantification of percentage of the myelinated area of CC F(1,30) = 1.572 p = 0.2195 interaction of VNAM and CD3 depletion. g Quantification of Olig1+/BrdU+ proliferative cell density of the CC F(1,35) = 7.986 p = 0.0077 interaction of VNAM and CD3 depletion. Mean values are plotted ± SEM. ****p < 0.0001; ***p < 0.0006; **p < 0.005. Two-way ANOVA followed by Tukey multiple comparison post hoc test was used to determine statistical differences; n = 6–7 mice per group. Scale bar = 200 μm and 50 μm in the inserts. Abbreviations: CC: corpus callosum; CCI: controlled cortical impact; CX: cortex; BGII: myelin black gold II; VNAM: vancomycin, neomycin-sulfate, ampicillin, and metronidazole
Fig. 4
Fig. 4
Gut microbial depletion after TBI does not impact OLC proliferation and dMBP accumulation in TCRβ-/-TCRδ-/-mice. a Experimental design: one week of VNAM treatment after TBI; animals were sacrificed one week after injury. b Representative fluorescent images of CC (white dashed lines) stained with Olig1 and BrdU. c Quantification of Olig1+/BrdU+ proliferative cell density of the CC. d Representative images of CC (white dashed lines) stained with dMBP. e Quantification of percentage of the myelinated area of CC. Mean values are plotted ± SEM. Unpaired t tests was used to determine statistical differences; n = 4–5 mice per group. Scale bar = 200 μm. Abbreviations: CC: corpus callosum; CCI: controlled cortical impact; CX: cortex; dMBP: degraded myelin basic protein; VNAM: vancomycin, neomycin-sulfate, ampicillin, and metronidazole
Fig. 5
Fig. 5
Co-culture of T-cells derived from injured animals with gut microbiota depletion impairs OLCs proliferationin vitro. a Experimental design: Oligodendrocyte lineage cells were isolated form P5 mice brains and cultured for five days. b Representative fluorescent images stained Olig1 and BrdU. c Quantification of Olig1 cell density F(1.99,17.99) = 14.85 p = 0.0002 VNAM treatment interaction. d Quantification of BrdU proliferative cell density F(1.215,10.95) = 14.32 p = 0.0022 VNAM treatment interaction. e Quantification of cell circularity coefficient F(1.582,9.495) = 22.96 p = 0.0004 VNAM treatment interaction. Mean values are plotted ± SEM. ***p < 0.0005; **p < 0.005. One-way ANOVA followed by Tukey multiple comparison post hoc test was used to determine statistical differences; n = 10 wells per group. Scale bar = 20 μm. Abbreviations: OLCs: oligodendrocyte lineage cells; PFA: paraformaldehyde; VNAM: vancomycin, neomycin-sulfate, ampicillin, and metronidazole
Fig. 6
Fig. 6
Co-culture of OLCs increased IL17 CD4+T-cells derived from injured animals with gut microbiota depletion. a Experimental design: cells were isolated form P5 mice brains and cultured for five days; after overnight shaking supernatant cells were co-cultured in plates with T-cells for 24 h. b Gating strategy. c Quantification of CD3+ cells. d Quantification of the % of CD8+ cells from CD3+ T-cells F(1,18) = 5.24. e Quantification of the % of CD4+ cells from CD3+ T-cells F(1,18) = 163.8. f Quantification of the % of IL17+ cells from CD4+ T-cells F(1,18) = 34.76. g Quantification of the % of IL4+ cells from CD4+ T-cells. Mean values are plotted ± SEM. ****p < 0.0001. Two-way ANOVA followed by Tukey multiple comparison post hoc test was used to determine statistical differences; n = 6–9 wells per group. Abbreviations: VNAM: vancomycin, neomycin-sulfate, ampicillin, and metronidazole
Fig. 7
Fig. 7
Trans-well co-culture of T-cells derived from injured and microbiota depleted animals with OLCs partially reduced OLCs proliferation and increased CD4+IL17 expression. a Experimental design: cells were isolated form P5 mice brains and cultured for five days; after overnight shaking supernatant cells were cultured in plates with trans-well co-cultured T-cells for 24 h. b Representative fluorescent images stained Olig1/BrdU cells. c Quantification of Olig1 cell density. d Quantification of BrdU proliferative cell density. e-f Gating and quantification of the % of IL17+ cells from CD4+ T-cells. Mean values are plotted ± SEM. ***p < 0.0003 **p < 0.066; *p < 0.046. Unpaired t test was used to determine statistical differences; n = 7 wells per group. Scale bar = 20 μm. Abbreviations: OLCs: oligodendrocyte lineage cells; PFA: paraformaldehyde; VNAM: vancomycin, neomycin-sulfate, ampicillin, and metronidazole
Fig. 8
Fig. 8
Gut microbial depletion after TBI increase MHCII expression in OLCs through direct T-cell contact. a Representative fluorescent images of Olig1+/MHCII+ staining of OLCs 24 h after T-cell co-culture. b Representative fluorescent images of Olig1/MHCII staining of OLCs 24 h after T-cell trans-well co-culture. c Representative fluorescent images of CC (white dashed lines) stained with Olig1/MHCII. d Quantification of MHCII intensity mean value of OLCs 24 h after T-cell co-culture F(1.078,6.469) = 22.95 p = 0.0014 VNAM treatment interaction. e Quantification of MHCII intensity mean value of OLCs 24 h after T-cell trans-well co-culture. f Quantification of Olig1+/MHCII+ cell density of the CC. Mean values are plotted ± SEM. ***p < 0.0003 **p < 0.0026; *p < 0.0449 One-way ANOVA followed by Tukey multiple comparison post hoc test and Unpaired t tests was used to determine statistical differences; n = 7 wells per group in d; n = 5 wells per group in e; n = 6–7 mice per group in f. Scale bar = 20 μm in a and b. Scale bar = 200 μm in c. Abbreviations: CC: corpus callosum; CX: cortex; VNAM: vancomycin, neomycin-sulfate, ampicillin, and metronidazole

Update of

References

    1. Roozenbeek B, Maas AI, Menon DK. Changing patterns in the epidemiology of traumatic brain injury. Nat Rev Neurol. 2013;9(4):231–6. doi: 10.1038/nrneurol.2013.22. - DOI - PubMed
    1. Miller GF, DePadilla L, Xu L. Costs of Nonfatal Traumatic Brain Injury in the United States, 2016. Medical care. 2021. - PMC - PubMed
    1. Bramlett HM, Dietrich WD. Long-term consequences of traumatic Brain Injury: current status of potential mechanisms of Injury and neurological outcomes. J Neurotrauma. 2015;32(23):1834–48. doi: 10.1089/neu.2014.3352. - DOI - PMC - PubMed
    1. Lang SS, Kilbaugh T, Friess S, Sotardi S, Kim CT, Mazandi V, et al. Trajectory of long-term outcome in severe Pediatric diffuse Axonal Injury: an exploratory study. Front Neurol. 2021;12:704576. doi: 10.3389/fneur.2021.704576. - DOI - PMC - PubMed
    1. Stalnacke BM, Saveman BI, Stenberg M. Long-term Follow-Up of disability, cognitive, and emotional impairments after severe traumatic brain Injury. Behav Neurol. 2019;2019:9216931. doi: 10.1155/2019/9216931. - DOI - PMC - PubMed

LinkOut - more resources