. 2024 Jul 15;28(1):240.
doi: 10.1186/s13054-024-04990-4.

Integrated clustering of multiple immune marker trajectories reveals different immunotypes in severely injured patients

Collaborators, Affiliations

Integrated clustering of multiple immune marker trajectories reveals different immunotypes in severely injured patients

Maxime Bodinier et al. Crit Care. .

Abstract

Background: The immune response of critically ill patients, such as those with sepsis, severe trauma, or major surgery, is heterogeneous and dynamic, but its characterization and impact on outcomes are poorly understood. Until now, the primary challenge in advancing our understanding of the disease has been to concurrently address both multiparametric and temporal aspects.

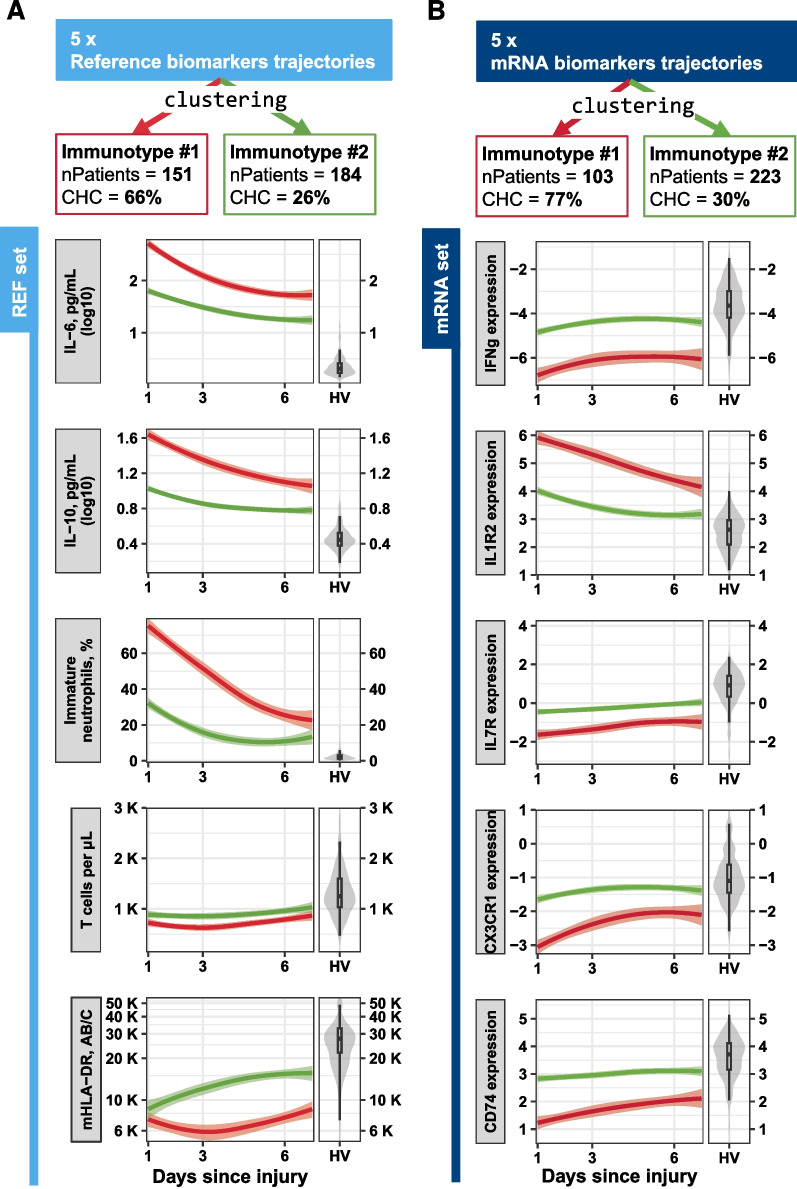
Methods: We used a clustering method to identify distinct groups of patients, based on various immune marker trajectories during the first week after admission to ICU. In 339 severely injured patients, we initially longitudinally clustered common biomarkers (both soluble and cellular parameters), whose variations are well-established during the immunosuppressive phase of sepsis. We then applied this multi-trajectory clustering using markers composed of whole blood immune-related mRNA.

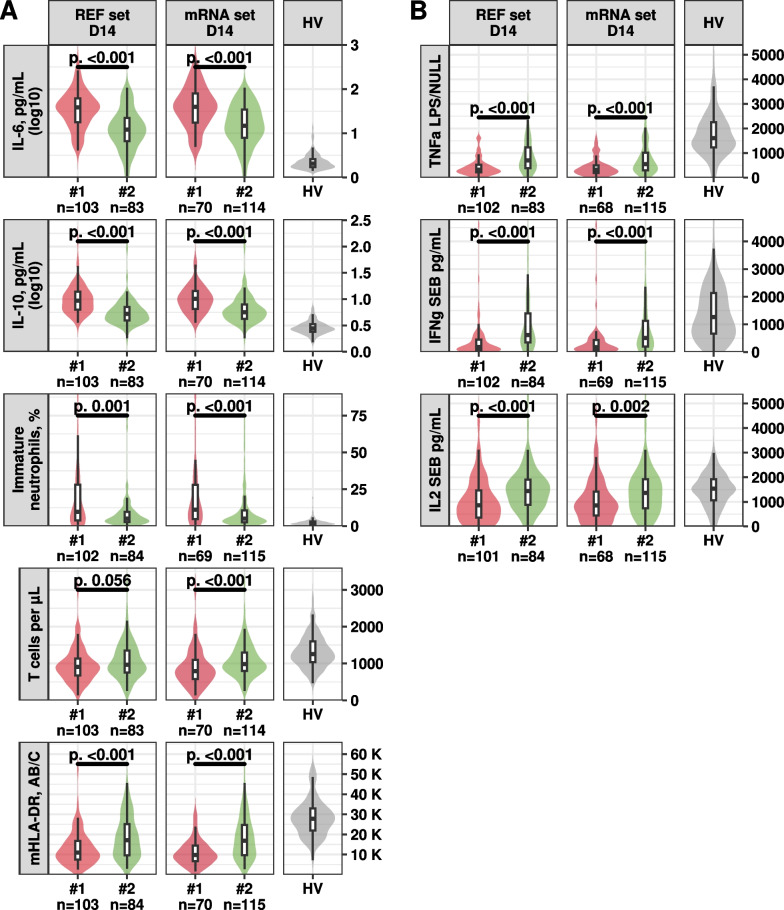
Results: We found that both sets of markers revealed two immunotypes, one of which was associated with worse outcomes, such as increased risk of hospital-acquired infection and mortality, and prolonged hospital stays. This immunotype showed signs of both hyperinflammation and immunosuppression, which persisted over time.

Conclusion: Our study suggest that the immune system of critically ill patients can be characterized by two distinct longitudinal immunotypes, one of which included patients with a persistently dysregulated and impaired immune response. This work confirms the relevance of such methodology to stratify patients and pave the way for further studies using markers indicative of potential immunomodulatory drug targets.

Keywords: Critical illness; Immune markers; Immune response; Immunosuppression; Longitudinal study; Patient stratification; Sepsis; Trajectory; Transcriptomic.


Conflict of interest statement

MB, EP, JFL, AF, KBP and JT are employees of bioMérieux SA, an in vitro diagnostic company. TR, FV, DMB and GM are employees of Hospices Civils de Lyon. MB, EP, JFL, AF, KBP, JT, FV, LK, and GM work in a joint research unit, co funded by the Hospices Civils de Lyon and bioMérieux.

Figures

Fig. 1
Fig. 1
REF set and mRNA set immunotypes HAI incidence, with death and hospital discharge as competing risks. A For each of the two REF set trajectory immunotypes: cumulative incidence of HAI with death and hospital discharge as competing risks, Immunotype #1 (left) and Immunotype #2 (right) up to D30 follow-up. B Forest plot of Fine-Gray regression subdistribution Hazard Ratios (sHR) of outcomes, comparing REF set Immunotype #1 with Immunotype #2. sHR values are depicted graphically (black points) and numerically, along with 95% Confidence Intervals (CI, horizontal bars). sHR values significantly different from 1 are displayed in bold, and the corresponding p values (p.) are reported numerically. C For each of the two mRNA set trajectory immunotypes: cumulative incidence of HAI with death and Hospital discharge as competing risks in validation cohort predicted Immunotype #1 (left) and Immunotype #2 (right) up to D28 follow-up. D Forest plot of Fine-Gray regression subdistribution Hazard Ratios (sHR) of outcomes, comparing mRNA set Immunotype #1 with Immunotype #2. sHR values are depicted graphically (black points) and numerically, along with 95% Confidence Intervals (CI, horizontal bars). sHR values significantly different from 1 are displayed in bold, and the corresponding p values (p.) are reported numerically. HAI: Healthcare Associated Infection. REF set: plasmatic IL6, plasmatic IL10, HLA-DR antibody/monocyte, T cells blood concentration, and percentage of immature neutrophils. mRNA set: normalized mRNA Cp in whole blood, IFNG, CD74, CX3CR1, IL7R, and IL1R2
Fig. 2
Fig. 2
Longitudinal Immunotype characterization of critically ill patients using REF set and mRNA set markers. Critically ill patients (sepsis, severe trauma, and major surgery) were consecutively measured at D1-2, D3-4, and D5-7 after injury for 5 reference markers (REF set, A) and 5 mRNA markers (mRNA set, B). Trajectory clustering was performed for each set, with all 5 markers' temporal evolution considered together, exploring from 2 to 6 clusters. The resulting clusters are referred to as immunotypes and are represented as boxes on the top of the figure, with the first row indicating the immunotype label, the second row showing the number of patients (“nPatients”), and the third row displaying the enrichment in complicated hospital course (“CHC”), defined as the presence of one or more complications such as D30 Healthcare Associated Infection, more than 7 days in ICU, or D30 death. Temporal evolution of each of the 5 markers used for immunotypes construction were drawn below, with time in days after injury represented on x-axis, and marker level on y-axis. Immunotype #1 is represented in red, and Immunotype #2 in green. The evolution of markers is depicted through loess regression within each identified Immunotype, with standard error around mean curves. On the right side of each plot, the reference distribution of healthy volunteers (HV) is shown as violin plots for comparison. REF set: plasmatic IL6, plasmatic IL10, HLA-DR antibody per monocyte (mHLA-DR), T cells blood concentration per microliter, and percentage of immature neutrophils in blood. mRNA set: normalized mRNA Cp in whole blood, IFNg, CD74, CX3CR1, IL7R, and IL1R2
Fig. 3
Fig. 3
D14 immune system differences per REF set Immunotypes or mRNA set Immunotypes. Each graphic represents one of the reference markers (A) or Immune Functional Assay (B) measured at D14. The first graphic column corresponds to REF set trajectory immunotypes, the second to mRNA set immunotypes, and the third to healthy volunteers. Immunotype’s D14 immune marker level is represented with violin plot, with the number of available samples at D14 indicated below each plot. To illustrate the differences in marker distribution between immunotypes of each set, we performed Wilcoxon tests and displayed horizontal bars between the concerned groups above the violins, with the p-value indicated above the bar. The tails of the violin plots were truncated to enhance the readability of the graphics. REF set: plasmatic IL6, plasmatic IL10, HLA-DR antibody/monocyte, T cells blood concentration, and percentage of immature neutrophils. mRNA set: normalized mRNA Cp in whole blood, IFNG, CD74, CX3CR1, IL7R, and IL1R2. HV: Healthy Volunteers. SEB: Staphylococcal Enterotoxin B. LPS: Lipopolysaccharide. D: Day. Immune Functional Assay: “IL2 SEB pg/mL”: release of IL2 measured after stimulation with SEB. “IFNg SEB pg/mL”: release of interferon gamma measured after stimulation with SEB. “TNFa LPS/NULL”: release of Tumor Necrosis Factor alpha after stimulation with LPS divided by the basal release of TNFα without stimulation (NULL)
Fig. 4
Fig. 4
Empirical evidence supporting the theory of concurrent hyper-inflammation and immunosuppression. The theory of concurrent hyper-inflammation and immunosuppression has been discussed by numerous authors in literature related to critical injury [, , –39].This theory proposes two distinct immune trajectories: one characterized by rapid immune recovery and another by delayed recovery, which is associated with an increased incidence of adverse outcomes. In this figure, we associate our empirical Immunotype #2 with the trajectory of rapid recovery (in green) and Immunotype #1 with the trajectory of delayed recovery (in red), thereby reinforcing the current theory

References

    1. Ikuta KS, et al. Global mortality associated with 33 bacterial pathogens in 2019: a systematic analysis for the Global Burden of Disease Study 2019. Lancet. 2022;400(10369):2221–2248. doi: 10.1016/S0140-6736(22)02185-7. - DOI - PMC - PubMed
    1. Singer M, et al. The third international consensus definitions for sepsis and septic shock (Sepsis-3) JAMA. 2016;315(8):801–810. doi: 10.1001/jama.2016.0287. - DOI - PMC - PubMed
    1. Mira JC, et al. Sepsis pathophysiology, chronic critical illness, and persistent inflammation-immunosuppression and catabolism syndrome. Crit Care Med. 2017;45(2):253–262. doi: 10.1097/CCM.0000000000002074. - DOI - PMC - PubMed
    1. Marshall JC. Why have clinical trials in sepsis failed? Trends Mol Med. 2014;20(4):195–203. doi: 10.1016/j.molmed.2014.01.007. - DOI - PubMed
    1. Antcliffe DB, et al. Transcriptomic signatures in sepsis and a differential response to steroids. From the VANISH randomized trial. Am J Respir Crit Care Med. 2019;199(8):980–986. doi: 10.1164/rccm.201807-1419OC. - DOI - PMC - PubMed

Publication types

LinkOut - more resources