. 2024 Oct;15(5):1772-1784.
doi: 10.1002/jcsm.13529. Epub 2024 Jul 15.

Skeletal muscle p53-depletion uncovers a mechanism of fuel usage suppression that enables efficient energy conservation

Affiliations

Skeletal muscle p53-depletion uncovers a mechanism of fuel usage suppression that enables efficient energy conservation

Georgia Lenihan-Geels et al. J Cachexia Sarcopenia Muscle. 2024 Oct.

Abstract

Background: The ability of skeletal muscle to respond adequately to changes in nutrient availability, known as metabolic flexibility, is essential for the maintenance of metabolic health and loss of flexibility contributes to the development of diabetes and obesity. The tumour suppressor protein, p53, has been linked to the control of energy metabolism. We assessed its role in the acute control of nutrient allocation in skeletal muscle in the context of limited nutrient availability.

Methods: A mouse model with inducible deletion of the p53-encoding gene, Trp53, in skeletal muscle was generated using the Cre-loxP-system. A detailed analysis of nutrient metabolism in mice with control and knockout genotypes was performed under ad libitum fed and fasting conditions and in exercised mice.

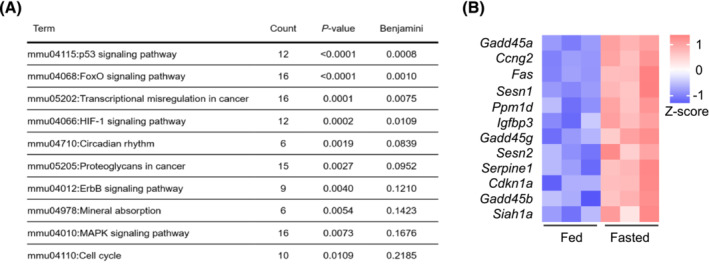
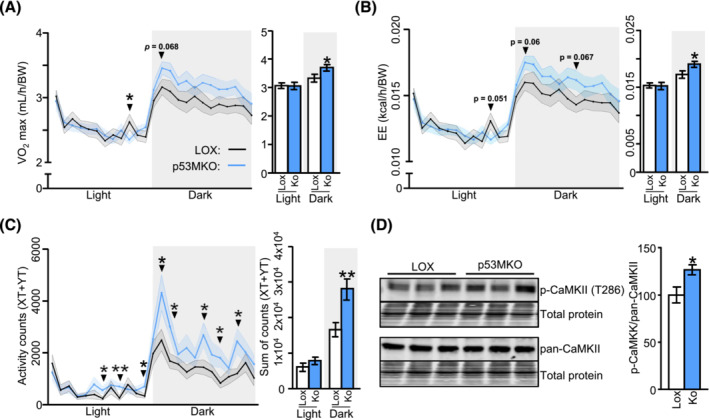
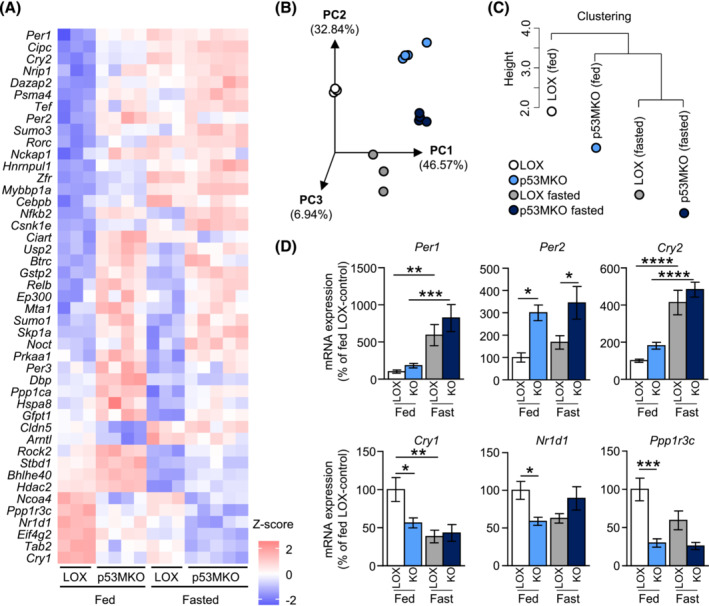
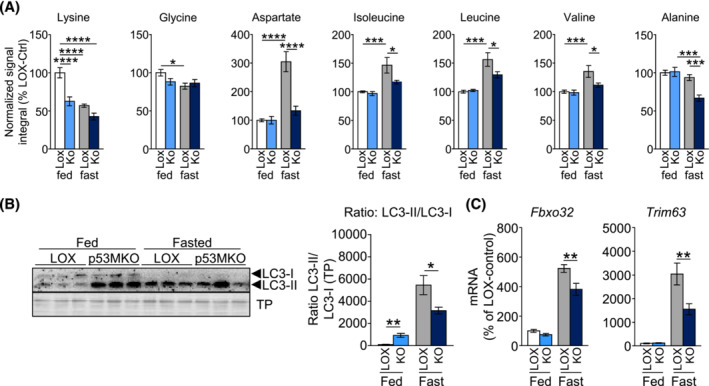
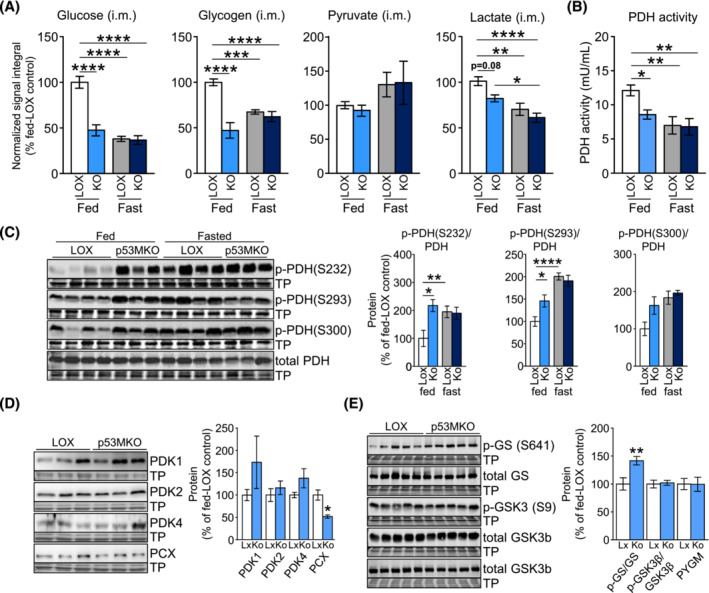
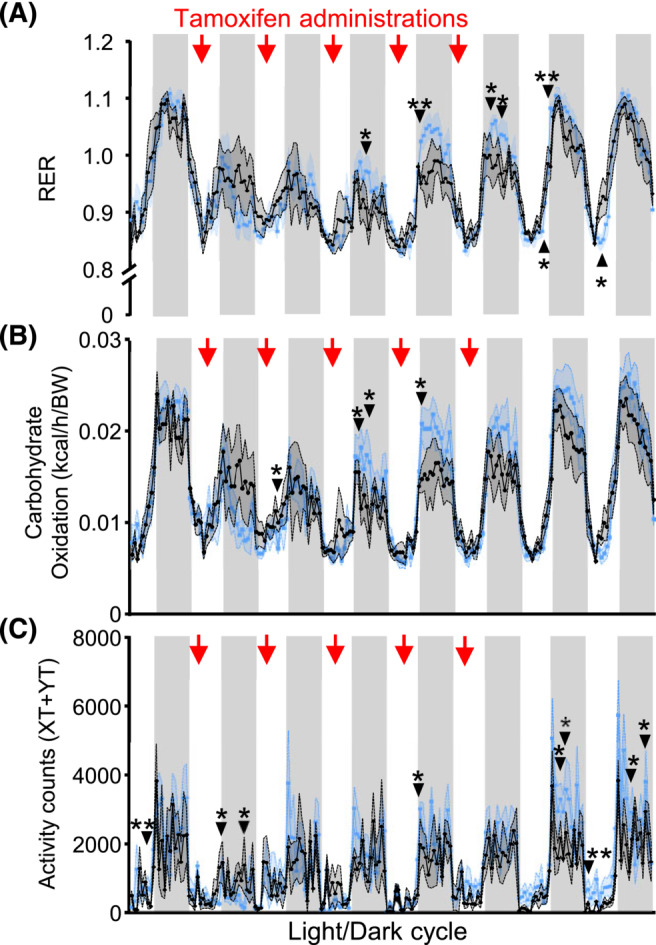
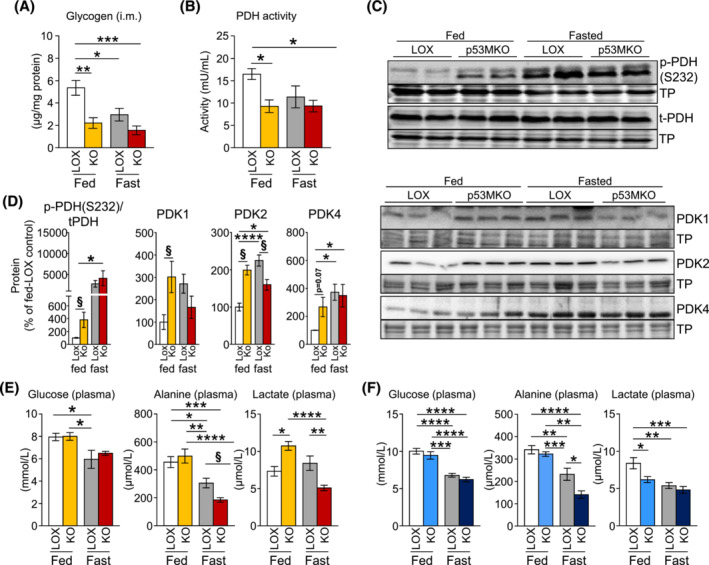
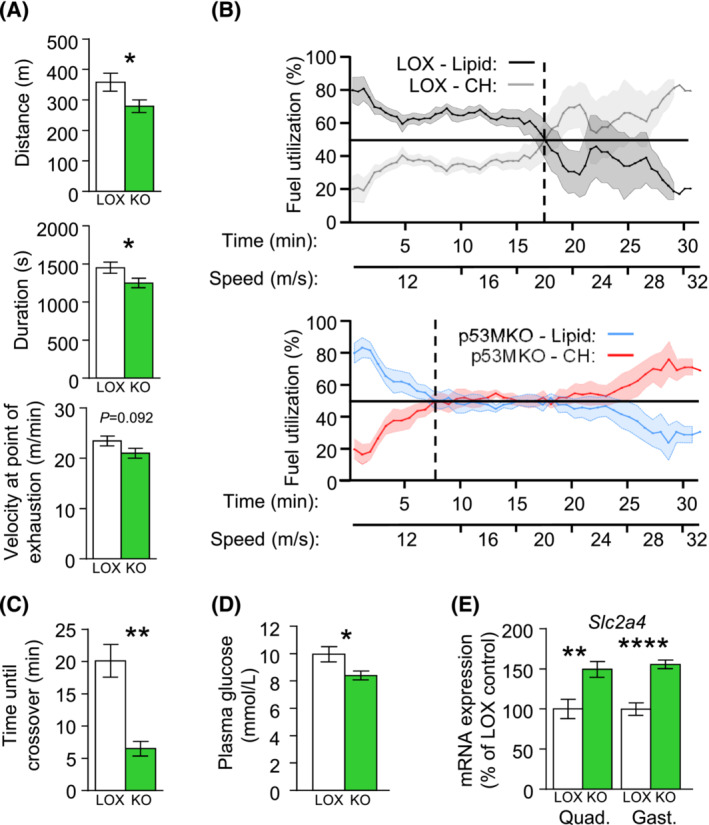
Results: Acute deletion of p53 in myofibres of mice activated catabolic nutrient usage pathways even under ad libitum fed conditions, resulting in significantly increased overall energy expenditure (+10.6%; P = 0.0385) and a severe nutrient deficit in muscle characterized by depleted intramuscular glucose and glycogen levels (-62,0%; P < 0.0001 and -52.7%; P < 0.0001, respectively). This was accompanied by changes in marker gene expression patterns of circadian rhythmicity and hyperactivity (+57.4%; P = 0.0068). These metabolic changes occurred acutely, within 2-3 days after deletion of Trp53 was initiated, suggesting a rapid adaptive response to loss of p53, which resulted in a transient increase in lactate release to the circulation (+46.6%; P = 0.0115) from non-exercised muscle as a result of elevated carbohydrate mobilization. Conversely, an impairment of proteostasis and amino acid metabolism was observed in knockout mice during fasting. During endurance exercise testing, mice with acute, muscle-specific Trp53 inactivation displayed an early exhaustion phenotype with a premature shift in fuel usage and reductions in multiple performance parameters, including a significantly reduced running time and distance (-13.8%; P = 0.049 and -22.2%; P = 0.0384, respectively).

Conclusions: These findings suggest that efficient nutrient conservation is a key element of normal metabolic homeostasis that is sustained by p53. The homeostatic state in metabolic tissues is actively maintained to coordinate efficient energy conservation and metabolic flexibility towards nutrient stress. The acute deletion of Trp53 unlocks mechanisms that suppress the activity of nutrient catabolic pathways, causing substantial loss of intramuscular energy stores, which contributes to a fasting-like state in muscle tissue. Altogether, these findings uncover a novel function of p53 in the short-term regulation of nutrient metabolism in skeletal muscle and show that p53 serves to maintain metabolic homeostasis and efficient energy conservation.

Keywords: Energy conservation; Metabolic efficiency; Metabolic homeostasis; Metabolism; Skeletal muscle; p53.


Conflict of interest statement

The authors declare no competing interests.

Figures

Figure 1
Figure 1
p53 signalling is induced following 16 h fasting in quadriceps muscle. (A) KEGG pathway analysis from quadriceps muscle RNAseq analysis comparing differentially expressed genes (P < 0.05, log‐fold change [LFC] > 1) in control versus 16‐h fasted, wild‐type C57BL/6J mice (n = 3 per group). Counts depicts the number of genes in each KEGG term. (B) Genes upregulated in quadriceps of 16‐h fasted mice compared with control from KEGG term p53 signalling pathway from RNAseq analysis.
Figure 2
Figure 2
Acute deletion of Trp53 in myofibres increases energy expenditure and locomotor activity. (A) Oxygen consumption (VO2) and average maximal oxygen consumption (VO2 max; right panel) in light/dark phase of control mice carrying lox‐P elements on both alleles but do not carry a CreERT2‐allele (LOX; black line /white bars) and p53MKO (blue line/blue bars) mice after 5‐day tamoxifen exposure and 2‐day recovery. (B) Energy expenditure (EE) and average maximal energy expenditure (EE max; right panel) in light/dark phase of control and p53MKO mice. (C) Activity counts expressed as XT + YT movements and sum of activity counts (XT + YT; right panel) in light/dark phase in control and p53MKO mice. (D) Protein levels of phosphorylated‐CaMKII (T286) and pan‐CaMKII in quadriceps muscle, with quantification of p‐CaMKII (T286) relative to pan‐CaMKII, normalized to total protein loading. Results presented as mean ± SEM and compared by t‐test with Welch's correction, or multiple t‐testing (n = 14 for A–C; n = 8–10 for D); *P < 0.05, **P < 0.01.
Figure 3
Figure 3
Acute loss of p53 induces a fasting‐like circadian gene expression signature in muscle. (A) Heatmap of circadian gene transcripts altered (P < 0.05; presented as Z‐scores) by acute Trp53 deletion in quadriceps in fed and fasted conditions from RNAseq analysis comparing control (LOX) and p53MKO (KO) mice under fed and 16‐h fasted conditions (n = 3–5). (B) 3D principal component analysis (PCA) representation and (C) hierarchical clustering analysis of fed control (white/black circles), fed p53MKO (light blue circles), fasted control (grey circles), and fasted p53MKO (dark blue circles) mice based on circadian‐related gene transcripts. (D) mRNA expression of Per1, Per2, Cry2, Cry1, Nr1d1, and Ppp1r3c in quadriceps of p53MKO mice in fed (LOX: White bars; p53MKO blue bars) and 16‐h fasted (LOX: Grey bars; p53MKO: Dark blue bars) conditions. Results presented as mean ± SEM; data in (D) were compared by two‐way ANOVA (n = 8–11); *P < 0.05, **P < 0.01, ***P < 0.001, ****P < 0.0001.
FIGURE 4
FIGURE 4
p53MKO mice demonstrate distinct changes in amino acid metabolism under fed and fasted conditions. (A) NMR spectroscopic analysis of intramuscular amino acids lysine, glycine, alanine, aspartate, isoleucine, leucine, valine and alanine in quadriceps of control (LOX) and p53MKO (KO) mice in the fed state (control: white bars; p53MKO: light blue bars) and following 16 h of food withdrawal (control: grey bars; p53MKO: dark blue bars). (B) Representative detection (left panel) of protein levels of LC3‐II and LC3‐I in quadriceps muscle of control and p53MKO mice in the fed state (LOX: white bars; p53MKO: blue bars) and following 16 h of food withdrawal (LOX: grey bars; p53MKO: dark blue bars) and quantification of LC3II:LC3I ratio normalized to total protein (right panel). (C) mRNA expression of Fbxo32 and Trim63 in quadriceps muscle under similar conditions. Results presented as mean ± SEM and compared by two‐way ANOVA (n = 5–10 for A and B, and n = 9–11 for C); *P < 0.05, **P < 0.01, ***P < 0.001, ****P < 0.0001.
Figure 5
Figure 5
Acute Trp53 deletion results in depleted intramuscular glucose and glycogen stores. (A) NMR spectroscopic analysis of intramuscular glucose, glycogen, pyruvate, and lactate levels in quadriceps muscle from control (LOX) and p53MKO (KO) mice during fed conditions (LOX: white bars; p53MKO: light blue bars) and following 16 h of food withdrawal (LOX: grey bars; p53MKO: dark blue bars). (B) Pyruvate dehydrogenase (PDH) activity in quadriceps of control and p53MKO mice under fed and fasted conditions. (C) Representative immunodetections (left panels) and quantifications (right panels) of phosphorylated PDH (p‐PDH at residues: S232, S293, and S300) and total PDH in quadriceps muscle under fed and fasted conditions and normalized to total PDH and total protein loading. (D) Representative immunodetections (left panels) and quantifications (right panels) of pyruvate dehydrogenase kinase isoforms (PDK1, PDK2, and PDK4) and pyruvate carboxylase (PCX) in quadriceps muscle under fed and fasted conditions and normalized to total protein loading. (E) Representative immunodetections (left panels) and quantifications (right panels) of glycogen synthase (GS) phosphorylation (p‐GS at S641), total GS, glycogen synthase kinase 3‐beta (GSK3‐beta) phosphorylation (p‐GHSK3b at S9), total GSK3‐beta, and total glycogen phosphorylase (PYGM) in quadriceps muscle under fed and fasted conditions and normalized to total corresponding protein (for p‐GS, p‐GSK3‐beta) and total protein loading. Results presented as mean ± SEM; data in (A)–(C) compared by two‐way ANOVA (n = 8–10); data in (C) and (E) compared by Mann–Whitney test (n = 7–11); *P < 0.05, **P < 0.01, ***P < 0.001, ****P < 0.0001.
Figure 6
Figure 6
Acute Trp53 deletion in myofibres leads to rapid and transient metabolic adaptations. (A) Respiratory exchange ratio (RER), (B) carbohydrate oxidation, (C) activity counts measured as XT + YT movements in control (black line) and p53MKO (blue line) animals with ad libitum food access during 8 days' tracing energy metabolism changes during induced Trp53 inactivation. Red arrows indicate days of tamoxifen administration. Results presented as mean ± SEM and were compared by multiple t‐tests (n = 4–5); *P < 0.05, **P < 0.01.
Figure 7
Figure 7
Anaerobic glucose breakdown occurs in response to elevated glucose mobilization following Trp53 inactivation. (A) Intramuscular glycogen levels, measured by a biochemical assay, in quadriceps muscle from control (LOX) and p53MKO (KO) mice during fed conditions (LOX: white bars; p53MKO: yellow bars) and following 4 h of food withdrawal (4 pm to 8 pm; LOX: Grey bars; p53MKO: orange bars) in mice directly after an abbreviated course of short‐term (3‐day) tamoxifen administration. (B) Pyruvate dehydrogenase (PDH) activity in quadriceps of control and p53MKO mice under fed and fasted conditions after short‐term tamoxifen. (C) Representative immunodetections and (D) quantifications of phosphorylated PDH (p‐PDH at S232), total PDH (t‐PDH), pyruvate dehydrogenase kinase isoforms (PDK1, PDK2, and PDK4) in quadriceps muscle under fed and fasted conditions and normalized to total corresponding protein (for p‐PDH) and total protein (TP) loading (conditions as described in panel A). (E) Plasma glucose, alanine, and lactate measured in plasma in fed and fast conditions in mice directly after an abbreviated course of short‐term (3‐day) tamoxifen administration. (F) Plasma glucose, alanine, and lactate measured in plasma of LOX and p53MKO mice during fed conditions (LOX: white bars; p53MKO: light blue bars) and following 16 h of food withdrawal (LOX: grey bars; p53MKO: dark blue bars) after receiving the full course of 5‐day tamoxifen and 2‐day recovery before organ collection. Results presented as mean ± SEM; data were compared by two‐way ANOVA (A–E: N = 3–5; F: N = 8–10); *P < 0.05, **P < 0.01, ***P < 0.001, ****P < 0.0001.
FIGURE 8
FIGURE 8
p53MKO mice exhibit reduced exercise capacity and metabolic inflexibility. (A) Total distance of run, duration of run, and final velocity at point of exhaustion comparing control (LOX; white bars) and p53MKO (KO; green bars) mice undergoing an acute endurance treadmill running bout until exhaustion. (B) Percent fuel utilization of control animals (upper panel), depicting percentage of lipid (black line) and CH oxidation (grey line), and p53MKO animals (lower panel; lipid: blue line; CH: red line). The point of crossover, at which lipid and CH fuel utilization are equal, is represented by the vertical dashed lines. (C) Time at sustained first crossover point in control (white bar) and p53MKO (green bar) mice. (D) Plasma glucose levels of control and p53MKO mice after acute endurance running. (E) mRNA expression of Slc2a4 in quadriceps and gastrocnemius of control and p53MKO mice after acute endurance exercise. Results presented as mean ± SEM and analysed by t‐test with Welch's correction (n = 4 in B, C; n = 9–14 in a, D, E); *P < 0.05, **P < 0.01, ***P < 0.001, ****P < 0.0001.

References

    1. Smith RL, Soeters MR, Wüst RCI, Houtkooper RH. Metabolic flexibility as an adaptation to energy resources and requirements in health and disease. Endocr Rev 2018;39:489–517. - PMC - PubMed
    1. Fouad YA, Aanei C. Revisiting the hallmarks of cancer. Am J Cancer Res 2017;7:1016–1036. - PMC - PubMed
    1. Labuschagne CF, Zani F, Vousden KH. Control of metabolism by p53 ‐ cancer and beyond. Biochim Biophys Acta Rev Cancer 2018;1870:32–42. - PMC - PubMed
    1. Prokesch A, Graef FA, Madl T, Kahlhofer J, Heidenreich S, Schumann A, et al. Liver p53 is stabilized upon starvation and required for amino acid catabolism and gluconeogenesis. FASEB J 2017;31:732–742. - PMC - PubMed
    1. Schupp M, Chen F, Briggs ER, Rao S, Pelzmann HJ, Pessentheiner AR, et al. Metabolite and transcriptome analysis during fasting suggest a role for the p53‐Ddit4 axis in major metabolic tissues. BMC Genomics 2013;14:758. - PMC - PubMed

Substances