[Preprint]. 2024 Jul 2:rs.3.rs-4535534.
doi: 10.21203/rs.3.rs-4535534/v1.

Proteogenomics in cerebrospinal fluid and plasma reveals new biological fingerprint of cerebral small vessel disease

Affiliations

Proteogenomics in cerebrospinal fluid and plasma reveals new biological fingerprint of cerebral small vessel disease

Stephanie Debette et al. Res Sq. .

Abstract

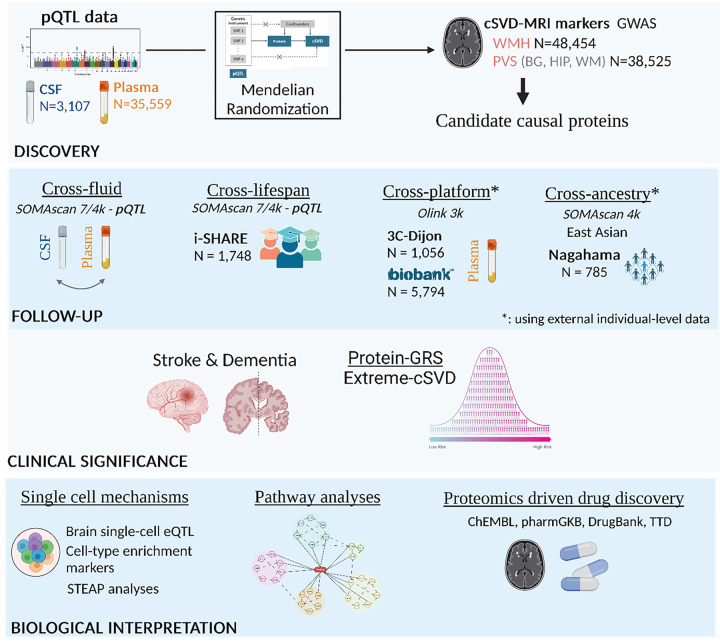
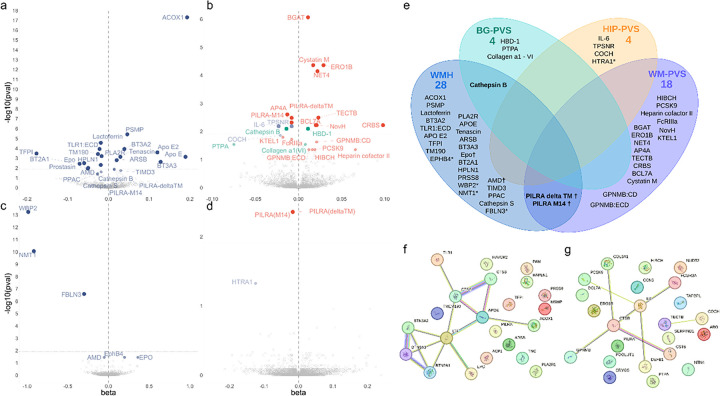
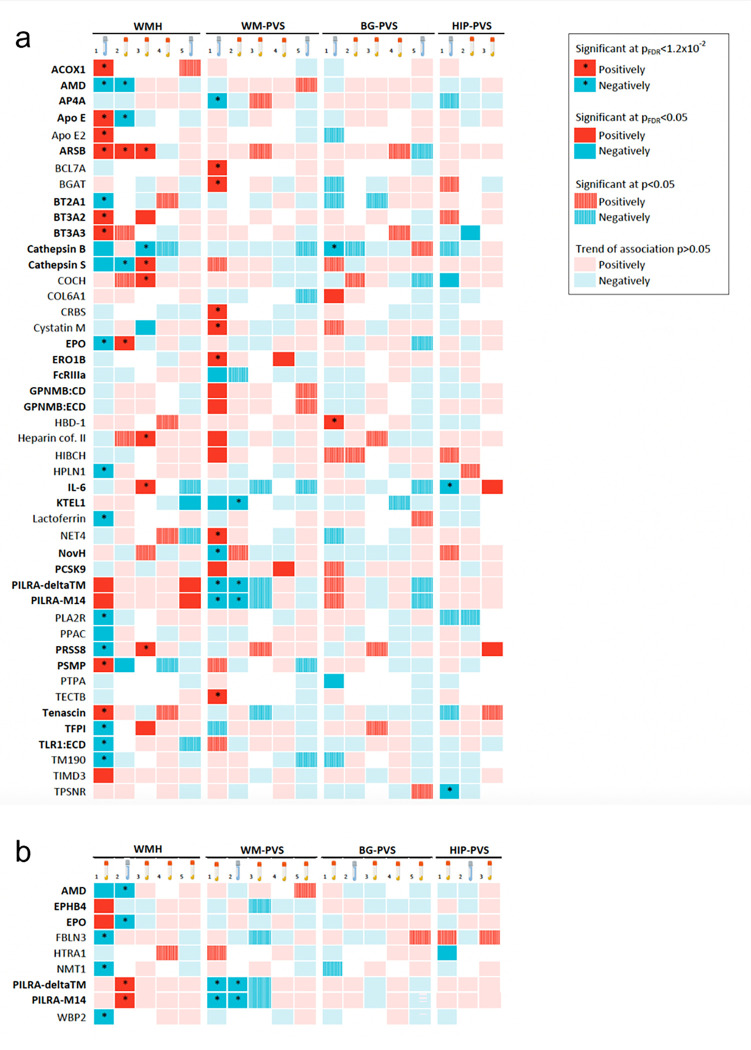
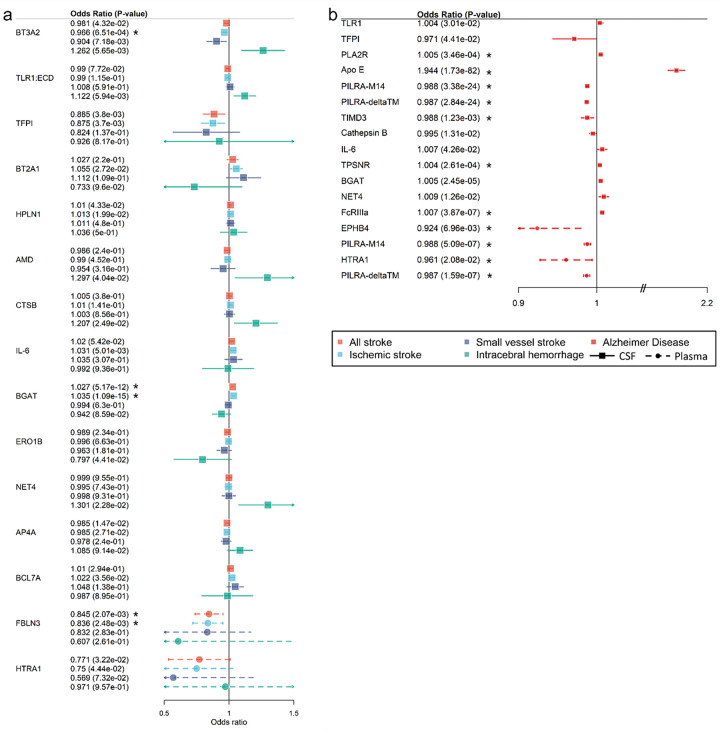
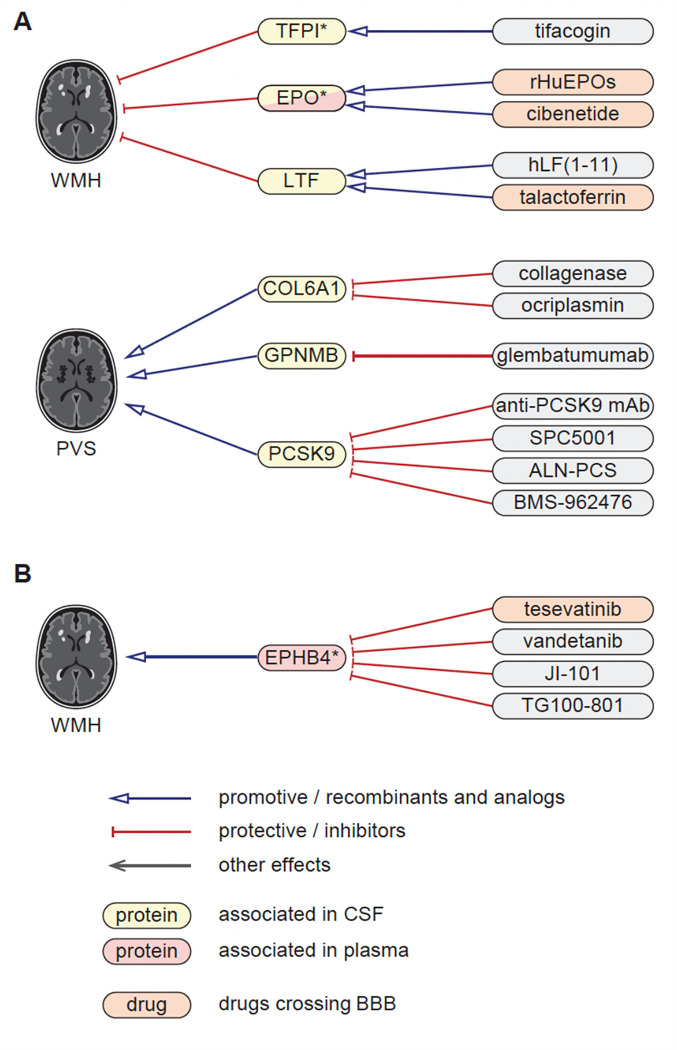
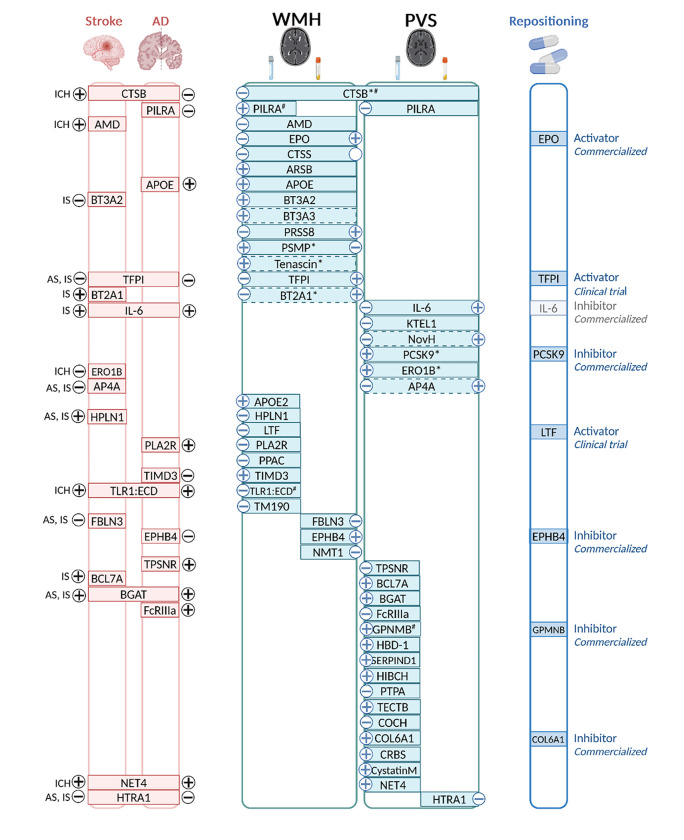
Cerebral small vessel disease (cSVD) is a leading cause of stroke and dementia with no specific mechanism-based treatment. We used Mendelian randomization to combine a unique cerebrospinal fluid (CSF) and plasma pQTL resource with the latest European-ancestry GWAS of MRI-markers of cSVD (white matter hyperintensities, perivascular spaces). We describe a new biological fingerprint of 49 protein-cSVD associations, predominantly in the CSF. We implemented a multipronged follow-up, across fluids, platforms, and ancestries (Europeans and East-Asian), including testing associations of direct plasma protein measurements with MRI-cSVD. We highlight 16 proteins robustly associated in both CSF and plasma, with 24/4 proteins identified in CSF/plasma only. cSVD-proteins were enriched in extracellular matrix and immune response pathways, and in genes enriched in microglia and specific microglial states (integration with single-nucleus RNA sequencing). Immune-related proteins were associated with MRI-cSVD already at age twenty. Half of cSVD-proteins were associated with stroke, dementia, or both, and seven cSVD-proteins are targets for known drugs (used for other indications in directions compatible with beneficial therapeutic effects. This first cSVD proteogenomic signature opens new avenues for biomarker and therapeutic developments.


Conflict of interest statement

Competing interests C.C. has received research support from GSK and EISAI and is a member of the advisory board of Circular Genomics and owns stocks in this company. CC is part of the scientific advisory board for ADmit. B.P. serves on the Steering Committee of the Yale Open Data Project funded by Johnson & Johnson. P.M.M. has received an honourarium as Chair of the UKRI Medical Research Council Neuroscience and Mental Health Board until March 2024. He acknowledges consultancy fees from, Biogen, Sudo. Nimbus and GSK. He has received speakers’ honoraria from Sanofi and Redburn, and has received research or educational funds from Biogen, Merck, Bristol Meyers Squibb and Nimbus. J.W declares no commercial COI; various academic research grants and is CI for LACunar Intervention Trials. The authors declared no potential conflicts of interest with respect to research, authorship, and/or publication of this article. The funders had no role in study design, data collection and analysis, decision to publish or preparation of the manuscript.

Figures

Figure 1
Figure 1. Summary of the analysis plan.
pQTL: protein quantitative trait loci, CSF: Cerebrospinal fluid, WMH: White matter hyperintensities, PVS: Perivascular Spaces burden, BG: basal ganglia, HIP: hippocampus, WM: white matter. # Cross-platform follow-up analyses have been conducted using a meta-analysis of 3C and UK Biobank
Figure 2
Figure 2. Discovery protein-cSVD associations in CSF and plasma using cis-pQTL mendelian randomization.
A. Volcano plots of proteins associated with white matter hyperintensities (WMH) using cis-pQTL MR in CSF. B. Volcano plots of proteins associated with perivascular spaces burden (PVS) using cis-pQTL MR in CSF. C. Volcano plots of proteins associated with WMH using cis-pQTL MR in plasma. D. Volcano plots of proteins associated with PVS using cis-pQTL MR in plasma. Each dot represents the MR results for proteins. Each dot represents the MR results for proteins. FDR-corrected p-values are represented in this graph. Represented proteins are significantly associated with MRI-marker at pFDR (Benjamini-Hochberg false discovery rate threshold) < 0.05. The dotted line in each volcano plot represents the corrected threshold after additionally correcting for the number of phenotypes tested (p<0.0125). E. Venn diagram of identified causal proteins associated with MRI-cSVD. * proteins identified in plasma; † proteins associated in both plasma and CSF; other proteins are associated in CSF. F. String plot of proteins associated with WMH. G. String plot of proteins associated with PVS (WM, BG and HIP). Network nodes represent proteins: colored nodes query proteins and first shell of interactors. Edges represent protein-protein associations. Cyan and pink edges are known interactions, cyan: from curated databases, and pink: experimentally determined. Green and blue edges correspond to predicted interactions. Green: gene neighborhood, and blue: gene co-occurrence. Purple corresponds to protein homology, yellow to text mining and black to co-expression.
Figure 3
Figure 3. Summary of proteomics follow-up (discovery, cross-fluid, cross-platform, cross-ancestry and lifespan)
A. Heatmap of proteomic findings using CSF discovery analysis. B. Heatmap of proteomic findings using plasma discovery analysis. 1. Discovery Mendelian randomization using cis-pQTL from CSF (A) and plasma (B). 2. Cross-fluid follow-up Mendelian randomization using cis-pQTL from plasma (A) and CSF (B). 3. Cross-platform follow-up using plasma individual-level data measured with Olink in independent samples (3C, UKB). 4. Cross-ancestry follow-up using plasma individual-level data measured with Somascan in an independent sample (Nagahama). 5. Lifespan follow-up Mendelian randomization using cis-pQTL from CSF (A) and plasma (B). Dark squares correspond to significant results after FDR correction (pFDR<0.05). * corresponds to significant associations after correction for the 4 phenotypes tested (pFDR<0.0125). Hatched squares correspond to p<0.05 results. Red squares correspond to a positive association and blue to negative association. Proteins missing for one of the follow-up analyses are represented with a white square. # results of the analysis of 3C only. Proteins in bold are those showing at least one nominally significant association (p<0.05) in follow-up analyses, with the same MRI-cSVD marker as in the discovery.
Figure 4
Figure 4. Clinical significance of protein-cSVD findings in CSF and plasma.
A. Forest plot of protein-cSVD associations with stroke and its subtypes (ischemic stroke, small vessel stroke and intracerebral hemorrhage). B. Forest plot of protein-cSVD association with Alzheimer’s disease. All proteins associated with MRI-cSVD identified in the discovery analysis in CSF and plasma were used for this analysis. Full lines represent proteins measured in CSF. Dotted lines represent proteins measured in plasma. Proteins significant at least at p<0.05 for at least one of the outcomes tested are represented (for stroke, associations with all (sub)types are represented when one or more was significant). * Results significant after multiple testing correction (pFDR<0.05)
Figure 5
Figure 5. Proteomics-driven drug discovery.
A. Drug-discovery analysis conducted using CSF protein-cSVD Mendelian randomization estimates for WMH and PVS findings. B. Drug-discovery analysis conducted using plasma protein-cSVD Mendelian randomization estimates for WMH. Proteins in yellow correspond to proteins associated with the MRI-cSVD marker in CSF and in red in plasma, in discovery analyses. * proteins with significant associations in at least one of the follow-up modalities (at p<0.05). Red arrows correspond to a protective effect of a protein on MRI-cSVD (reducing cSVD burden) or an inhibitor effect of a drug on the cSVD-associated protein; blue arrows correspond to a of deleterious effects of a protein on MRI-cSVD (promoting cSVD burden) or an analog effect of a drug on the cSVD-associated protein. Drugs in orange cross the blood brain barrier. CSF: cerebrospinal fluid, BBB: blood brain barrier.
Figure 6
Figure 6. Integrated summary of our findings.
Proteins associations with WMH, PVS, or both are represented in the middle. For each MRI-marker, the left side corresponds to CSF findings and the right side to plasma findings. * proteins with cross-ancestry association. # proteins with lifespan association. Associations with stroke Alzheimer’s disease (AD), or both are represented on the left of the figure. Subtypes of stroke are as follows: AS: Any stroke, IS: Ischemic stroke, SVS: Small vessel stroke, ICH: Intracerebral hemorrhage. − and + signs correspond to the direction of association referring to higher level of the protein. Drug repositioning is represented on the right of the figure.

References

    1. Wardlaw J. M. et al. ESO Guideline on covert cerebral small vessel disease. Eur. Stroke J. 6, CXI–CLXII (2021). - PMC - PubMed
    1. Duering M. et al. Neuroimaging standards for research into small vessel disease-advances since 2013. Lancet Neurol. 22, 602–618 (2023). - PubMed
    1. Wardlaw J. M. et al. Vascular risk factors, large-artery atheroma, and brain white matter hyperintensities. Neurology 82, 1331–1338 (2014). - PMC - PubMed
    1. Rusina P. V. et al. Genetic support for FDA-approved drugs over the past decade. Nat. Rev. Drug Discov. 22, 864 (2023). - PubMed
    1. Duperron M.-G. et al. Genomics of perivascular space burden unravels early mechanisms of cerebral small vessel disease. Nat. Med. 29, 950–962 (2023). - PMC - PubMed

Publication types

LinkOut - more resources