. 2024 Jul 1:15:1363555.
doi: 10.3389/fpls.2024.1363555. eCollection 2024.

SYNAPTOTAGMIN 4 is expressed mainly in the phloem and participates in abiotic stress tolerance in Arabidopsis

Affiliations

SYNAPTOTAGMIN 4 is expressed mainly in the phloem and participates in abiotic stress tolerance in Arabidopsis

Ajay Kumar et al. Front Plant Sci. .

Abstract

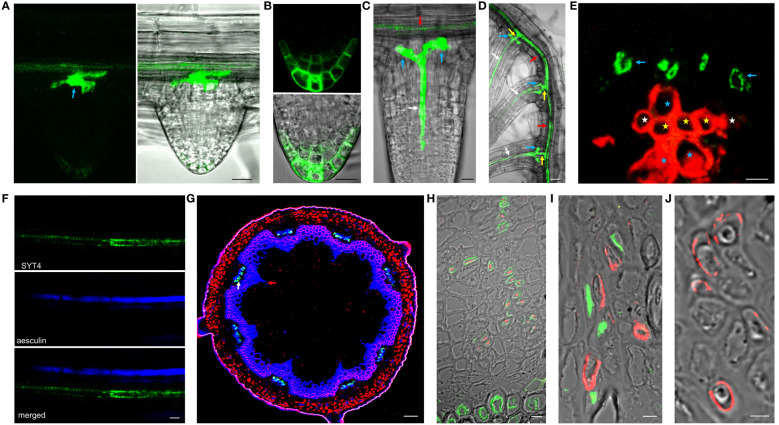
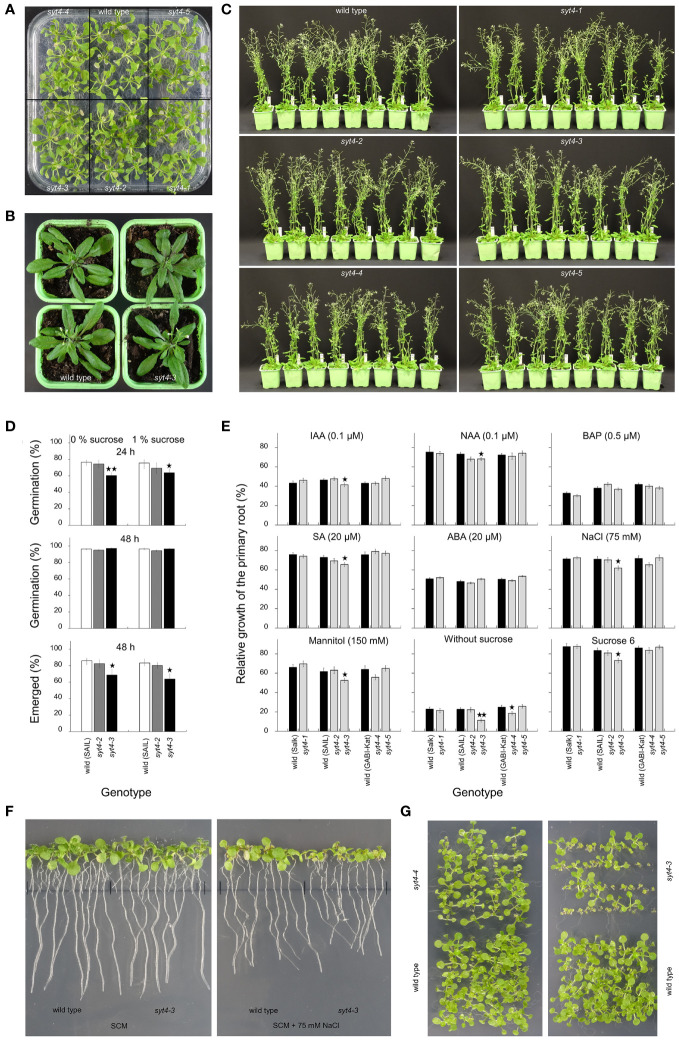
Plant synaptotagmins structurally resemble animal synaptotagmins and extended-synaptotagmins. Animal synaptotagmins are well-characterized calcium sensors in membrane trafficking, and extended-synaptotagmins mediate lipid transfer at the endoplasmic reticulum-plasma membrane contact sites. Here, we characterize SYNAPTOTAGMIN 4 (SYT4), which belongs to the six-member family in Arabidopsis. Fluorometric GUS assay showed that the SYT4 promoter was strongest in roots and the least active in rosettes and cauline leaves, which was confirmed by qPCR. In seedlings, promoter activity was influenced by several factors, such as plant growth regulators, mannitol, sucrose, polyethylene glycol and cold. GUS histochemistry revealed SYT4 promoter activity in the phloem of all organs and even almost exclusively in sieve element precursors and differentiating sieve elements. Accordingly, the SYT-GFP fusion protein also accumulated in these cells with maximal abundance in sieve element precursors. The protein formed a network in the cytoplasm, but during sieve tube differentiation, it deposited at the cell periphery and disappeared from mature tubes. Using photoconvertible fluorescence technology, we showed that a high abundance of SYT4 protein in meristematic protophloem cells was due to its extensive synthesis. SYT4 protein synthesis was interrupted in differentiating sieve elements, but protein degradation was also reduced. In addition to phloem, the fusion protein was detected in shoot and root stem cell niche as early as the late heart stage of the embryo. We isolated and molecularly and biologically characterized five syt4 T-DNA insertion alleles and subjected them to phenotype analysis. The allele with the C2B domain interrupted by an T-DNA insertion exhibits increased sensitivity to factors such as auxins, osmotics, salicylic acid, sodium chloride, and the absence of sucrose in the root growth test.

Keywords: Arabidopsis SYT4; gene expression; insertion mutants; phloem; root cap; stress response.


Conflict of interest statement

The authors declare that the research was conducted in the absence of any commercial or financial relationships that could be construed as a potential conflict of interest. The author(s) declared that they were an editorial board member of Frontiers, at the time of submission. This had no impact on the peer review process and the final decision.

Figures

Figure 1
Figure 1
SYT4 promoter activity and transcript abundance. (A) shows the GUS fluorometric analysis of promoter activity in different organs of three homozygous, pot-grown pSYT4-GUS transgenic lines with one T-DNA insert in growth stage 6.50 (Boyes et al., 2001; values in columns followed with different letters are significantly different, p ≤ 0.05, n=8). The pattern of SYT4 promoter activity in the root using whole mount histochemical GUS procedure is in (B). (C) shows the root part in the transition zone (300 – 600 µM from QC, asterisk in B). Cross sections through the primary root of two-week-old seedlings are at a distance of 80 µM (D), 1 mm (E) and 4 mm (G) from QC (in BE and G white arrows point to PP, yellow to MP, red to CC, blue to phloem PC and green to phloem pole pericycle; white asterisks mark protoxylem, yellow metaxylem, blue primary xylem elements). (F) shows the root area with a differentiating protoxylem (black arrow) and several files of GUS-positive cells in the phloem (white arrow). In lateral roots, the promoter was very active in clumps of cells at the base of the lateral root primordium (red arrow in H) and phloem PC (green arrow). Leaves show GUS activity in the vasculature (I). Young shoots show a strong signal in the phloem pole differentiating from PC (J, the reaction was performed on a hand section). In the shoot in the early stage of secondary thickening, different phloem cells show the variable intensity of staining (K, whole mount samples treated for GUS detection were fixed and sectioned; the red color is due to basic fuchsine staining). The inflorescence shows intense GUS activity in the anthers (green arrows in L), the pistil vasculature (blue arrows), and the flower abscission zone (red arrows). Ovules and seeds are GUS-positive at their chalazal poles (M, N), but no promoter activity was identified during embryogenesis (O). In embryos of seeds imbibed for 24 h, the signal was evident in the root and hypocotyl phloem PC in the form of two files (P). After 72 h, staining was present in the vasculature along the entire seedling body, and several starting points of PP differentiation were observed (Q). (R) shows the effects of different factors on promoter activity in roots and aboveground parts estimated by the GUS fluorometry assay (differences between the treated and control samples are indicated by single asterisk for p < 0.05 and double asterisks for p < 0.01, n = 9). (S) displays transcript abundance of SYT4 in different organs analyzed by real-time qPCR (values in columns followed with different letters are significantly different, p ≤ 0.05, n=4).). Size bars – (C–E, G, J, K, M) =10 µm; (O) = 25 µm; (B, F, H, I, N, P) = 50 µm; (L, Q) =500 µm.
Figure 2
Figure 2
SYT4 protein in embryos and seedlings. In mature ovules (A) and developing seeds (B), SYT4-GFP fusion protein is present only in the vasculature of funicules and chalazal poles. In embryos, the fusion protein first appears in both shoot (yellow arrow) and root (red arrow) apical meristem during their late heart-shaped stage (C; in D, is a close-up view of the shoot, and in (E) root apical meristem of this stage embryo), and subsequently in PC during the late torpedo stage (white arrow in F; other arrows as in C). In germinating embryos (48 h after seed imbibition), the signal is visible in the root and hypocotyl as two files (G) and in the midvein and secondary veins in cotyledons (H). The signal is also present in the shoot apical meristem in advanced 6-day-old seedlings (yellow arrow in I; white arrows point to phloem files in the pedicel of cotyledon, which was removed, red arrows to leaf primordia). In a fully developed root tip, SYT4 partially colocalizes with PIN4 and is abundant mainly in columella initials and the outermost RC layer (J; white arrow points to PP, yellow to QC, blue to columella initials, purple to endodermis/cortex initials and red to lateral RC/epidermis initials, asterisk marks the outermost RC layer). (K, L) represent transversal sections of the root at different distances from QC and show fusion protein in developing phloem. The red signal is due to propidium iodide staining. SYT4 is abundant in PP (white arrows in K). More proximally, SYT4 is present in MP (yellow arrow in L), CC (red arrows), and less abundantly in PP (white arrow) and phloem PC (blue arrow; white asterisks mark protoxylem, yellow metaxylem and blue primary xylem elements). SYT4 accumulates at the periphery of developing PP (M) and SE (N). In the inflorescence stem in the stage of primary growth, SYT4 is present exclusively in the phloem pole of PC (white arrows in O; red arrows point to the xylem poles of PC). Size bars – (A, C–E, I–N) =10 µm; (F–H) = 50 µm; (B) = 100 µm; (O) = 200 µm.
Figure 3
Figure 3
Localisation and dynamics of SYT4 in protophloem cells. (A) shows SYT4-GFP in first cells in the early dividing PP approximately 50 µM from the QC. SYT4 gradually disappears from PP cells, which deposit callose (blue signal due to sirofluor treatment) in their transversal cell walls (B; C shows signal intensities). (D, E) show the dynamic of SYT4 protein in PP estimated by SYT4-Dendra2 fusion protein. The decrease in SYT4 abundance in elongating PP cells is due to the discontinuing synthesis of the fusion protein (green signal in D) in differentiating PP cells. (E) shows values of the green signal emitted by the SYT4-Dendra2 population, which was synthesized within 4 h since photoconversion and red signal intensities emitted by the old photoconverted population. Size bars – (A) = 5 µm; (B) = 50 µm; (D) = 10 µm.
Figure 4
Figure 4
SYT4 in lateral root and inflorescence stem and primary root in the stage of secondary growth. SYT4 protein starts to be visible in emerging lateral roots. A strong signal is detectable in a group of cells in basal parts of roots (blue arrow in A) and also in the developing RC (B), later in PP (white arrow in C) which grows up from the group of cells mentioned above (blue arrows; red arrow point to the phloem of the parental root) and finally also in the cells connecting the phloem of the lateral and the parental root (yellow arrows in D; arrows of other colors are as in A, C). In differentiated roots, SYT4 is present in phloem PC cells developing to primary SEs (blue arrows in E; white asterisks mark protoxylem, yellow metaxylem and blue xylem elements derived from PC) but not in fully developed sieve tubes accumulating aesculin (blue signal in F). In the inflorescence stem in the stage of secondary growth, the green signal is abundant in cells centripetally localized in the phloem (G; the blue signal is due to aniline blue staining; red fluorescence is emitted by chlorophyll). (H–J) show histoimmunological treatment of transverse sections of the primary roots in the stage of secondary growth. SYT4-Dendra2 protein labeled with the antibody against Dendra2 (red signal) is visible in cells labeled with JIM13 specific antibody (green signal in H) but not in cells labeled with the LM5 antibody (green signal in I). In this case, the inner phloem layers’ cells labeled with the Dendra2 antibody (green signal) are located close to cells labeled with LM5 antibody (I). In old phloem regions at the root periphery, Dendra2 labeling is absent in cells adjacent to cells reacting with LM5 antibody (J). Size bars – (I, J) = 5 µm; (E, F, H) = 10 µm; (A–C) = 20 µm; (D) = 50 µm; (G) = 100 µm.
Figure 5
Figure 5
SYT4 transcripts in mutant alleles. (A) indicates the locations of T-DNA inserts and positions of primers employed in genotyping ( Supplementary Figure 1 ) and qPCR. (B) proves the occurrence of SYT4 transcript in mutant alleles by semi-quantitative RT PCR using primers overlapping introns 6 and 7 (A; run for 35 cycles). The same primers were used for real-time qPCR (C; transcript abundance is expressed as a multiple of the average abundance in the wild type, n=3). (D) shows RT-PCR products in syt4 alleles obtained by different combinations of primers (their positions are given in A) by extended numbers of cycles (40–45).
Figure 6
Figure 6
Phenotype analysis of syt4 alleles. (A) shows seedlings germinated and grown on SCM with 1% sucrose. Two wild-type plants and syt4–3 alleles in the stage of inflorescence emerging/the first flower open are shown in (B). (C) shows wild-type plants and syt4 mutants in the growth stage 6.50 (Boyes et al., 2001). Differences between the wild type, and, syt4–2 and syt4–3 alleles in germination rates and proportions of seedlings with fully emerged hypocotyls and cotyledons from the seed coat are shown in (D) (differences between the wild type and mutant alleles are indicated by single asterisks for p ≤ 0.05 and double asterisks for p ≤0.01, n=6, together more than 1000 seeds were analyzed for each genotype). Influence of different factors on elongation of primary roots of syt4 alleles and corresponding wild types are accessible in (E) (differences between the wild type and mutant alleles are indicated by single asterisk for p < 0.05 and double asterisks for p < 0.01, n ≥80). (F) demonstrates the difference in the growth of primary roots between the wild type and syt4–3 allele when grown for the last three days on SCM supplemented with 75 mM NaCl. In (G), seedlings of syt4–3, syt4–4 mutants and wild type germinated and grew on SCM without sucrose.

References

    1. Alonso J. M., Stepanova A. N., Leisse T. J., Kim C. J., Chen H., Shinn P., et al. . (2003). Genome-wide insertional mutagenesis of Arabidopsis thaliana . Science 301, 653–657. doi: 10.1126/science.1086391 - DOI - PubMed
    1. Bauby H., Divol F., Truernit E., Grandjean O., Palauqui J. C. (2007). Protophloem differentiation in early Arabidopsis thaliana development. Plant Cell Physiol. 48, 97–109. doi: 10.1093/pcp/pcl045 - DOI - PubMed
    1. Benavente J. L., Siliqi D., Infantes L., Lagartera L., Mills A., Gago F., et al. . (2021). The structure and flexibility analysis of the Arabidopsis synaptotagmin 1 reveal the basis of its regulation at membrane contact sites. Life Sci. Alliance 4, e202101152. doi: 10.26508/lsa.202101152 - DOI - PMC - PubMed
    1. Benitez-Fuente F., Botella M. A. (2023). Biological roles of plant synaptotagmins. Eur. J. Cell Biol. 102, 151335. doi: 10.1016/j.ejcb.2023.151335 - DOI - PubMed
    1. Blob B., Heo J. O., Helariutta Y. (2018). Phloem differentiation: an integrative model for cell specification. J. Plant Res. 131, 31–36. doi: 10.1007/s10265-017-0999-0 - DOI - PMC - PubMed

LinkOut - more resources