. 2024 Jul 1:14:1406268.
doi: 10.3389/fonc.2024.1406268. eCollection 2024.

Non-small cell lung cancer cells and concomitant cancer therapy induce a resistance-promoting phenotype of tumor-associated mesenchymal stem cells

Affiliations

Non-small cell lung cancer cells and concomitant cancer therapy induce a resistance-promoting phenotype of tumor-associated mesenchymal stem cells

Hanna Sentek et al. Front Oncol. .

Abstract

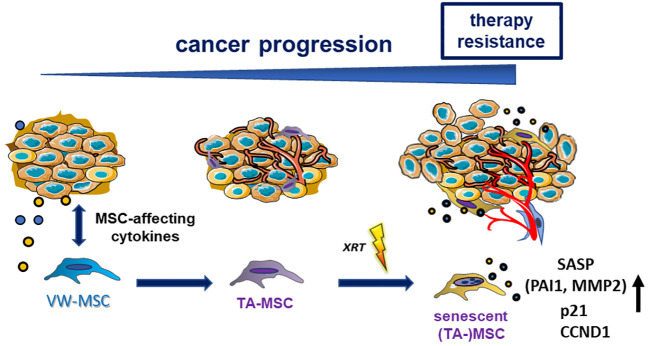
Introduction: The tumor microenvironment gained attraction over the last decades as stromal cells significantly impact on tumor development, progression and metastasis, and immune evasion as well as on cancer therapy resistance. We previously reported that lung-resident mesenchymal stem cells (MSCs) were mobilized and activated in non-small cell lung cancer (NSCLC) progression and could even mediate radiation resistance in co-cultured NSCLC cells.

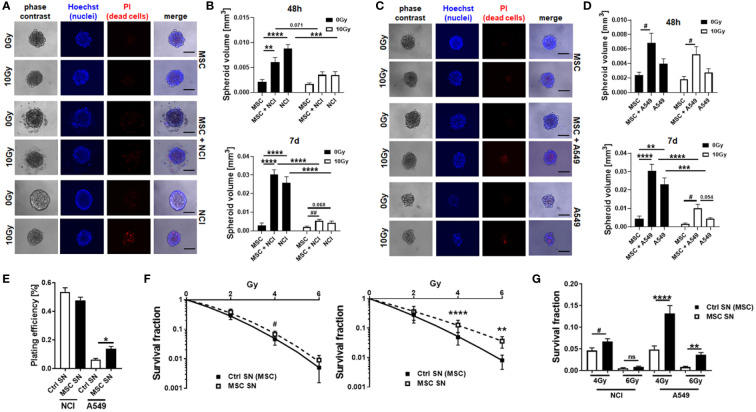
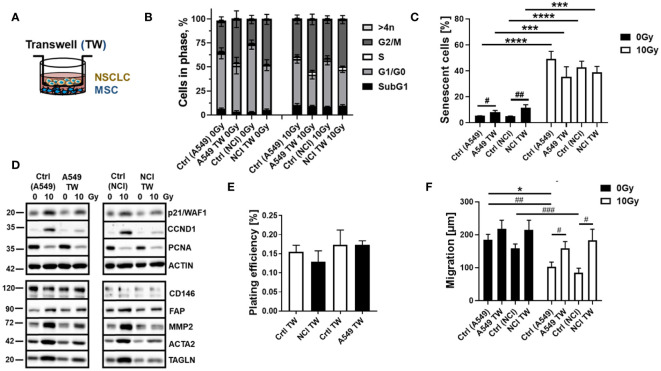
Methods: We investigated how MSCs were affected by NSCLC cells in combination with cancer (radiation) therapy in indirect co-cultures using tumor-conditioned medium and Transwells or direct three-dimensional NSCLC-MSC spheroid co-cultures in order to unravel the resistance-mediating action of tumor-associated MSCs.

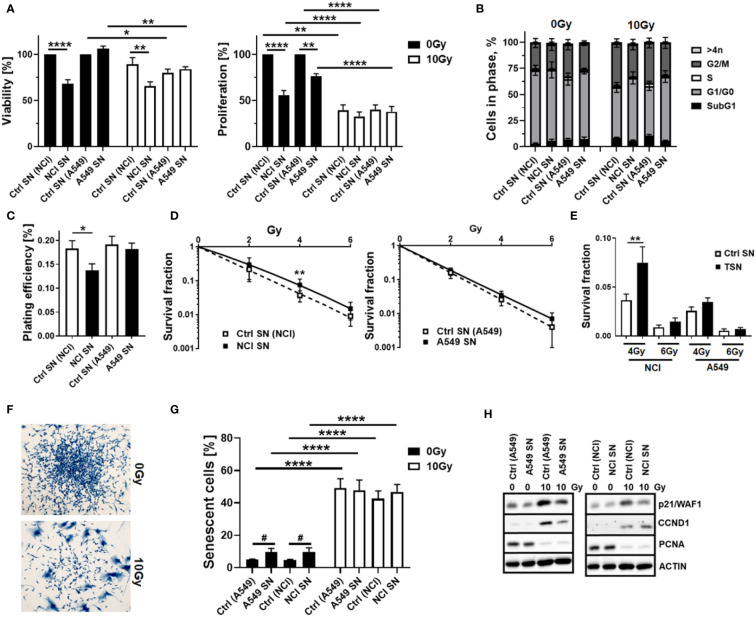
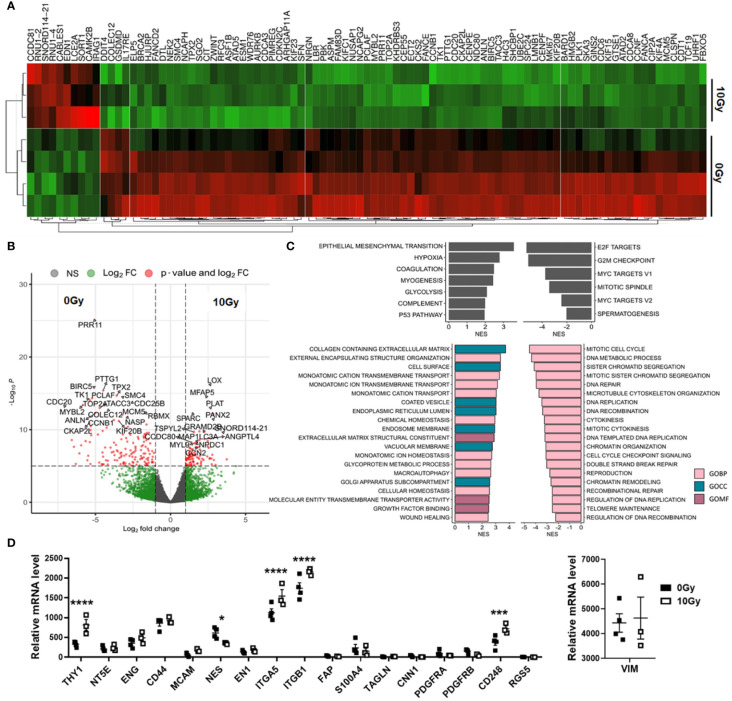
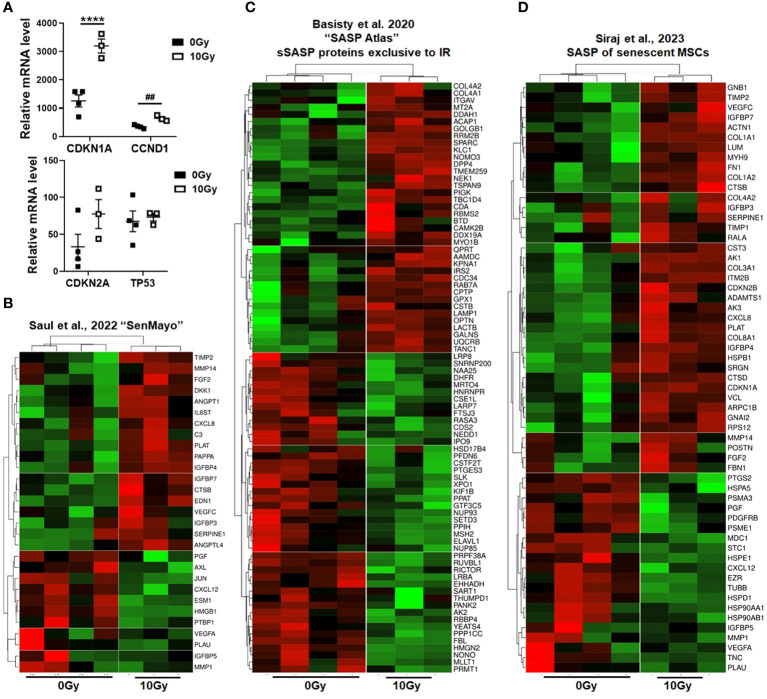
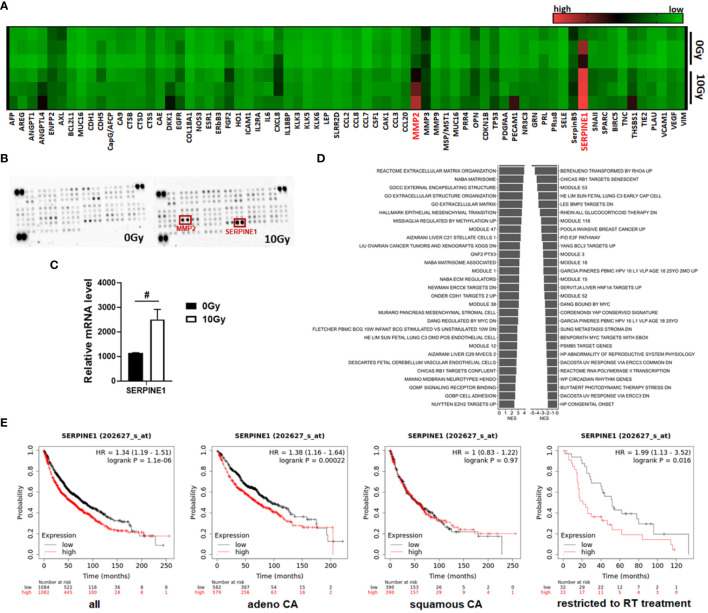
Results: Although no obvious phenotypic and functional alterations in MSCs following NSCLC co-culture could be observed, MSC senescence was induced following co-applied radiotherapy (RT). Global gene expression profiling, in combination with gene set enrichment analysis upon treatment, was used to confirm the senescent phenotype of irradiated MSC and to reveal relevant senescence-associated secretory phenotype (SASP) factors that could meditate NSCLC RT resistance. We identified senescent tumor-associated MSC-derived serine proteinase inhibitor (serpin) E1/PAI1 as potential SASP factor mediating NSCLC progression and RT resistance.

Discussion: Specified intra-tumor-stroma interactions and cell type-specific pro-tumorigenic functions could not only improve lung cancer classification but could even be used for a more precise profiling of individual patients, finally paving an additional way for the discovery of potential drug targets for NSCLC patients.

Keywords: NSCLC; SASP; adventitia; lung cancer; mesenchymal stem cells; radiotherapy; resistance; senescence.


Conflict of interest statement

The authors declare that the research was conducted in the absence of any commercial or financial relationships that could be construed as a potential conflict of interest.

Figures

Figure 1
Figure 1
(TA-) MSCs mediate RT resistance in directly co‐cultured MSCs–NSCLC spheroids. NCI-H460 (A, B) and A549 (C, D) lung cancer were cultured alone or co-cultured with VW-MSCs in hanging drops for 24 h. After the formation of spheroids, cells were plated in GFR-Matrigel mixed with normal growth medium (1:2, v/v) and left untreated or irradiated at 10 Gy. Spheroids generated from VW-MSCs only were additionally included. Cell death was analyzed afterwards (48-h time point) by fluorescence microscopy using propidium iodide (A, C). Hoechst 83342 was used for nuclei staining. Representative phase-contrast images and simultaneously recorded fluorescent photographs from three individual experiments are shown. The scale bar represents 25 µm. Spheroids’ growth was measured after an additional 48 h and 7 days of cultivation, and the respective volumes were calculated (B, D). The graphs depict the measurements from five to eight independent experiments where at least 10 spheroids per condition were measured. **p < 0.01; ***p < 0.005; ****p < 0.001 by two-way ANOVA followed by post hoc Tukey’s comparison test and additionally by unpaired (two-tailed) t-tests depicted as # p ≤ 0.05; ## p ≤ 0.01. (E–G) Lung cancer cells were plated at low density (CFU assay), irradiated with the indicated doses (0, 2, 4, and 6 Gy), and further incubated for additional 10 days in conditioned media (SN) derived from cultured MSCs or control (Ctrl) SN. Quantification of grown (plating efficiency) and surviving colonies was performed after Coomassie Brilliant Blue staining. The graphs depict data from three to five independent experiments, each measured in P-value by one-way ANOVA, followed by post hoc Tukey’s multiple-comparison test: *P ≤ 0.05, **P ≤ 0.01, ****P ≤ 0.001 and additionally by unpaired (two-tailed) t-tests depicted as # p ≤ 0.05. ns, non significant.
Figure 2
Figure 2
Tumor-secreted factors derived from NCI-H460 NSCLC cells reduced MSC viabilities and proliferation levels and fostered a more radioresistant MSC phenotype, while A549 NSCLC cell-derived factors did not affect MSC’s cellular features. Cellular features of cultured MSCs were analyzed after treatment with tumor-conditioned media (SN; derived from cultured NCI-H460 and A549 NSCLC cells) in combination with or without radiation treatment (RT; 10 Gy) after 96 h. (A) The viabilities of MSCs were analyzed using the WST-1 reagent, and the proliferation levels of MSCs were further determined using crystal violet staining. Estimated values were related to respective control SN (Ctrl SN) treatments (0 Gy; set as 100%). Data represent mean values ± SEM from four to five independent experiments measured in quadruplets each. P-values are indicated as follows: *p ≤ 0.05, **p ≤ 0.01, ****p ≤ 0.001 by two-way ANOVA with Tukey’s multiple-comparison test. (B) Cell cycle phases and apoptotic cells (subG1) were analyzed by flow cytometry. The graphs consist of data from five to eight individual experiments (with SEM). The statistically significant differences within G1/G0 [Ctrl (NCI) 0 Gy vs. Ctrl (NCI) 10 Gy: p ≤ 0.005), Ctrl (A549) 10 Gy vs. A549 SN 10 Gy: p ≤ 0.05], and G2/M phases [Ctrl (NCI) 0 Gy vs. Ctrl (NCI) 10 Gy: p ≤ 0.05] as estimated by two-way ANOVA with Tukey’s multiple-comparison test were not depicted. (C) The colony formation capacity was further evaluated by plating MSCs at low densities (CFU assay) in the presence or absence of NSCLC-derived factors, and (D, E) the clonogenic survival of MSCs was evaluated additionally following RT with the indicated doses (10 days post-treatment). The graphs depict data from three to five independent experiments, each measured in triplicate. P-values are indicated as *P ≤ 0.05 and **p ≤ 0.01 by one-way ANOVA, followed by post hoc Tukey’s multiple-comparison test. (F) Morphological alterations of MSCs in response to RT treatment were visualized following crystal violet staining. Representative photographs from control (Ctrl; 0 Gy) and RT (10 Gy)-treated MSCs are exemplarily shown. Magnification: ×10. (G) RT-induced senescence formation was analyzed by C12FDG staining prior to flow cytometry analyses 96 h post-treatment. The graphs depict data from four to eight independent experiments. P-value by two-way ANOVA, followed by post hoc Tukey’s multiple-comparison test: ****p ≤ 0.001 and additionally by unpaired (two-tailed) t-tests depicted as # p ≤ 0.05. (H) The expression levels of the indicated proteins were analyzed in whole protein lysates of cultured MSCs with or without radiation treatment (96 h after RT with 10 Gy) in the presence of the control or NSCLC-conditioned media (SN) using Western blot analysis. Representative blots from at least four independent experiments are shown.
Figure 3
Figure 3
RT-induced senescence of MSCs was not affected by the combined treatment with NSCLC-derived factors in a more direct co-culture approach using Transwell co-cultures. MSCs were cultured alone (“empty” Transwell) or together with NCI-H460 and A549 (in indirect co-culture) for 24 h prior to RT with 0 or 10 Gy and analyzed after additional 96 h (A). Cycle phases and apoptotic cells (subG1) of MSCs were analyzed by flow cytometry (B). The graphs consist of data from four to eight individual experiments (with SEM). The statistically significant differences within G1/G0 [Ctrl (NCI) 0 Gy vs. NCI TW 0 Gy: p ≤ 0.01; Ctrl (NCI) 0 Gy vs. Ctrl (NCI) 10 Gy: p ≤ 0.001], and G2/M phases [Ctrl (NCI) 0 Gy vs. NCI TW 0 Gy: p ≤ 0.01; Ctrl (NCI) 0 Gy vs. Ctrl (NCI) 10 Gy: p ≤ 0.05] as estimated by two-way ANOVA with Tukey’s multiple-comparison test were not depicted. (C) The senescence induction of the respective MSC cultures were analyzed by C12FDG treatment prior to flow cytometry analyses 96 h post-treatment. The graphs depict data from four to six independent experiments. P-value by two-way ANOVA, followed by post hoc Tukey’s multiple-comparison test: ***P ≤ 0.005 ****P ≤ 0.001 and additionally by unpaired (two-tailed) t-tests depicted as # p ≤ 0.05; ## p ≤ 0.01. (D) The expression levels of the indicated proteins were analyzed in whole protein lysates of cultured MSCs with or without radiation treatment (96 h after RT with 10 Gy) in the presence co-cultured NSCLC cells using Western blot analysis. Representative blots from at least three independent experiments are shown. (E) The colony formation capacity was further evaluated by plating MSCs at low densities (100–250 cells/well) in plastic culture dishes and subsequent culturing 10 days in the presence or absence of co-cultured NSCLC. Coomassie Brilliant Blue-stained MSC colonies were counted, and the plating efficiency was calculated. The graphs depict data from three to four independent experiments, each measured in duplicates. (F) MSC migrations were investigated 96 h after irradiation with 10 Gy following the introduction of a thin wound in confluent monolayers by scratching with a pipette tip. Wound closure was determined following NSCLC co-culture by measuring the migration distance (wound closure) after 12 h. Wound closure was related to the distance of the introduced wound, and the migrated distance was calculated. Data are shown as means ± SEM of three to five independent experiments. P-value by two-way ANOVA, followed by post hoc Tukey’s multiple-comparison test: *P ≤ 0.05 and additionally by unpaired (two-tailed) t-tests depicted as # p ≤ 0.05, ## p ≤ 0.01, and ### p ≤ 0.005.
Figure 4
Figure 4
Global gene expression analysis revealed differences in MSCs upon RT. Total RNA (whole transcriptome) sequencing was performed using total RNA isolates of cultured MSCs following RT with 0 Gy (Ctrl) and 10 Gy at 96 h post-treatment. (A) Hierarchical clustering heatmap of genes with log-fold change >0.5 and p-value <0.001 (top 100 variant genes) and (B) Volcano plot with all genes (13,636 variables in total) are shown. Significant differences in 1,049 transcripts (fold change >1.5 and adjusted p-value cutoff of 0.001) were highlighted in red. Genes upregulated in Ctrl MSCs are on the left, while genes upregulated in following RT are on the right site. The top 25 genes are named. (C) Significantly enriched Hallmark and significantly enriched C5 ontology gene sets showing normalized enrichment scores (NES) for significantly upregulated and downregulated gene sets during RT are shown. BP, biological process; CC, cellular component; MF, molecular function. (D) Relative mRNA expression levels obtained from the RNAseq profiles of classical MSC signature genes are separately depicted. Biological replicates as indicated: MSC 0 Gy n = 4; MSC 10 Gy n = 3. Statistics: limmas moderated t-test, adjusted by “BH” with *p ≤ 0.05, ***p ≤ 0.005, ****p ≤ 0.001.
Figure 5
Figure 5
Senescent phenotype of RT-treated MSCs. (A) Relative mRNA expression levels as obtained from the RNAseq profiles of the indicated senescence marker genes are depicted. Data are shown as means ± SEM of the indicated biological replicates (MSC 0 Gy n = 4; MSC 10 Gy n = 3). P-value by one-way ANOVA, followed by post hoc Tukey’s multiple-comparison test: ****P ≤ 0.001 and additionally by unpaired (two-tailed) t-tests depicted as ## p ≤ 0.01. (B–D) Gene set enrichment analysis (GSEA) using specific senescence gene sets are shown: (B) the ‘SenMayo’ gene set identifying senescent cells across tissues (34), (C) the ‘SASP Atlas’ comprising soluble proteins and exosomal cargo SASP factors exclusive to ionizing radiation (35), and (D) the SASP gene set of senescent MSCs (36). Displayed are heatmaps of significantly enriched genes.
Figure 6
Figure 6
MSCs that have become senescent during RT express and secrete SERPINE1, a potential RT mediator. (A, B) A membrane-based sandwich immunoassay (Proteome Profiler Human XL Oncology Array, R&D Systems) was used for the parallel determination of the relative levels of selected human cancer-related proteins and cytokines in cell culture supernatants of control (0 Gy) and RT-treated (10 Gy) MSCs. (A) Profiles of detected signals were quantified by densitometry, related to the reference signal, and are presented as heatmap. Biological replicates are indicated: MSC 0 Gy n = 3; MSC 10 Gy n = 3. (B) Representative membranes of the 0 Gy and 10 Gy conditions are exemplarily shown. Select analytes (matrix metalloproteinase 2, MMP2, and serine proteinase inhibitor E1, SERPINE1) being secreted in increased amounts following RT-induced senescence in MSCs are highlighted in red. (C) Relative mRNA expression levels obtained from the RNA-Seq profiles of SERPINE1 (also known as plasminogen activator inhibitor-1, PAI-1) are depicted. Data are shown as means ± SEM (biological replicates: MSC 0 Gy n = 4; MSC 10 Gy n = 3). P-value by unpaired (two-tailed) t-test depicted as # p ≤ 0.05. (D) Significantly enriched gene sets comprising the SERPINE E1 gene and showing normalized enrichment score (NES) for significantly upregulated (right site) and downregulated (left side) gene sets following RT in MSCs are shown. (E) Survival curves concerning SERPINE1 gene expressions were plotted for all NSCLC patients (n = 2,166), adenocarcinoma (adeno CA) patients (n = 1,161), and squamous cell carcinoma (squamous CA) patients (n = 780) as well as for all available patients treated with RT (n = 65). Data was analyzed using Kaplan–Meier plotter for lung cancer (www.kmplot.com). Expressions in cancer tissues above the median are indicated in red line, and expressions below the median are summarized in black line. Number-at-risk values are shown below the main plot, and log rank p-value as well as hazard ratio (HR) with 95% confidence intervals are indicated.
Figure 7
Figure 7
Summarizing scheme. Local (tissue-resident) MSCs could be activated, recruited, and then “educated” by tumor cells and particularly by tumor-secreted (and MSC-affecting) factors. MSCs, in turn, adopt altered cellular features, e.g., a tumor-promoting secretory profile, thus becoming tumor-associated MSCs (TA-MSCs). Phenotypical alterations can further be induced by applied cancer therapeutics (e.g., radiation therapy-induced senescence), finally re-enforcing cancer progression and therapy resistance. Senescent TA-MSCs express and secrete PAI1/SERPINE1, a potential RT mediator.

Similar articles

Cited by

References

    1. Zhao J, Xu L, Sun J, Song M, Wang L, Yuan S, et al. Global trends in incidence, death, burden and risk factors of early-onset cancer from 1990 to 2019. BMJ Oncol. (2023) 2:e000049. doi: 10.1136/bmjonc-2023-000049 - DOI
    1. Sung H, Ferlay J, Siegel RL, Laversanne M, Soerjomataram I, Jemal A, et al. Global cancer statistics 2020: globocan estimates of incidence and mortality worldwide for 36 cancers in 185 countries. CA: Cancer J Clin. (2021) 71:209–49. doi: 10.3322/caac.21660 - DOI - PubMed
    1. Howlader N, Noone AM, Krapcho M, Miller D, Brest A, Yu M, et al. (eds) Seer Cancer Statistics Review, 1975-2018. (2021), Based on November 2020 Seer Data Submission, Posted to the Seer Web Site.
    1. Ettinger DS, Wood DE, Aisner DL, Akerley W, Bauman JR, Bharat A, et al. Non–small cell lung cancer, version 3.2022, nccn clinical practice guidelines in oncology. J Natl Compr Cancer Network. (2022) 20:497–530. doi: 10.6004/jnccn.2022.0025 - DOI - PubMed
    1. Herbst RS, Heymach JV, Lippman SM. Lung cancer. New Engl J Of Med. (2008) 359:1367–80. doi: 10.1056/NEJMra0802714 - DOI - PMC - PubMed