. 2024 Sep 9;52(16):9481-9500.
doi: 10.1093/nar/gkae615.

Adenovirus small E1A directs activation of Alu transcription at YAP/TEAD- and AP-1-bound enhancers through interactions with the EP400 chromatin remodeler

Affiliations

Adenovirus small E1A directs activation of Alu transcription at YAP/TEAD- and AP-1-bound enhancers through interactions with the EP400 chromatin remodeler

Simona Cantarella et al. Nucleic Acids Res. .

Abstract

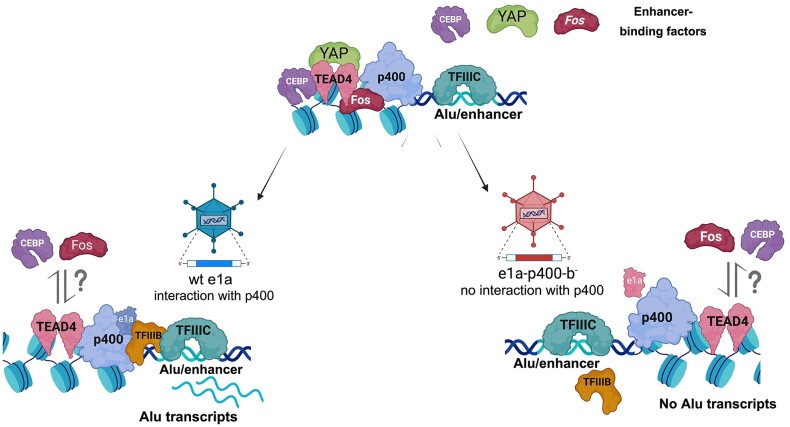
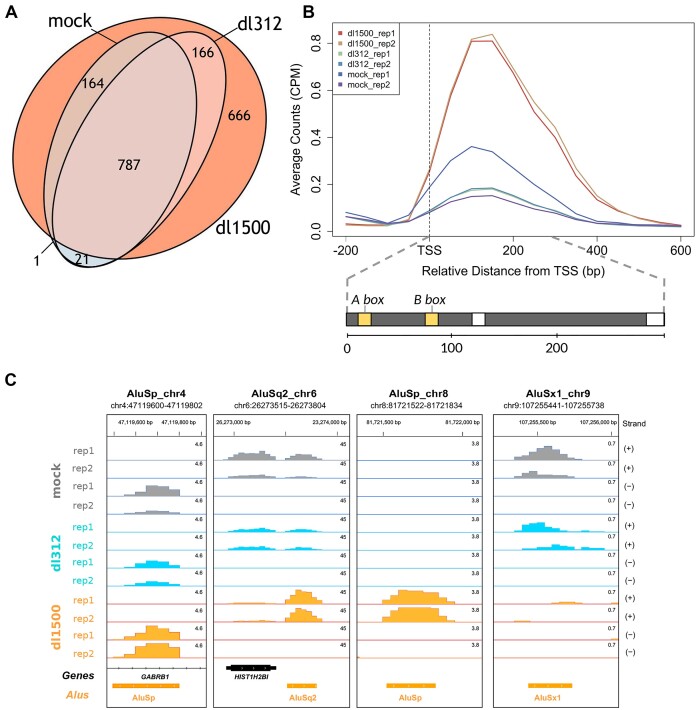
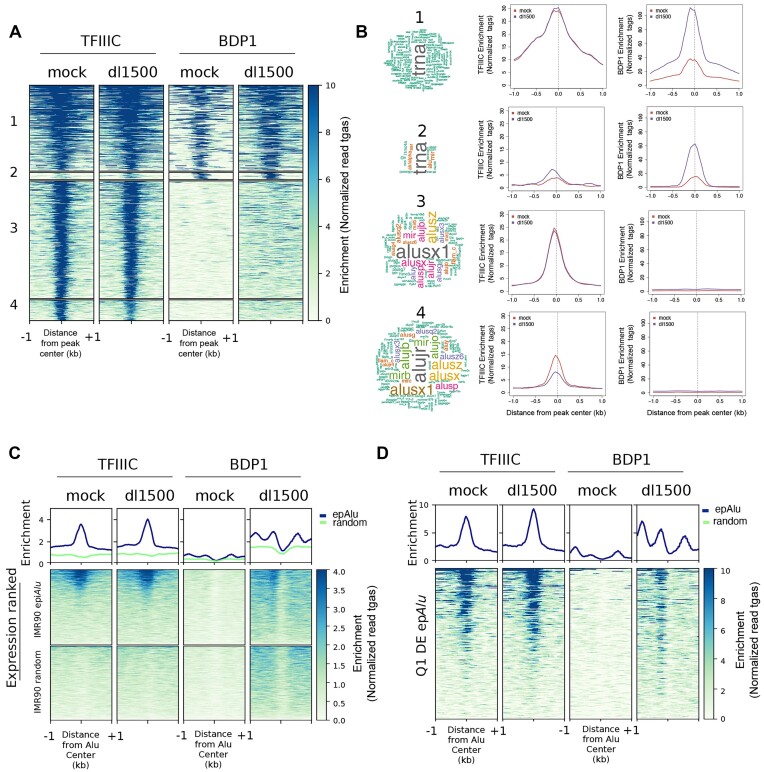
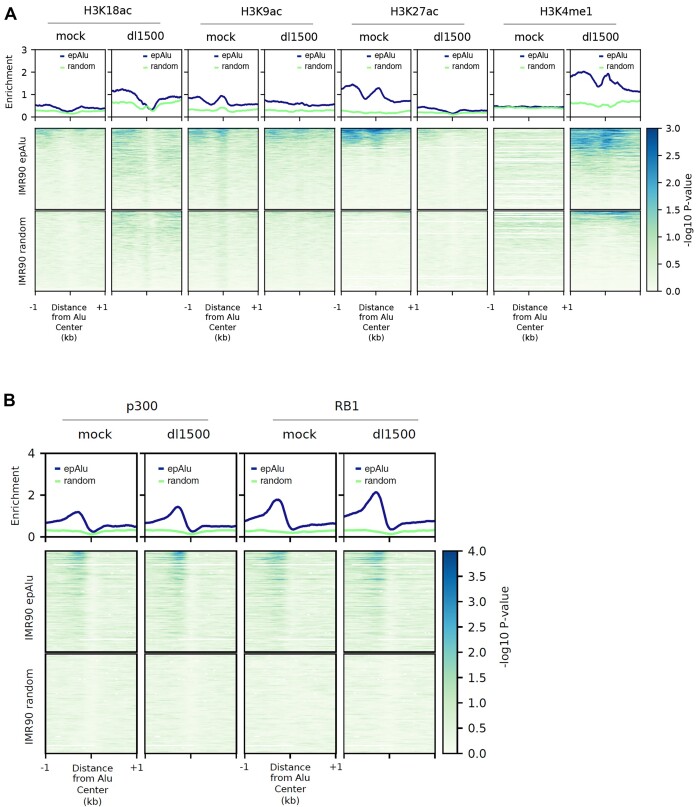
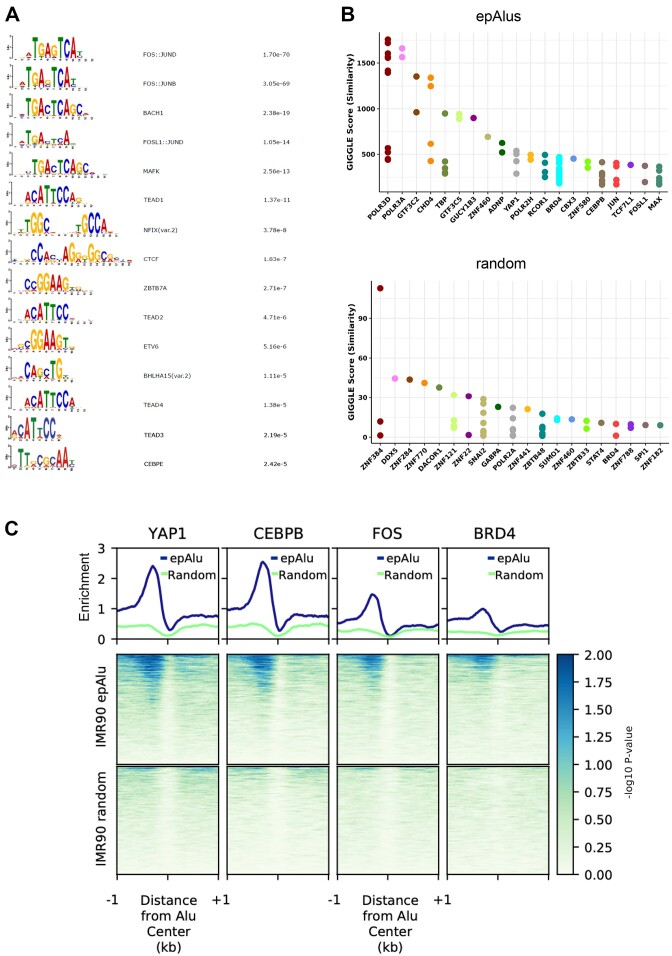
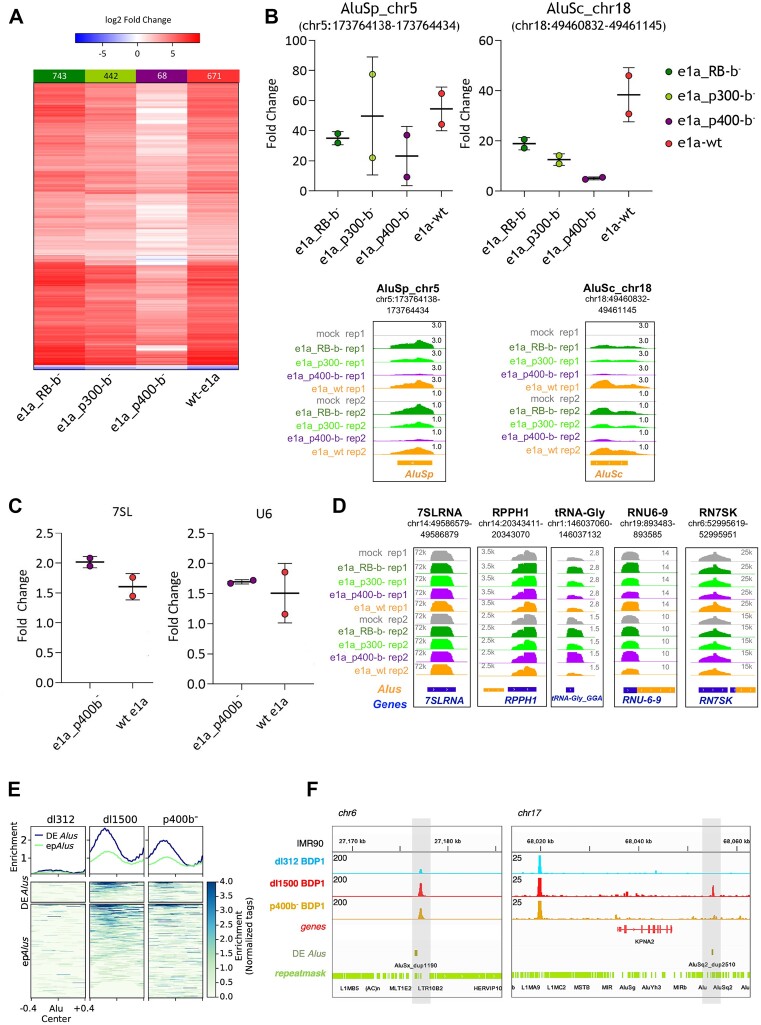
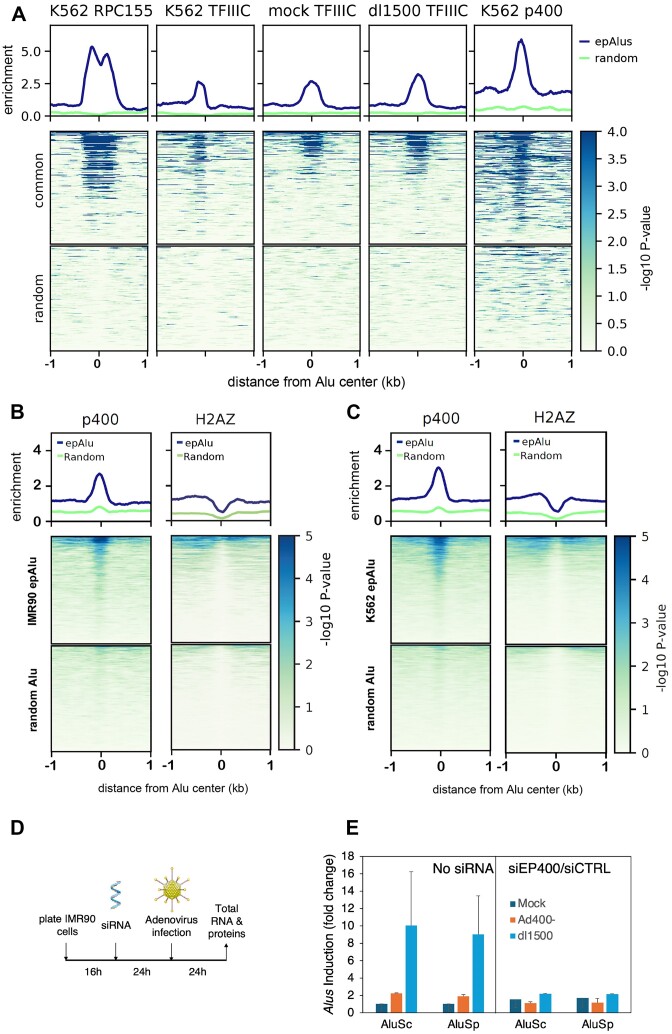
Alu retrotransposons, which form the largest family of mobile DNA elements in the human genome, have recently come to attention as a potential source of regulatory novelties, most notably by participating in enhancer function. Even though Alu transcription by RNA polymerase III is subjected to tight epigenetic silencing, their expression has long been known to increase in response to various types of stress, including viral infection. Here we show that, in primary human fibroblasts, adenovirus small e1a triggered derepression of hundreds of individual Alus by promoting TFIIIB recruitment by Alu-bound TFIIIC. Epigenome profiling revealed an e1a-induced decrease of H3K27 acetylation and increase of H3K4 monomethylation at derepressed Alus, making them resemble poised enhancers. The enhancer nature of e1a-targeted Alus was confirmed by the enrichment, in their upstream regions, of the EP300/CBP acetyltransferase, EP400 chromatin remodeler and YAP1 and FOS transcription factors. The physical interaction of e1a with EP400 was critical for Alu derepression, which was abrogated upon EP400 ablation. Our data suggest that e1a targets a subset of enhancer Alus whose transcriptional activation, which requires EP400 and is mediated by the e1a-EP400 interaction, may participate in the manipulation of enhancer activity by adenoviruses.


Figures

Graphical Abstract
Graphical Abstract
Figure 1.
Figure 1.
Upregulation of Alu expression by e1a in IMR90 cells. (A) Venn-diagram showing the number of expressed Alu elements in dl1500-, dl312- and mock-infected cells. The whole experiment was performed in duplicate. Expressed Alus included elements whose expression was detected by the pipeline in at least one replicate. (B) Average Alu expression profiles in the presence/absence of e1a, generated from normalized read counts (Counts Per Million, CPM) of the 1805 expression-positive Alus. Shown in the lower part of the panel is the structure of a typical full-length Alu element. The approximate positions of the A and B box internal control regions (yellow bars) are indicated above, those of internal and terminal poly(dA) motifs are indicated by white bars. The approximate position and extension of Alu internal sequence elements are indicated below (bp, base pairs). The upper graph reports the average read count for both replicates of each sample (dl1500, dl312 and mock), labelled by different colours as indicated. The vertical dashed line marks the position of the Alu transcription start site (TSS). (C) Base resolution expression profiles, shown as Integrated Genome Browser views (119), of 4 Alus representative of different types of response to e1a. For the Alu in the first view on the left (AluSp_chr4), no substantial expression changes were observed under the different conditions. The Alu in the second view from the left (AluSq2_chr6) is detected as expressed in dl312- and mock-infected cells and its expression is strongly increased by e1a. The expression of the Alu in the third view from the left (AluSp_chr8) is only detected in dl1500-infected cells. The rightmost view (AluSx1_chr9) illustrates one of the very few examples of e1a-dependent downregulation. Orange boxes represent the orientation of repetitive elements as evidenced by the RepeatMasker track. The chromosomal coordinates of each annotated Alu are shown above each view. Bigwig RNA-seq data are normalized as Counts Per Million. The profiles of both replicates on (+) and (–) strands are shown for each sample (mock-, dl312- and dl1500-infected cells).
Figure 2.
Figure 2.
Genome-wide location analysis of TFIIIC and TFIIIB in the presence/absence of e1a. (A) Heatmap of TFIIIC (GTF3C2) and Bdp1 spanning ±1 kb across all TFIIIC-bound sites in mock- and dl1500-infected cells. Clusters 1 to 4 were created by combinatorial clustering of the two factors across all regions bound. Color bar scale with increasing shades of color stands for increasing enrichment (normalized read tags). (B) Shown on the left is the word cloud analysis of repetitive elements associated with regions occupied by TFIIIC and Bdp1 in the four clusters. Font size reflects enrichment for the indicated term. Reported on the right are the results of sitepro analysis (120) of TFIIIC and Bdp1 enrichment (normalized read tags) for each cluster reported in panel A. Enrichment is shown spanning 2 kb from the center of the peaks. (C) Shown in the upper part of the panel are the average ChIP-seq enrichment profiles (normalized read tags) of the TFIIIC 110 kDa subunit (left) or the Bdp1 component of TFIIIB (right) in either mock-infected or dl1500-infected IMR90 cells across the 1805 epAlus and across random Alus. Reported below the plots are heatmaps of TFIIIC and Bdp1 enrichment at the same Alus, sorted according to their expression level in dl1500-infected cells (top, high expression; bottom, low expression). (D) Enrichment profiles (normalized read tags) of TFIIIC and Bdp1, in either mock-infected or dl1500-infected IMR90 cells, at differentially expressed Alus whose expression levels in the presence of e1a falls in the first quartile (Q1 DE epAlu), sorted according to their expression level in dl1500-infected cells (top, high expression; bottom, low expression).
Figure 3.
Figure 3.
Histone modification and chromatin regulator enrichment profiles of epAlus in the presence/absence of e1a. (A) Shown in the upper graphs are the average ChIP-seq enrichment (–log10 of the Poisson P-value) profiles of (from left to right) H3K18ac, H3K9ac, H3K27ac and H3K4me1 across the 1805 epAlus in either mock-infected or dl1500-infected IMR90 cells. Reported below the plots are the heatmaps of the same histone modification enrichments, with epAlus and random Alus ranked according to enrichment expressed as –log10 of the Poisson P-value. (B) Shown in the upper part of the panel are the average ChIP-seq enrichment profiles (–log10 of the Poisson P-value) of EP300 (left) and RB1 (right) in either mock-infected or dl1500-infected IMR90 cells across the 1805 epAlus and across random Alus. Reported below the plots are heatmaps of EP300 and RB1 association to the same Alus, sorted according to their expression level in dl1500-infected cells (top, high expression; bottom, low expression).
Figure 4.
Figure 4.
TF binding motifs and ChIP-seq enrichment at epAlus. (A) TF binding motifs enriched in the 200 bp upstream of the TSS of epAlus with (right column) their corresponding P-values adjusted for multiple testing with Bonferroni correction. (B) Cistrome Toolkit (http://dbtoolkit.cistrome.org/) analysis of epAlu and random Alu sets. Giggle score is calculated by using the genome coordinates of the two sets of Alus to retrieve which factors bind those intervals among all curated experiment in the Cistrome database (70). (C) Plotheatmap of ChIP-seq of YAP1, CEBPB, FOS and BRD4 at the 1805 epAlus and at random Alus based on data from (75–79). Ranking is according to enrichment of YAP1 reported as –log10 of the Poisson P-value.
Figure 5.
Figure 5.
Dependence of Alu upregulation on e1a interaction with chromatin regulators. (A) Heatmap showing increased (red) or decreased (blue) expression of Alu elements triggered by wt e1a or e1a mutants defective in interaction with RB (e1a_RB-b), p300 (e1a_p300-b) or p400 (e1a_p400-b), as compared to mock-infected cells. Boxed above each heatmap are the numbers of differentially expressed Alus (log2 fold-change ≥ 0.5 or ≤ –0.5 and an adjusted P-value < 0.05). The experiment was performed in two biological replicates. (B) Expression levels of two individual Alus as measured by RT-qPCR (upper graphs) and RNA-seq (lower views). Fold changes estimated by RT-qPCR are relative to the expression in mock-infected cells, after normalization to U1 snRNA gene expression. Primers were chosen to target the unique sequence of Alu elements within the 3′ trailer region. RT-qPCR data relative to each independent experiment are represented as dots. Indicated by horizontal bars are the means ± standard deviation between the replicates. RNA-seq data (lower subpanels) are presented as genome browser views of the same Alu elements analysed in the upper plots. Orange boxes represent the orientation of repetitive elements as evidenced by the RepeatMasker track. The chromosomal coordinates of each annotated Alu are shown in the upper part of each subpanel. Bigwig tracks are normalized per CPM. (C) Expression changes of 7SL RNA (left graph) and U6 snRNA (right graph) genes induced by either wt e1a or e1a_p400-b mutant, as measured by RT-qPCR. Fold change is relative to mock-infected cells, after normalization to U1 snRNA gene expression. RT-qPCR data from each of two independent experiments are represented as dots. Indicated by horizontal bars are the means ± standard deviation between the replicates. (D) Genome browser views of the expression of RN7SL1, RPPH1, tRNA-His-GTG-1–1 (GtRNAdb), RNU6-9 and RN7SK genes, coding for 7SL RNA, Ribonuclease P RNA component H1, tRNAGly(GGA), U6 snRNA and 7SK RNA, respectively. Expression profiles are based on RNA-seq analysis of IMR90 cells infected as indicated on the left. (E) Heatmap and enrichment profiles (normalized read tags) of Bdp1 ChIP-seq occupancy at differentially expressed Alus (DE epAlus) and epAlus in IMR90 infected with dl312, dl1500 and p400-b viruses. (F) Genome browser views Bdp1 ChIP-seq data of two highly dl1500-induced Alu elements as evidenced by the RepeatMasker track. The chromosomal coordinates of each annotated Alu are shown above each view. Bigwig tracks are normalized for the library size.
Figure 6.
Figure 6.
Enrichment of EP400 and H2A.Z at epAlus and effects of EP400 depletion. (A) ChIP-seq enrichment profiles of Pol III (RPC155 subunit), TFIIIC and EP400 (p400) at the 285 Alu elements that are expression-positive in both IMR90 (this study) and K562 cells (76,78). Plotheatmap of ChIP-seq data. From left to right: Pol III enrichment in K562 cells, TFIIIC enrichment in K562 cells, TFIIIC enrichment in mock-infected and dl1500-infected IMR90 cells and EP400 enrichment in K562 cells. Ranking is according to enrichment of Pol III in K562 cells reported as -log10 of the Poisson P-value. (B) Plotheatmap of ChIP-seq enrichment of EP400 (left) and the H2A.Z histone variant (right) in K562 cells (76,78) across either the 1805 IMR90 epAlus or random Alus. Ranking is according to enrichment of EP400 in K562 cells reported as -log10 of the Poisson P-value. (C) Plotheatmap of ChIP-seq enrichment of EP400 (left) and the H2A.Z histone variant (right) in K562 cells across either the 3764 Alus detected as expressed in K562 cells or random Alus. Ranking is according to enrichment of p400 in K562 cells reported as -log10 of the Poisson P-value. (D) Schematic representation of the protocol of siRNA-mediated EP400 knock down (KD) followed adenoviral infection (time of each incubation is reported). (E) RT-qPCR for measuring expression of two epAlu loci (the same as in Figure 5B) comparing mock-, e1a_p400-b and dl1500-infection in conditions of absence of silencing RNA (non-siRNA) or presence of siRNA against p400 (siEP400) compared to a scramble set of siRNA control (siCTRL). Standard error bars are indicated, as a result of two biological replicates.

References

    1. Goodier J.L. Restricting retrotransposons: a review. Mobile DNA. 2016; 7:16. - PMC - PubMed
    1. Varshney D., Vavrova-Anderson J., Oler A.J., Cairns B.R., White R.J.. Selective repression of SINE transcription by RNA polymerase III. Mobile Genet. Elem. 2015; 5:86–91. - PMC - PubMed
    1. Dieci G., Conti A., Pagano A., Carnevali D.. Identification of RNA polymerase III-transcribed genes in eukaryotic genomes. Biochim. Biophys. Acta. 2013; 1829:296–305. - PubMed
    1. Russanova V.R., Driscoll C.T., Howard B.H.. Adenovirus type 2 preferentially stimulates polymerase III transcription of Alu elements by relieving repression: a potential role for chromatin. Mol. Cell. Biol. 1995; 15:4282–4290. - PMC - PubMed
    1. Conti A., Carnevali D., Bollati V., Fustinoni S., Pellegrini M., Dieci G.. Identification of RNA polymerase III-transcribed alu loci by computational screening of RNA-seq data. Nucleic Acids Res. 2015; 43:817–835. - PMC - PubMed

MeSH terms