. 2024 Aug 14;15(8):e0159924.
doi: 10.1128/mbio.01599-24. Epub 2024 Jul 16.

Bipotential B-neutrophil progenitors are present in human and mouse bone marrow and emerge in the periphery upon stress hematopoiesis

Affiliations

Bipotential B-neutrophil progenitors are present in human and mouse bone marrow and emerge in the periphery upon stress hematopoiesis

Shima Shahbaz et al. mBio. .

Abstract

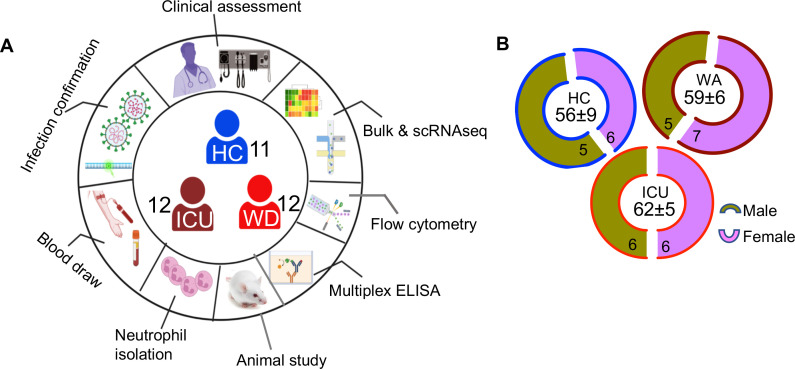
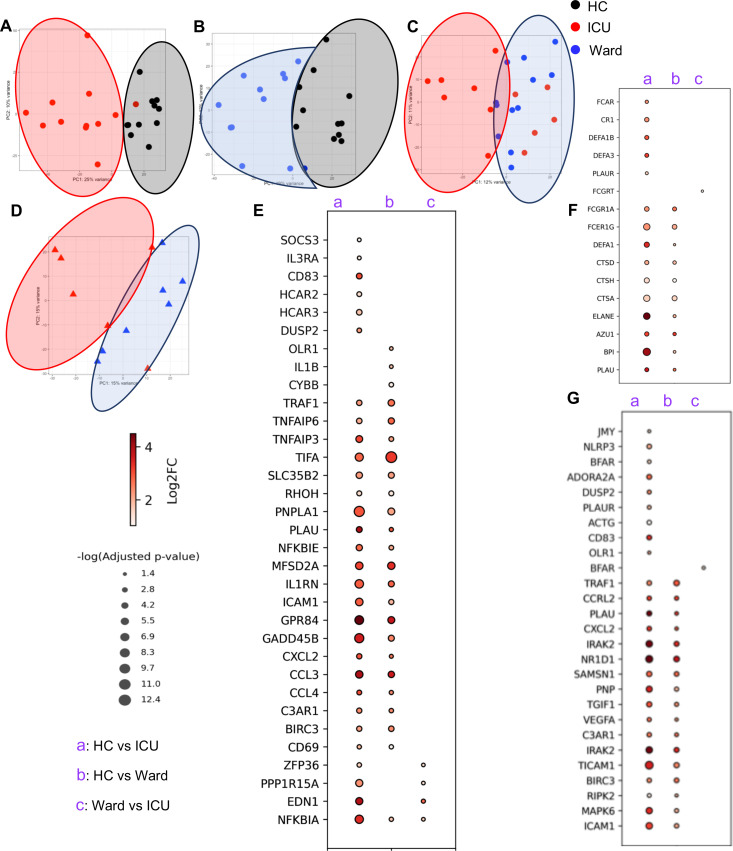
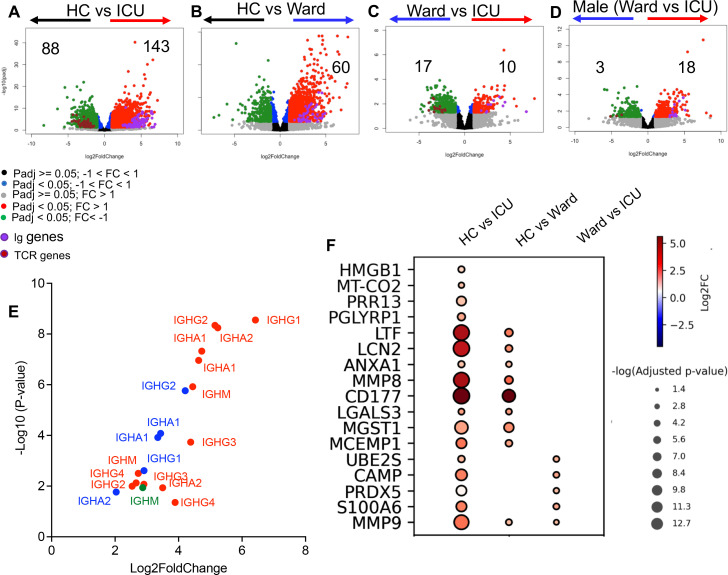
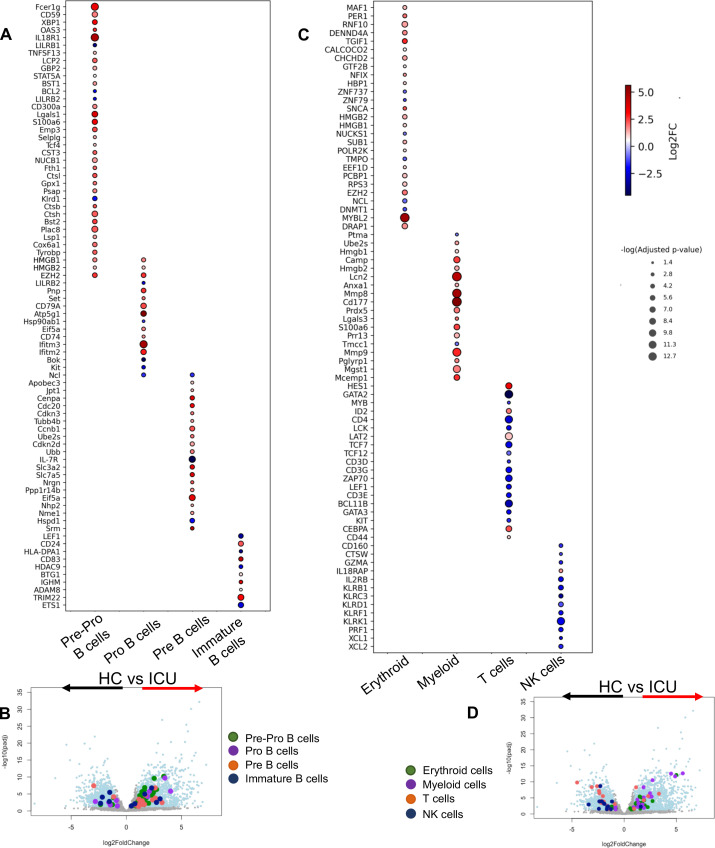
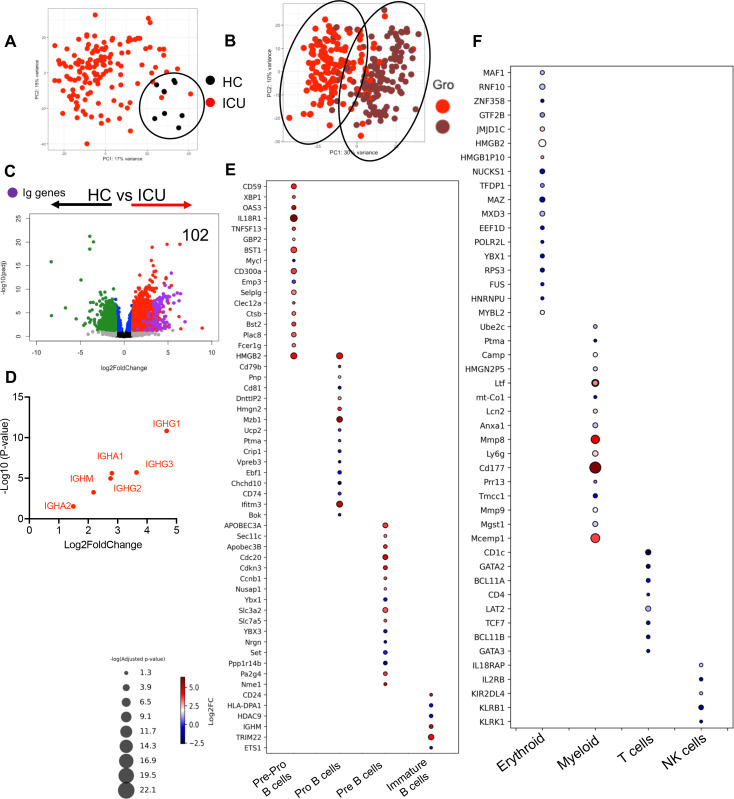
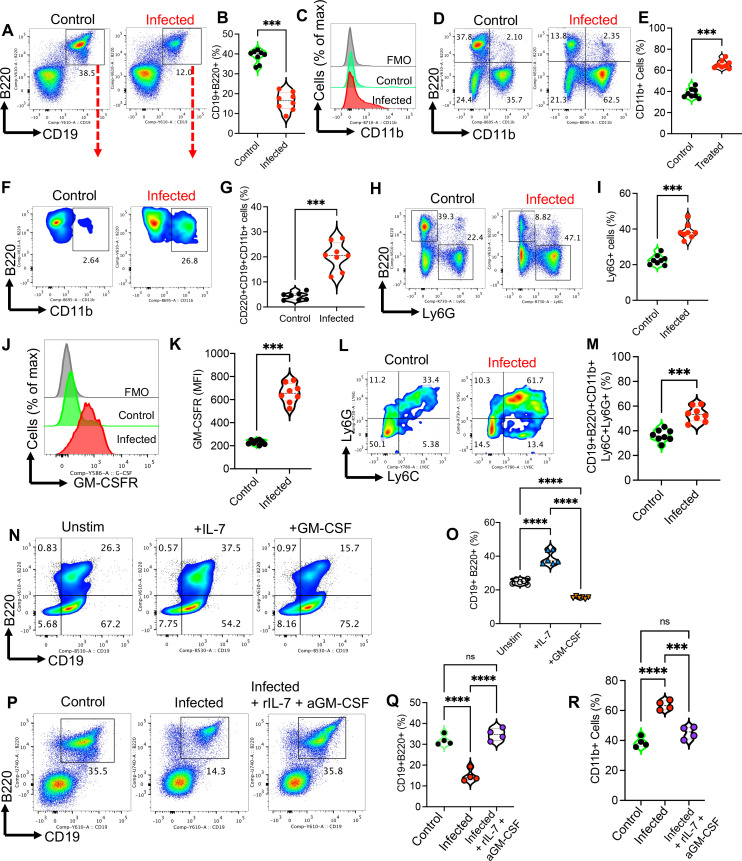
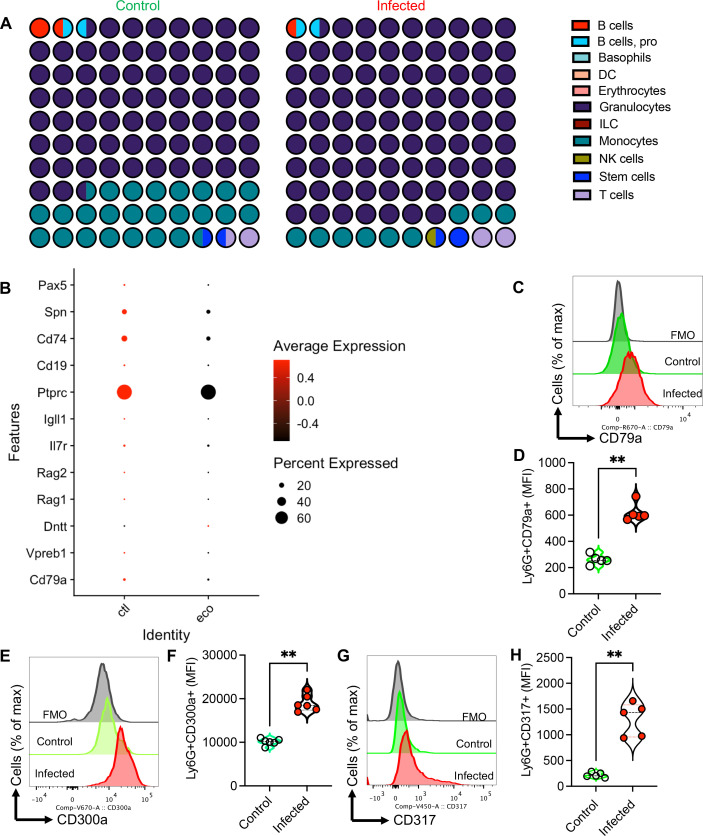
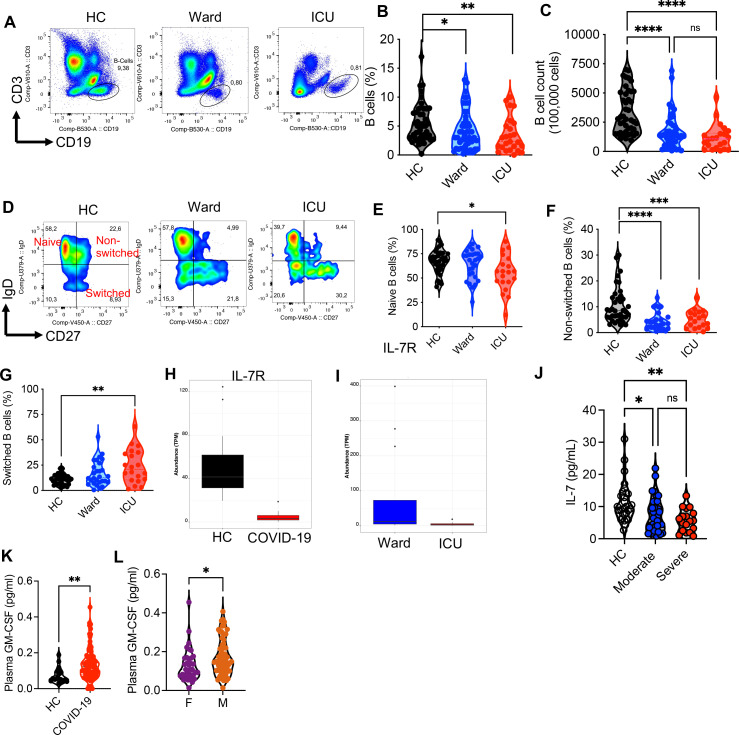
Hematopoiesis is a tightly regulated process that gets skewed toward myelopoiesis. This restrains lymphopoiesis, but the role of lymphocytes in this process is not well defined. To unravel the intricacies of neutrophil responses in COVID-19, we performed bulk RNAseq on neutrophils from healthy controls and COVID-19 patients. Principal component analysis revealed distinguishing neutrophil gene expression alterations in COVID-19 patients. ICU and ward patients displayed substantial transcriptional changes, with ICU patients exhibiting a more pronounced response. Intriguingly, neutrophils from COVID-19 patients, notably ICU patients, exhibited an enrichment of immunoglobulin (Ig) and B cell lineage-associated genes, suggesting potential lineage plasticity. We validated our RNAseq findings in a larger cohort. Moreover, by reanalyzing single-cell RNA sequencing (scRNAseq) data on human bone marrow (BM) granulocytes, we identified the cluster of granulocyte-monocyte progenitors (GMP) enriched with Ig and B cell lineage-associated genes. These cells with lineage plasticity may serve as a resource depending on the host's needs during severe systemic infection. This distinct B cell subset may play a pivotal role in promoting myelopoiesis in response to infection. The scRNAseq analysis of BM neutrophils in infected mice further supported our observations in humans. Finally, our studies using an animal model of acute infection implicate IL-7/GM-CSF in influencing neutrophil and B cell dynamics. Elevated GM-CSF and reduced IL-7 receptor expression in COVID-19 patients imply altered hematopoiesis favoring myeloid cells over B cells. Our findings provide novel insights into the relationship between the B-neutrophil lineages during severe infection, hinting at potential implications for disease pathogenesis.

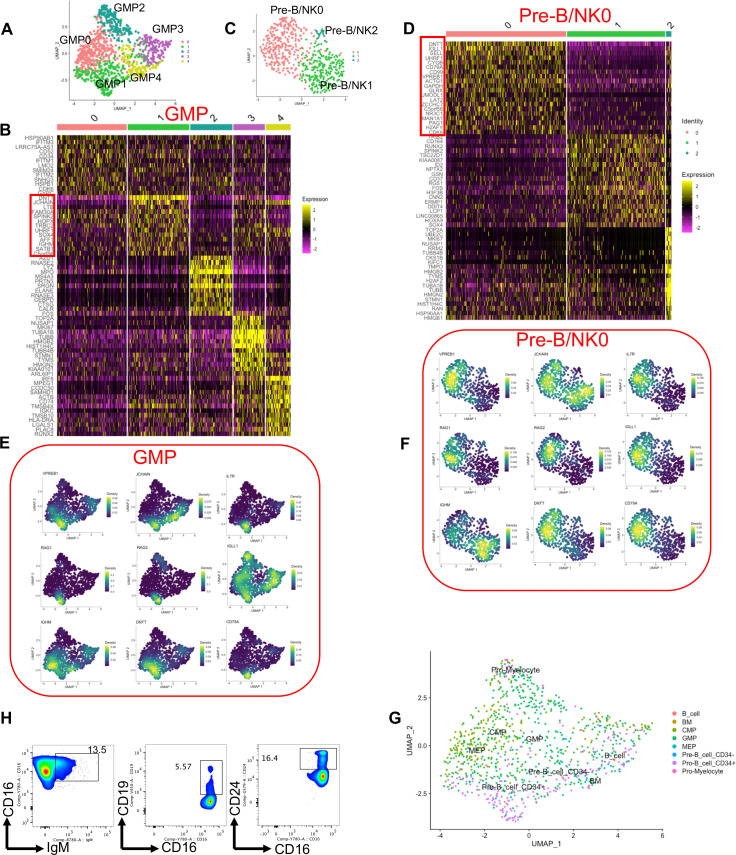
Importance: This study investigates the dynamics of hematopoiesis in COVID-19, focusing on neutrophil responses. Through RNA sequencing of neutrophils from healthy controls and COVID-19 patients, distinct gene expression alterations are identified, particularly in ICU patients. Notably, neutrophils from COVID-19 patients, especially in the ICU, exhibit enrichment of immunoglobulin and B cell lineage-associated genes, suggesting potential lineage plasticity. Validation in a larger patient cohort and single-cell analysis of bone marrow granulocytes support the presence of granulocyte-monocyte progenitors with B cell lineage-associated genes. The findings propose a link between B-neutrophil lineages during severe infection, implicating a potential role for these cells in altered hematopoiesis favoring myeloid cells over B cells. Elevated GM-CSF and reduced IL-7 receptor expression in stress hematopoiesis suggest cytokine involvement in these dynamics, providing novel insights into disease pathogenesis.

Keywords: GM-CSF; IL-7; Pre B cell; Pro B cell; hybrid cells; myeloid plasticity.


Conflict of interest statement

The authors declare no conflict of interest.

Figures

Fig 1
Fig 1
Demographic and the study design. (A) Schematic of the study design. Numbers in the center of the diagram indicate participants in each study cohort (HC = healthy controls with no prior-SARS-CoV-2 exposure/vaccination; WD = acute SARS-CoV-2 infected and ward-admitted; ICU = acute SARS-CoV-2 infected and ICD-admitted. Outer ring indicates different studies/assays performed on patients/samples. (B) Demographic characteristics for the number of males and females in each cohort are displayed in ring charts. Center values in “age” are median ages in years.
Fig 2
Fig 2
Neutrophils from COVID-19 patients are enriched with genes contributing to enhanced phagocytic, chemotactic, and cytotoxic potentials. (A) PCA on the euclidian distances of the genes between neutrophils of HC vs. ICU-admitted, (B) HC vs. ward-admitted, (C) ICU vs. ward-admitted, and (D) ICU-admitted males vs. ward-admitted male COVID-19 patients. Bubble plots showing the differential expression of genes associated with (E) chemotaxis, (F) phagocytosis, and (G) cytotoxic function of neutrophils in our three different cohorts. Dot size represents the −log (padj) >1.3, and the colors represent the fold change of the genes in each comparison.
Fig 3
Fig 3
Neutrophils from COVID-19 patients are enriched with Igs and B cell-associated genes. Volcano plots depicting the number and fold change (FC) of differentially expressed Ig and TCR genes in neutrophils of (A) HCs vs ICU-admitted, (B) HCs vs ward-admitted, (C) ward vs ICU-admitted groups, and (D) male patients in ICU vs ward. Purple dots represent Ig, and brown dots represent TCR genes. (E) Volcano plot showing the number and FC of the genes of different classes of Igs as shown by the type of heavy chains in our three different cohorts. (F) Bubble plot of differentially expressed genes associated with immature neutrophil phenotypes presented in three groups comparison.
Fig 4
Fig 4
Neutrophils from COVID-19 patients possess B cell-associated genes. (A) Bubble plot of differentially expressed genes associated with different stages of B cell development in neutrophils of HC vs ICU patients. (B) Volcano plot of the number and FC of genes associated with different stages of B cell development in neutrophils of HC vs ICU patients. (C) Bubble plot of differentially expressed genes associated with different types of immune cells in neutrophils of HC vs ICU patients. (D) Volcano plot of the number and FC of genes associated with different immune cells in neutrophils of HC vs ICU patients.
Fig 5
Fig 5
Enrichment of B cell-associated genes in the neutrophils of the validating cohort. PCA on the Euclidian distances of the genes between neutrophils of (A) HCs and COVID-19 patients at the time of ICU admission and (B) COVID-19 patients at the time of admission and 7 days after admission to the ICU. (C) Volcano plot depicting the number and FC of differentially expressed Ig genes in neutrophils of HCs vs ICU patients. Purple dots represent Ig genes. (D) Volcano plot showing the number and FC of the genes of different classes of Igs as shown by the type of heavy chains in COVID-19 patients. (E) Bubble plot of differentially expressed genes associated with different stages of B cell development in neutrophils of HC vs ICU patients. (F) Bubble plot of differentially expressed genes associated with different types of immune cells in neutrophils of HC vs ICU patients.
Fig 6
Fig 6
High expression of B cell signature genes in BM granulocytic progenitors. (A) UMAP plot of GMP clusters. (B) The top 13 upregulated genes in every GMP cluster. (C) UMAP plot of Pre-B/NK0 clusters. (D) The top 20 upregulated genes in every B/NK0 cluster. Density plots depicting the level of expression of B-cell lineage-associated genes in (E) GMP and (F) Pre-B/NK0 subpopulations. (G) Annotation of GMP clusters using SingleR. (H) Representative flow cytometry plots of percentages of neutrophil expression IgM, CD19, and CD24 in a human BM sample.
Fig 7
Fig 7
Systemic infection expands myeloid cells within B cell subset in the BM of mice. (A) Representative flow cytometry plots, and (B) cumulative data of percentages of CD19 + B220+ cells in control and infected mice with E. coli (i.p., 106) 48 hr later. (C) Representative histogram showing the mean fluorescence intensity (MFI) of CD11b among CD19 + B220+ cells in a control and an infected mouse. (D) Representative and (E) cumulative data of percentages of CD11b+ cells in the BM of control vs infected mice. (F) Representative flow cytometry plots, and (G) cumulative data of percentages of CD11b+ cells within B220 + CD19+ cells in control and infected mice. (H) Representative flow cytometry plots, and (I) cumulative data of percentages of Ly6G+ cells in control and infected mice. (J) Representative histogram plot and (K) cumulative data of MFI for GM-CSF-receptor (R) in CD19 + B220+ cells in the BM of control and infected mice. (L) Representative plots and (M) cumulative data of percentages of Ly6C + Ly6G + cells among CD19 + B220+ cells obtained from the BM of control and infected mice. (N) Representative flow cytometry plots, and (O) cumulative data of percentages of CD19 + B220+ cells in BM cells obtained from either control and infected mice in the absence of cytokines (unstim) or treated with IL-7 (24 ng/mL) and rGM-CSF (10 ng/mL) for 24 hr in vitro. (P) Representative plots and (Q) cumulative data showing the percentages of B220 + CD19+ cells in the BM of control, infected, and infected plus treated with rIL-7 (5 µg/mouse) and anti-GM-CSF (100 µg/mouse) for 2 consecutive days. (R) Cumulative data of the percentages of CD11b+ cells in the BM of control, infected, and infected plus treated with rIL-7 (5 µg/mouse) and anti-GM-CSF (100 µg/mouse) for 2 consecutive days. Each dot represents data from an animal either control or infected. P values were calculated using two-tailed, Mann-Whitney t test (B, E, G, I, K, M). One-way ANOVA (O, Q, R). ***, P < 0.001, and ****P < 0.0001. Unstimulated (unstim), Fluorescence minus one (FMO), not significant (ns).
Fig 8
Fig 8
A reduction in B cell and B cell-associated genes in the BM of infected mice. (A) Fraction plots based on scRNAseq analysis showing the percentage of genes associated with different immune cells in the bone marrow of a control and an infected mouse with E. coli. (B) Bubble plot of differentially expressed genes associated with B cell lineage genes in Gr-1+ cells from the BM of a control and an infected mouse with E. coli. (C) Representative flow cytometry plots and (D) cumulative data of CD79a expression in Ly6G+ cells in the BM of control and infected mice. (E) Representative flow cytometry plots and (F) cumulative data of CD300a expression in Ly6G+ cells in the BM of control and infected mice. (G) Representative flow cytometry plots and (H) cumulative data of CD317 expression in Ly6G+ cells in the BM of control and infected mice. Each dot represents data from an animal either control or infected. P values were calculated using two-tailed, Mann-Whitney t test (D,F,H). **, P < 0.01. Fluorescence minus one (FMO). Control (ctl) and E. coli-infected (eco).
Fig 9
Fig 9
Lower frequency of B cells in the PBMCs of COVID-19 patients. (A) Representative flow cytometry plots, and cumulative data showing (B) percentages and (C) absolute count of B cells out of 100,000 PBMCs in different groups. (D) Representative flow cytometry plots, and cumulative data showing percentages of (E) naïve, (F) non-switched, and (G) switched B cell subsets in different groups. (H) Abundance of IL-7R transcripts as shown by transcripts per million in neutrophils from HCs vs COVID-19 patients, and (I) in neutrophils from ward-admitted vs ICU-admitted COVID-19 patients. (J) IL-7 levels in the plasma of HC vs COVID-19 patients either admitted to ward or ICU. (K) GM-CSF levels in the plasma of HC vs COVID-19 patients, and (L) in female (F) vs male (M) COVID-19 ICU-admitted patients. Each dot represents data from a human study subject. P values were calculated using two-tailed, Mann-Whitney t test (H,I, K,L). One-way ANOVA (B,C,E,F,G,J). *, P < 0.05, **P < 0.01, ***, P < 0.001, and ****, and P < 0.0001. Health control (HC), COVID-19 patients admitted to hospital ward (ward/moderate) or intensive care unit (ICU/severe). Female (F) and male (M).

Similar articles

Cited by

References

    1. Boettcher S, Manz MG. 2017. Regulation of inflammation- and infection-driven hematopoiesis. Trends Immunol 38:345–357. doi:10.1016/j.it.2017.01.004 - DOI - PubMed
    1. Kondo M, Wagers AJ, Manz MG, Prohaska SS, Scherer DC, Beilhack GF, Shizuru JA, Weissman IL. 2003. Biology of hematopoietic stem cells and progenitors: implications for clinical application. Annu Rev Immunol 21:759–806. doi:10.1146/annurev.immunol.21.120601.141007 - DOI - PubMed
    1. Takizawa H, Boettcher S, Manz MG. 2012. Demand-adapted regulation of early hematopoiesis in infection and inflammation. Blood 119:2991–3002. doi:10.1182/blood-2011-12-380113 - DOI - PubMed
    1. Doulatov S, Notta F, Laurenti E, Dick JE. 2012. Hematopoiesis: a human perspective. Cell Stem Cell 10:120–136. doi:10.1016/j.stem.2012.01.006 - DOI - PubMed
    1. Lucas D, Scheiermann C, Chow A, Kunisaki Y, Bruns I, Barrick C, Tessarollo L, Frenette PS. 2013. Chemotherapy-induced bone marrow nerve injury impairs hematopoietic regeneration. Nat Med 19:695–703. doi:10.1038/nm.3155 - DOI - PMC - PubMed

LinkOut - more resources