. 2024 Sep 1;39(9):2053-2066.
doi: 10.1093/humrep/deae154.

Granulosa cell metabolism at ovulation correlates with oocyte competence and is disrupted by obesity and aging

Affiliations

Granulosa cell metabolism at ovulation correlates with oocyte competence and is disrupted by obesity and aging

Atsushi Morimoto et al. Hum Reprod. .

Abstract

Study question: Is oocyte developmental competence associated with changes in granulosa cell (GC) metabolism?

Summary answer: GC metabolism is regulated by the LH surge, altered by obesity and reproductive aging, and, in women, specific metabolic profiles are associated with failed fertilization versus increased blastocyst development.

What is known already: The cellular environment in which an oocyte matures is critical to its future developmental competence. Metabolism is emerging as a potentially important factor; however, relative energy production profiles between GCs and cumulus cells and their use of differential substrates under normal in vivo ovulatory conditions are not well understood.

Study design, size, duration: This study identified metabolic and substrate utilization profiles within ovarian cells in response to the LH surge, using mouse models and GCs of women undergoing gonadotropin-induced oocyte aspiration followed by IVF/ICSI.

Participants/materials, setting, methods: To comprehensively assess follicular energy metabolism, we used real-time metabolic analysis (Seahorse XFe96) to map energy metabolism dynamics (mitochondrial respiration, glycolysis, and fatty acid oxidation) in mouse GCs and cumulus-oocyte complexes (COCs) across a detailed time course in the lead up to ovulation. In parallel, the metabolic profile of GCs was measured in a cohort of 85 women undergoing IVF/ICSI (n = 21 with normal ovarian function; n = 64 with ovarian infertility) and correlated with clinical parameters and cycle outcomes.

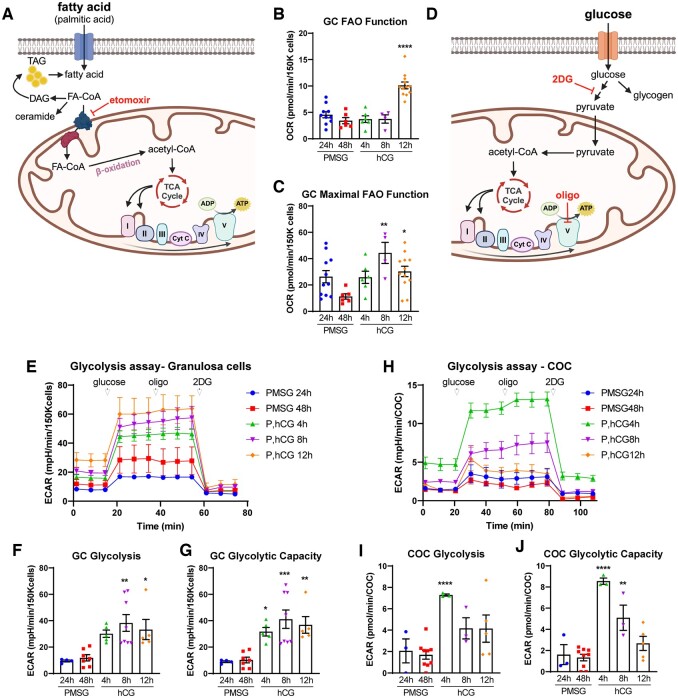
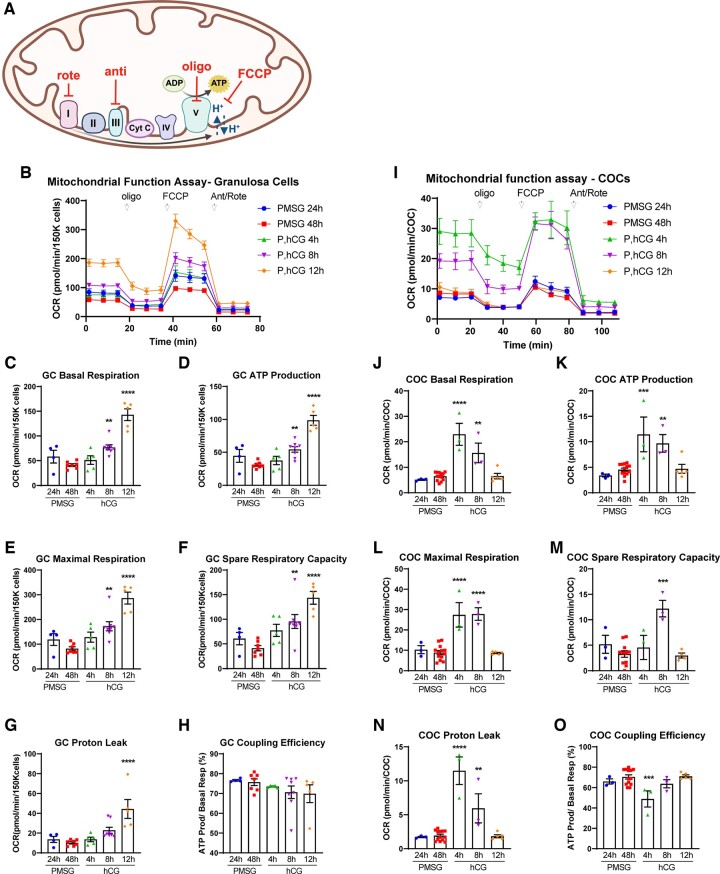
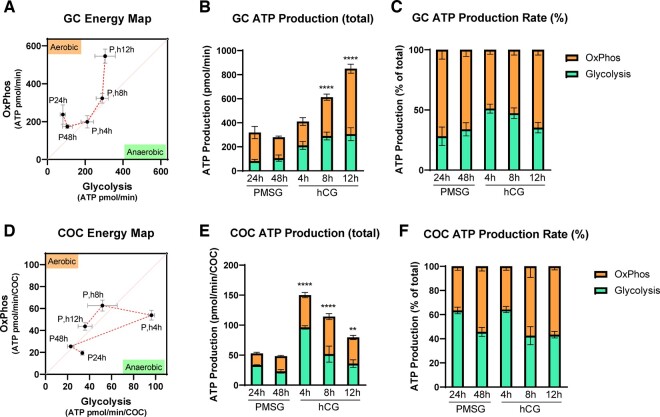
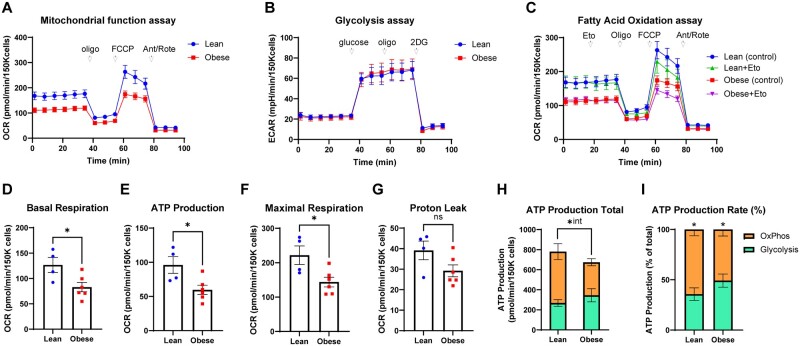
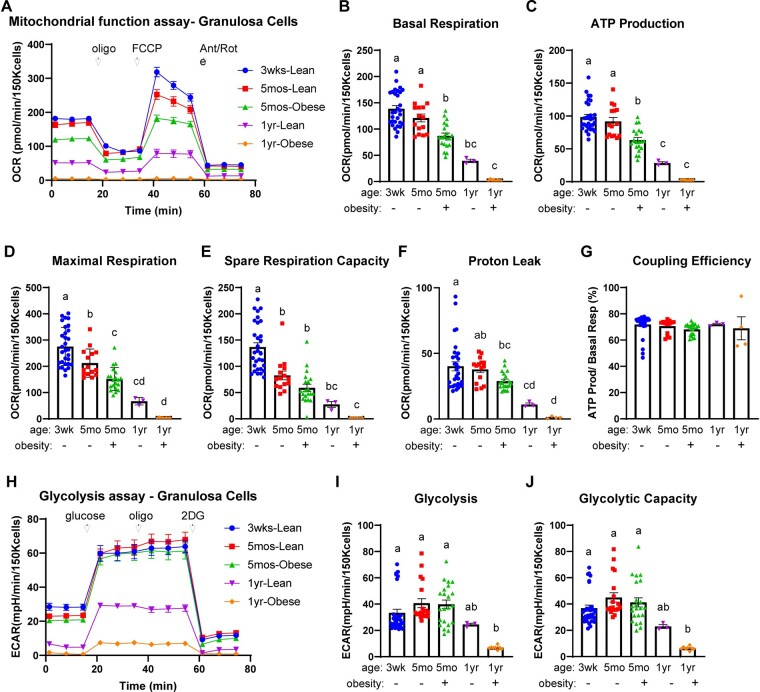
Main results and the role of chance: Our study reveals dynamic changes in GC energy metabolism in response to ovulatory LH, with mitochondrial respiration and glycolysis differentially affected by obesity versus aging, in both mice and women. High respiration in GCs is associated with failed fertilization (P < 0.05) in a subset of women, while glycolytic reserve and mitochondrial ATP production are correlated with on-time development at Day 3 (P < 0.05) and blastocyst formation (P < 0.01) respectively. These data provide new insights into the cellular mechanisms of infertility, by uncovering significant associations between metabolism within the ovarian follicle and oocyte developmental competence.

Limitations, reasons for caution: A larger prospective study is needed before the metabolic markers that were positively and negatively associated with oocyte quality can be used clinically to predict embryo outcomes.

Wider implications of the findings: This study offers new insights into the importance of GC metabolism for subsequent embryonic development and highlights the potential for therapeutic strategies focused on optimizing mitochondrial metabolism to support embryonic development.

Study funding/competing interest(s): National Health and Medical Research Council (Australia). The authors have no competing interests.

Trial registration number: N/A.

Keywords: IVF/ICSI outcome; aging; cumulus–oocyte complex; glycolysis; granulosa cells; metabolism; mitochondria; obesity; ovary; ovulation.


Conflict of interest statement

The authors have no conflicts of interest of relevance to this study.

Figures

Figure 1.
Figure 1.
Fatty acid oxidation and glycolysis in mouse granulosa cells (GCs) and cumulus–oocyte complexes (COCs) in response to ovulatory hormones. (A) Schematic representation of fatty acid oxidation (FAO) and inhibitory action of etomoxir. (B) FAO function and (C) maximal FAO function were quantified in mouse GCs (150K cells/well) collected at 24 and 48 h after PMSG (P), and 4, 8, and 12 h after hCG. N = 4–12 pools of cells from different mice collected at each timepoint. (D) Schematic representation of glycolysis and inhibitory actions of oligomycin (oligo) and 2-deoxyglucose (2DG). (E) Extracellular acidification rate (ECAR) millipH/min (mpH/min) was measured in GCs collected from mice at 24 and 48 h after PMSG, and at 4, 8, and 12 h after hCG to determine glycolytic functions: glycolysis (F) and glycolytic capacity (G). N = 4–8 pools of cells from multiple mice collected at each timepoint. (H–J) ECAR was measured in COCs from the same mice, in parallel to the GCs. N = 3–9 pools of COCs from multiple mice collected at each timepoint. Data shown as mean ± SEM. Statistical analysis by one-way ANOVA with comparison to cells collected at PMSG 48 h. *P < 0.05; **P < 0.01; ***P < 0.001; ****P < 0.0001 compared to PMSG 48 h.
Figure 2.
Figure 2.
Mitochondrial metabolism in mouse granulosa cells (GCs) and cumulus–oocyte complexes (COCs) in response to ovulatory hormones. (A) Schematic representation of mitochondrial metabolism and inhibitory actions of rotenone (rote), antimycin A (anti), oligomycin (oligo), and Carbonyl cyanide 4-(trifluoromethoxy)phenylhydrazone (FCCP). (B) Oxygen consumption rate (OCR) (pmol/min) was measured in GCs (150K cells/well) collected from mice at 24 and 48 h after PMSG (P), and at 4, 8, and 12 h after hCG. Basal respiration (C); ATP production inferred from OCR (D); maximal respiration (E); spare respiratory capacity (F), protein leak (G), and coupling efficiency (H) were determined. N = 4–8 pools of cells from multiple mice collected at each timepoint. (IO) OCR was measured in mouse COCs in parallel to the GCs. N = 3–13 pools of COCs from multiple mice collected at each timepoint. Data shown as mean ± SEM. Statistical analysis by one-way ANOVA with comparison to cells collected at PMSG 48 h. **P < 0.01; ***P < 0.001; ****P < 0.0001 compared to PMSG 48 h.
Figure 3.
Figure 3.
ATP production via oxidative phosphorylation (OxPhos) and glycolysis in mouse granulosa cells (GCs) and cumulus–oocyte complexes (COCs) in response to ovulatory hormones. O2 consumption (OCR) and extracellular acidification (ECAR) in GCs and COCs collected from mice at 24 and 48 h after PMSG (P), and 4, 8, and 12 h after hCG (h) are used to generate energy maps and to infer ATP production rates. Energy maps in GCs (A) and COCs (D). The sequence of the ovulatory time course is indicated by the red dotted lines. Quantification of inferred ATP production in GCs (B) and in COCs (E). Percentage of OxPhos versus glycolysis in ATP production in GCs (C) and in COCs (F). N = 4–8 pools of GCs from multiple mice collected at each timepoint. N = 3–10 pools of COCs collected from the same mice. Data shown as mean ± SEM. Statistical analysis (B, C, E, F) by one-way ANOVA with comparison to cells collected at PMSG 48 h. **P < 0.01; ****P < 0.0001 compared to PMSG 48 h.
Figure 4.
Figure 4.
Metabolic effects of obesity on mouse granulosa cells (GCs). Mitochondrial respiration, glycolysis, fatty acid oxidation (FAO), and ATP production were measured in GCs derived from lean or obese mice at 8-h post-hCG. (A) Mitochondrial function assay; (B) glycolytic function assay; (C) FAO function assay; (D) basal respiration; (E) ATP production inferred from oxygen consumption rate; (F) maximal respiration; (G) proton leak; (H) total ATP production; and (I) ATP production rate from OxPhos versus glycolysis. N = 4 pools of granulosa cells from obese mice and N = 6 pools of cells from obese mice. Data shown as mean ± SEM. Statistical analysis by unpaired two-tailed t-test: ns P > 0.05, *P < 0.05, *int = significant interaction between obesity and OxPhos.
Figure 5.
Figure 5.
The effects of age and obesity on mitochondrial and glycolytic function in mouse granulosa cells (GCs). GCs were collected from mice that were 3 weeks old, 5 months old (lean or obese littermates), or 1 year old (lean or obese littermates) at 12-h post-hCG. Mitochondrial function assay (A); basal respiration (B); ATP production inferred from oxygen consumption rates (OCR) (C); maximal respiration (D); spare respiration capacity (E); proton leak (F); and coupling efficiency (G) in GCs from the indicated type of mice. N = 30 (3 weeks lean); N = 15 (5 months-lean); N = 20 (5 months-obese); N = 3 (1 year-lean); N = 8 (1 year-obese) pools of GCs. Glycolytic function assay (H); glycolysis (I); and glycolytic capacity (J) in GCs from the indicated types of mice. N = 31 (3 weeks lean); N = 19 (5 months-lean); N = 22 (5 months-obese); N = 3 (1 year-lean); N = 8 (1 year-obese) pools of GCs. Data shown as mean ± SEM. Statistical analysis by one-way ANOVA. Different letters indicate a statistically significant difference (P < 0.05) between groups.

References

    1. Aardema H, Vos PL, Lolicato F, Roelen BA, Knijn HM, Vaandrager AB, Helms JB, Gadella BM. Oleic acid prevents detrimental effects of saturated fatty acids on bovine oocyte developmental competence. Biol Reprod 2011;85:62–69. - PubMed
    1. Akison LK, Alvino ER, Dunning KR, Robker RL, Russell DL. Transient invasive migration in mouse cumulus oocyte complexes induced at ovulation by luteinizing hormone. Biol Reprod 2012;86:125. - PubMed
    1. Andreas E, Winstanley YE, Robker RL. Effect of obesity on the ovarian follicular environment and developmental competence of the oocyte. Curr Opin Endocr Metab Res 2021;18:152–158.
    1. Arsov T, Silva DG, O’Bryan MK, Sainsbury A, Lee NJ, Kennedy C, Manji SS, Nelms K, Liu C, Vinuesa CG et al. Fat aussie—a new Alström syndrome mouse showing a critical role for ALMS1 in obesity, diabetes, and spermatogenesis. Mol Endocrinol 2006;20:1610–1622. - PubMed
    1. Babayev E, Duncan FE. Age-associated changes in cumulus cells and follicular fluid: the local oocyte microenvironment as a determinant of gamete quality. Biol Reprod 2022;106:351–365. - PMC - PubMed

Publication types

Substances