. 2024 Sep 2;223(9):e202310030.
doi: 10.1083/jcb.202310030. Epub 2024 Jul 16.

TLNRD1 is a CCM complex component and regulates endothelial barrier integrity

Affiliations

TLNRD1 is a CCM complex component and regulates endothelial barrier integrity

Neil J Ball et al. J Cell Biol. .

Abstract

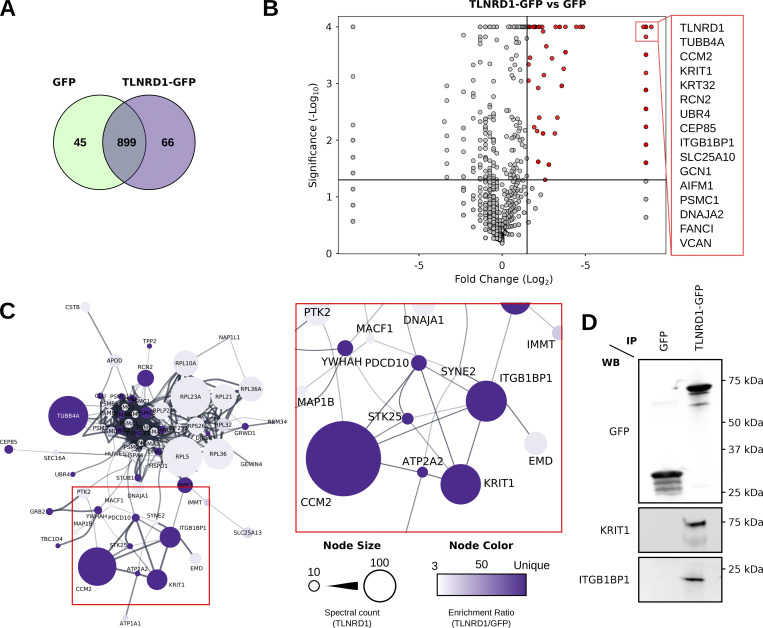
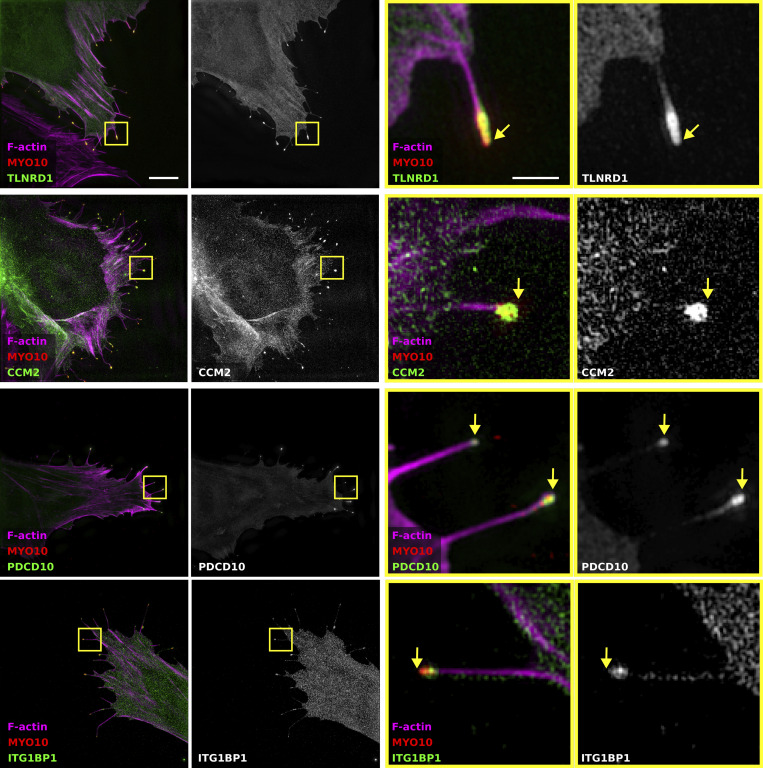
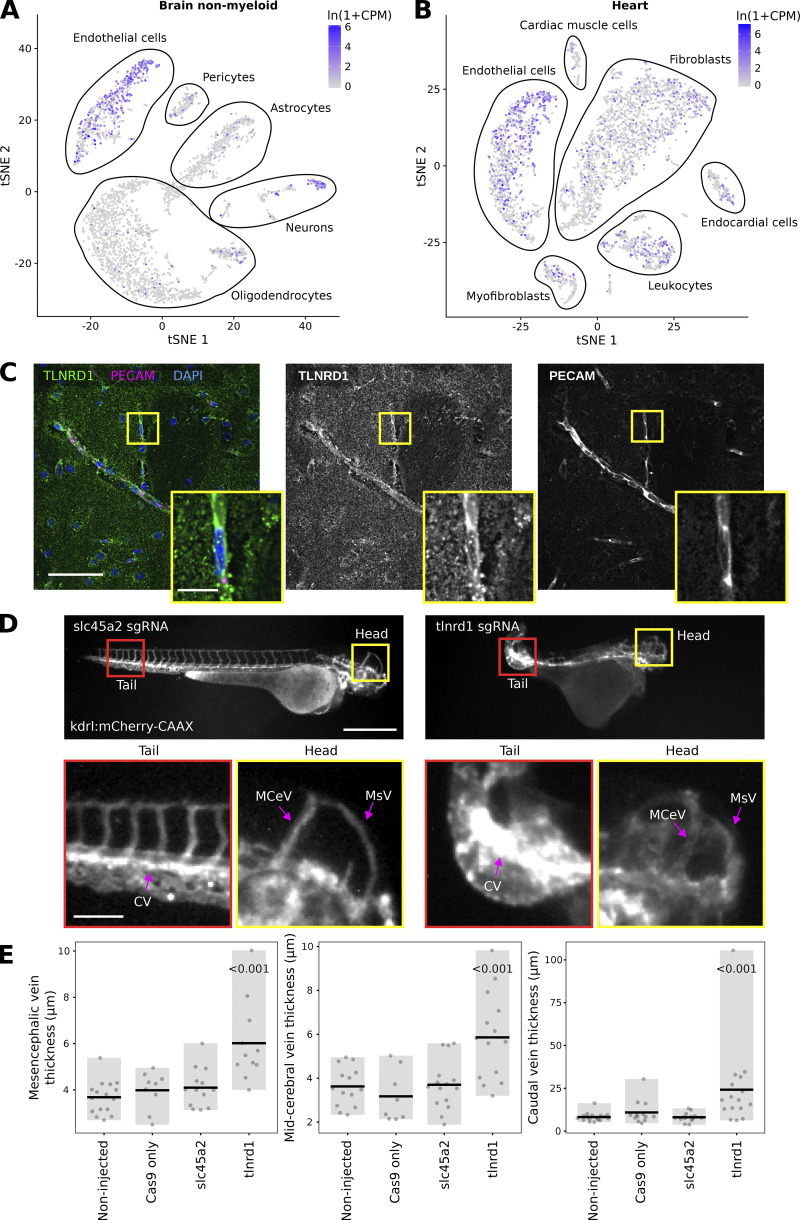
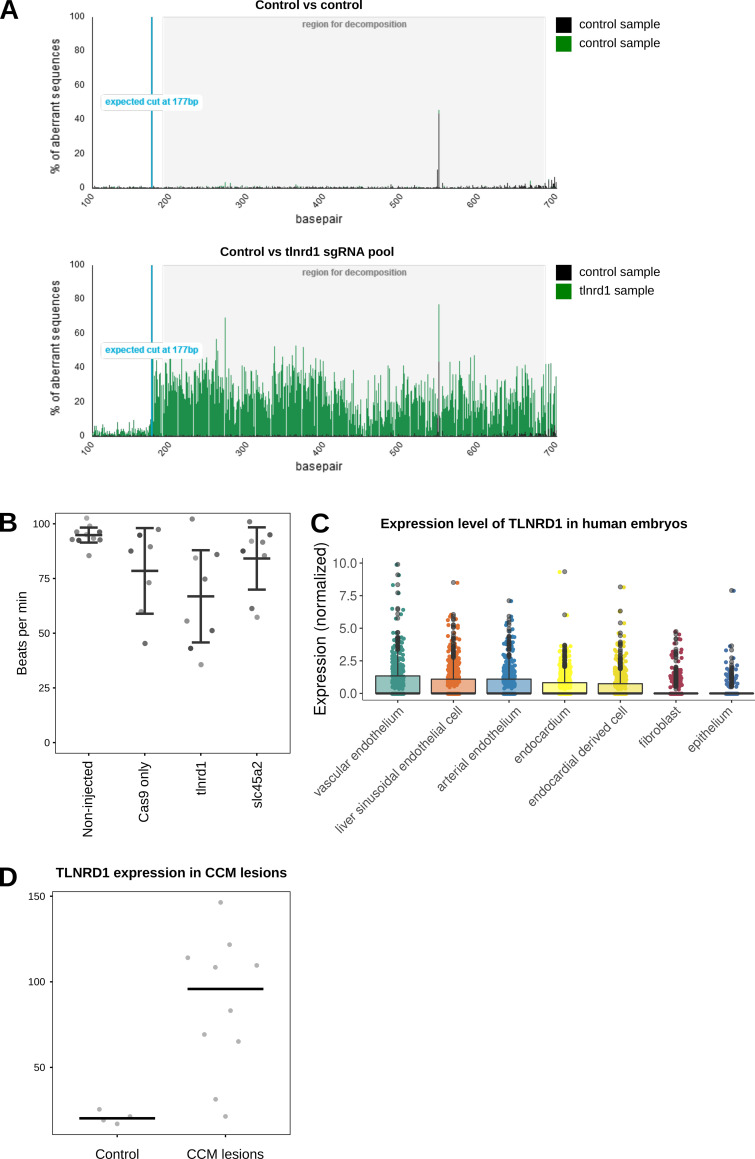
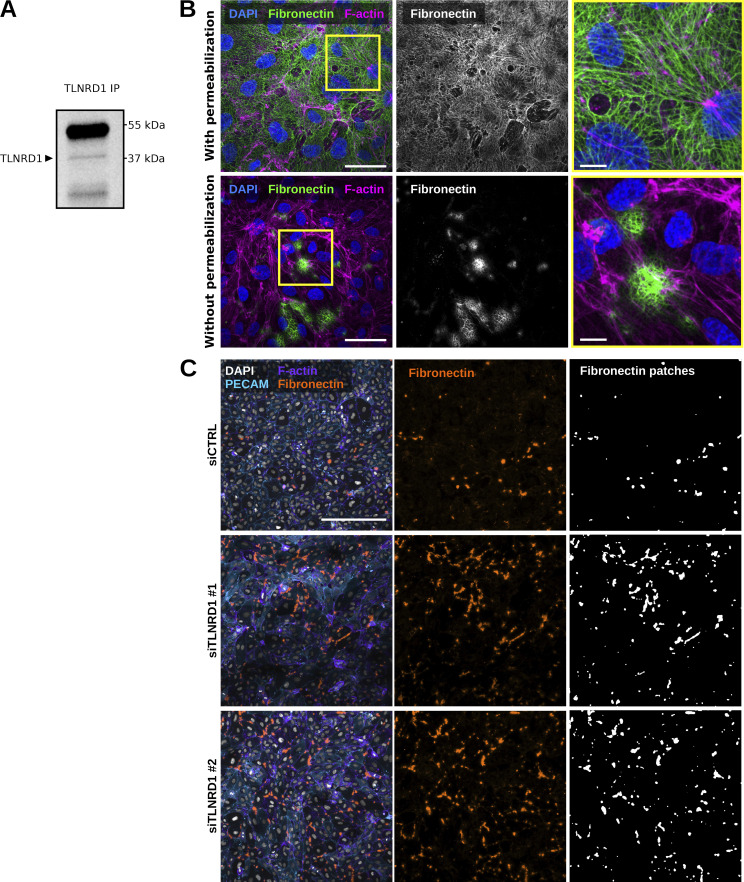
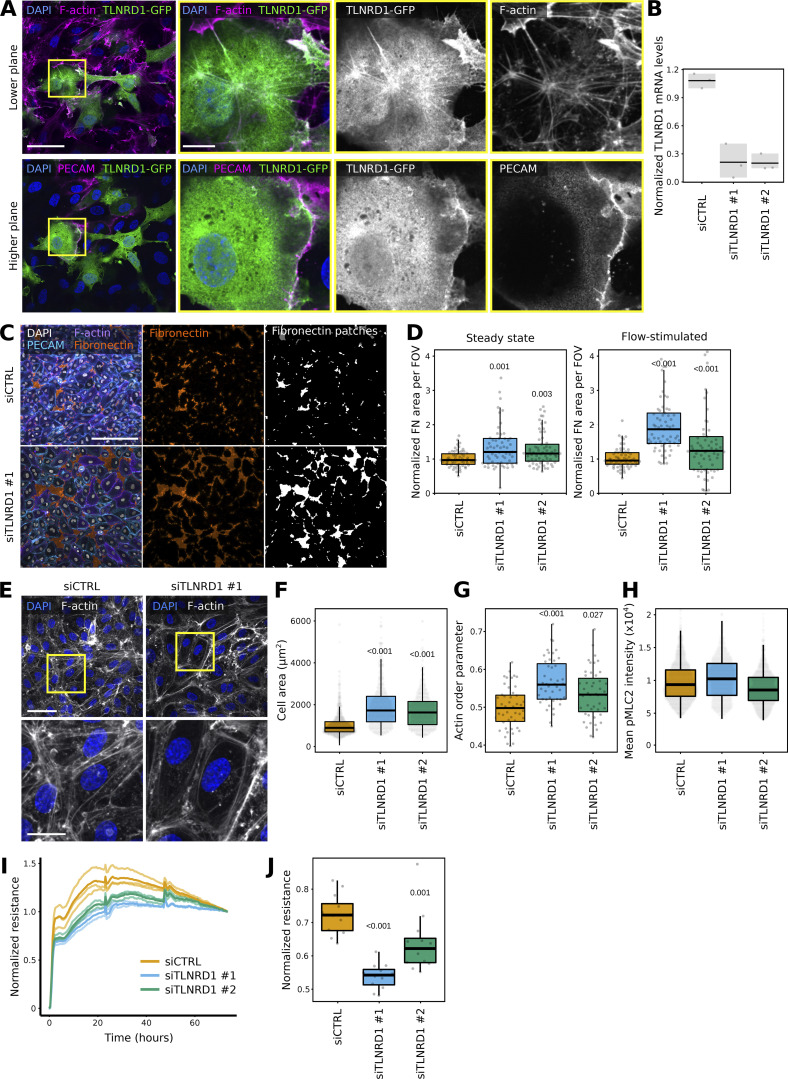
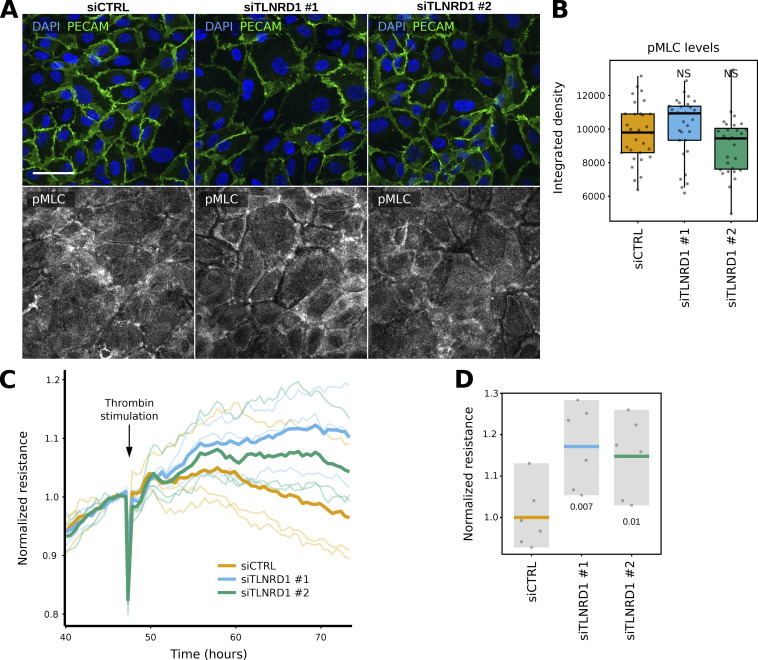
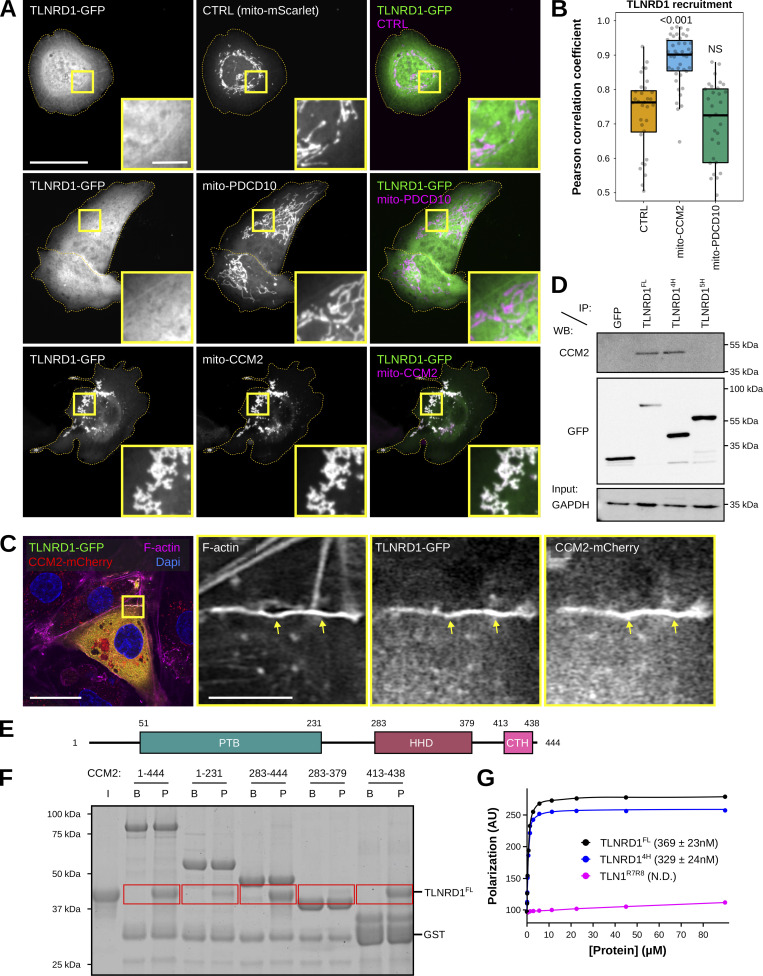
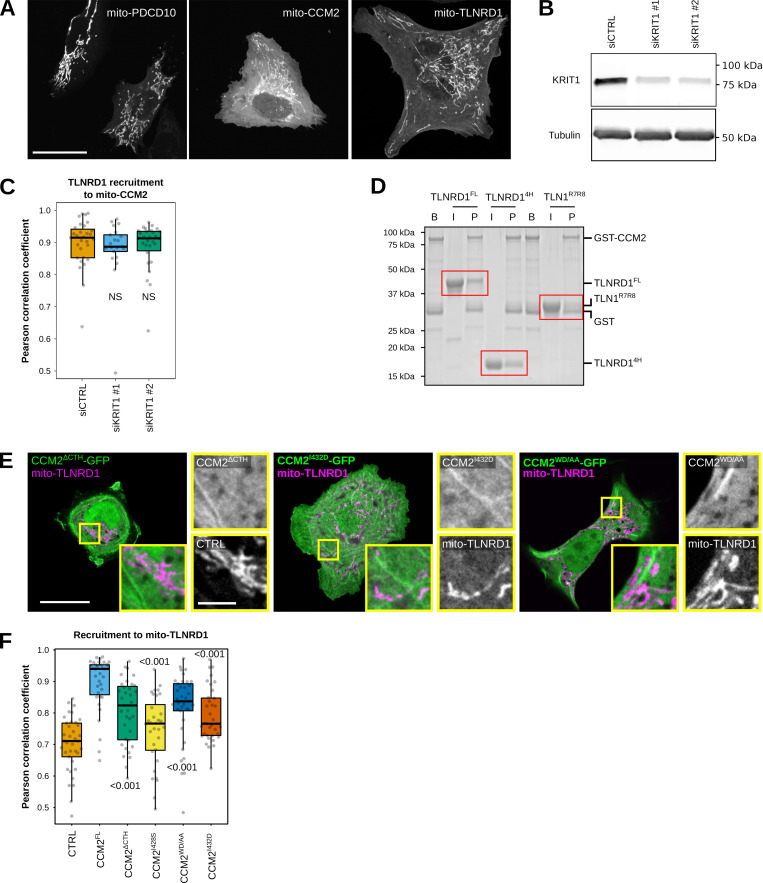
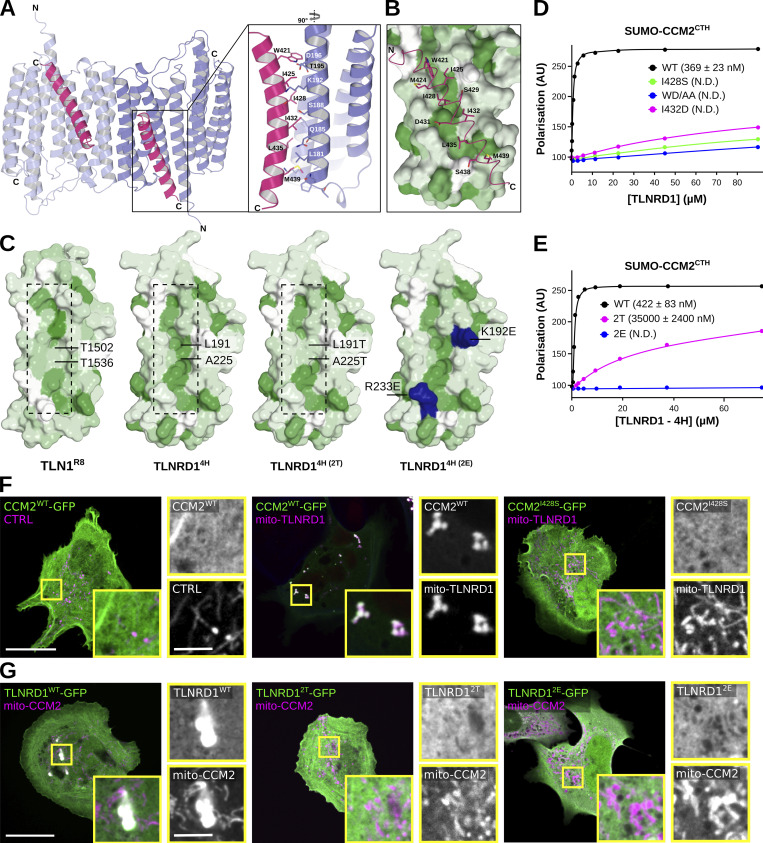
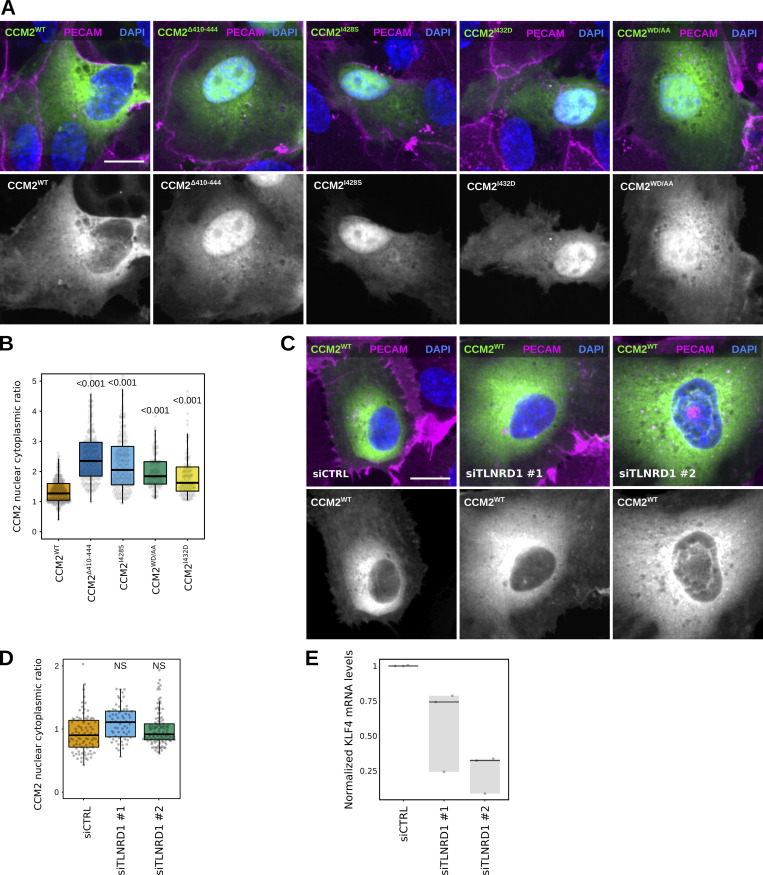
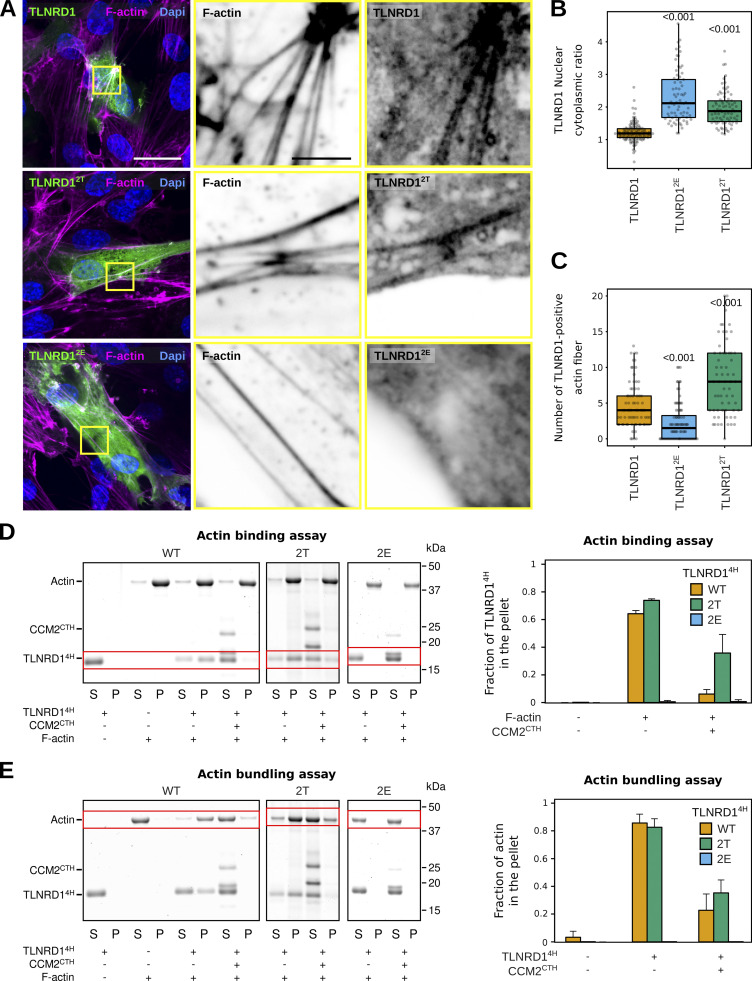
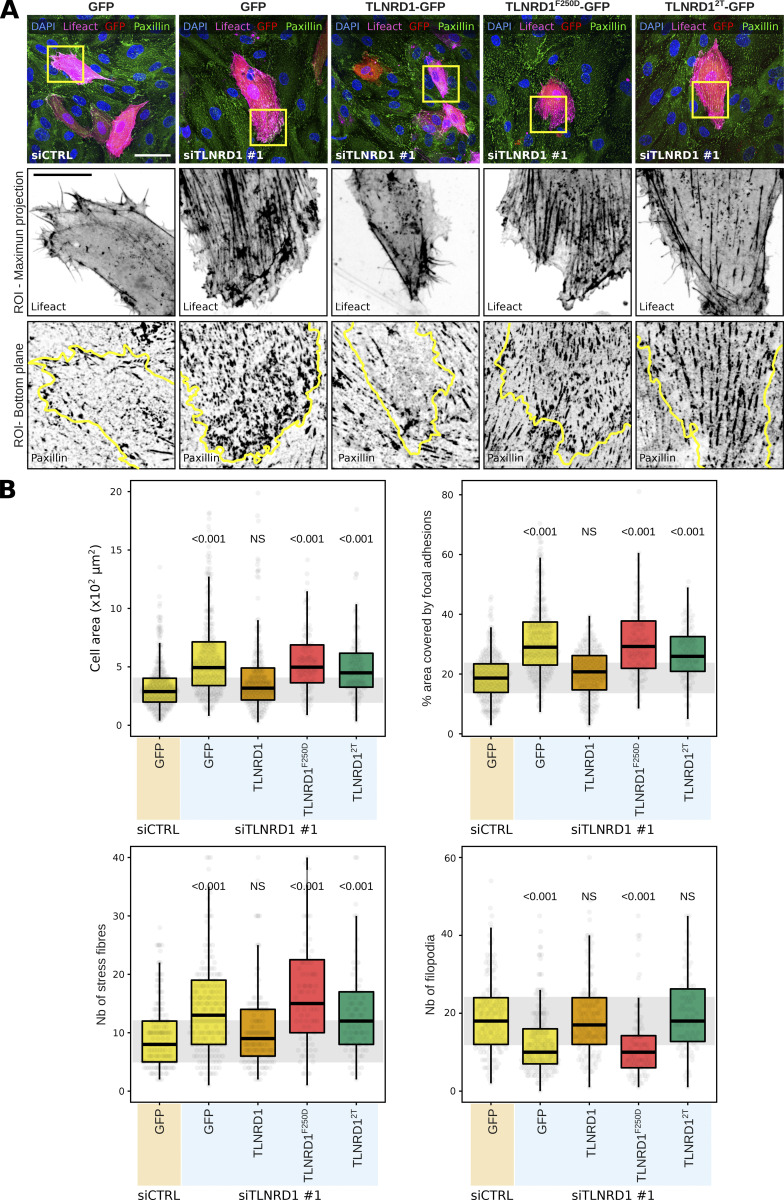
We previously identified talin rod domain-containing protein 1 (TLNRD1) as a potent actin-bundling protein in vitro. Here, we report that TLNRD1 is expressed in the vasculature in vivo. Its depletion leads to vascular abnormalities in vivo and modulation of endothelial cell monolayer integrity in vitro. We demonstrate that TLNRD1 is a component of the cerebral cavernous malformations (CCM) complex through its direct interaction with CCM2, which is mediated by a hydrophobic C-terminal helix in CCM2 that attaches to a hydrophobic groove on the four-helix domain of TLNRD1. Disruption of this binding interface leads to CCM2 and TLNRD1 accumulation in the nucleus and actin fibers. Our findings indicate that CCM2 controls TLNRD1 localization to the cytoplasm and inhibits its actin-bundling activity and that the CCM2-TLNRD1 interaction impacts endothelial actin stress fiber and focal adhesion formation. Based on these results, we propose a new pathway by which the CCM complex modulates the actin cytoskeleton and vascular integrity.


Conflict of interest statement

Disclosures: All authors have completed and submitted the ICMJE Form for Disclosure of Potential Conflicts of Interest. I. Paatero reported “University of Turku has registered trademark 3DFLUOHISTO, and I. Paatero is involved in the commercialization of 3DFLUOHISTO-technology.” No other disclosures were reported.

Figures

Figure 1.
Figure 1.
Mass spectrometry analyses identify TLNRD1 as a putative member of the CCM complex. (A–C) Mass spectrometry (MS) analysis of GFP-TLNRD1-binding proteins. A comparison of the GFP-TLNRD1 and GFP datasets is displayed in Venn diagram (A) and volcano plot (B). In the volcano plot, the enrichment ratio (TLNRD1 over GFP) for each protein detected is plotted against the significance of the association (see Table S1 for the MS data). Notably, proteins uniquely identified in either the TLNRD1 or GFP conditions were assigned a fold change of 400 to be displayed on the volcano plot. (C) Proteins specifically enriched to TLNRD1 were mapped onto a protein–protein interaction network (STRING, see the Materials and methods for details). Each node (circle) represents a protein (labeled with gene name), and each edge (line) represents a reported interaction between two proteins. The node’s color indicates the enrichment ratio of that particular protein (TLNRD1 over GFP). The node’s area represents the spectral count of that specific protein in the TLNRD1-GFP dataset. (D) GFP-pulldown in HEK293T cells expressing GFP-TLNRD1 or GFP alone. KRIT1 and ITGB1BP1 recruitment to the bait proteins was then assessed by Western blotting (representative of three biological repeats). Source data are available for this figure: SourceData F1.
Figure S1.
Figure S1.
TLNRD1, CCM2, PDCD10, and ITG1BP1 localize at the tip of MYO10 filopodia. U2OS cells expressing mScarlet-MYO10 with TLNRD1-GFP, CCM2-GFP, PDCD10-GFP, or ITG1BP1-GFP were plated on fibronectin for 2 h, fixed and stained to visualize F-actin. Samples were imaged using structured illumination microscopy. Representative maximum intensity projections are displayed; scale bars: (main) 5 µm; (inset) 1 µm. The yellow squares highlight magnified ROIs. The yellow arrows indicate the filopodia tips.
Figure 2.
Figure 2.
TLNRD1 is expressed in endothelial cells in vivo and regulates the vascular system. (A and B) TLNRD1 expression in mouse brain (A) and mouse heart (B). This single-cell RNA-Seq data is from the Tabula Muris dataset (Schaum et al., 2018). For the brain, endothelial cells were defined as Cdh5+, Pecam1+, Slco1c1+, and Ocln+; in the heart, endothelial cells were defined as Cdh5+ and Pecam1+ (Schaum et al., 2018). (C) Mouse brain slices were stained for TLNRD1, PECAM, and DAPI and imaged using a spinning disk confocal microscope. A single Z-plane is displayed. The yellow square highlights a magnified region of interest (ROI). Scale bars: (main) 50 µm and (inset) 10 µm. (D and E) kdrl:mCherry-CAAX zebrafish embryos were injected with recombinant Cas9 alone or together with sgRNA targeting TLNRD1 or slc45a2. The embryos were then imaged using a fluorescence microscope. (D) Representative images are displayed. The yellow and red squares highlight ROIs, which are magnified. The mesencephalic (MsV), mid-cerebral (MCeV), and caudal (CV) vein plexus are highlighted. Scale bars: (main) 500 µm and (inset) 100 µm. (E) The thickness of the mesencephalic, mid-cerebral, and caudal vein plexus measured from microscopy images are plotted as dot plots (non-injected, n = 17; Cas9, n = 13; slc45a2, n = 14; TLNRD1, n = 16). The gray bar highlights the data distribution, while the black line indicates the mean. The P values were determined using a randomization test.
Figure S2.
Figure S2.
TLNRD1 in vivo. (A) Efficacy analysis of tlnrd1 CRISPR in zebrafish embryos. The Sanger sequencing chromatograms between control and tlnrd1 sgRNA injected samples were compared using TIDE software. The peak intensities show deviation of sequences and indicate effective editing of the tlnrd1 locus. (B) Zebrafish heart rate analysis. Zebrafish embryos were imaged using fast video microscopy, and heart rate was analyzed using kymographs in Fiji (n > 7 per condition). (C) TLNRD1 expression in human embryos in single cells in various endothelial compartments, fibroblasts, and epithelial cells (data from Xu et al., 2023). (D) TLNRD1 expression (RNA levels) in CCM lesions. Data from Subhash et al. (2019). Controls are four patients diagnosed with temporal lobe epilepsy.
Figure S3.
Figure S3.
TLNRD1 in endothelial cells. (A) TLNRD1 immunoprecipitation from HUVEC lysate. A representative Western blot is displayed. (B) HUVECs were allowed to form a monolayer. Cells were then fixed and stained for DAPI, F-actin, and fibronectin (with or without permeabilization) before being imaged on a spinning disk confocal microscope. Representative maximum intensity projections are displayed. Scale bar: 250 µm. (C) TLNRD1 expression was silenced in HUVECs using two independent siRNA. HUVECs were then allowed to form a monolayer without flow stimulation. Cells were then fixed and stained for DAPI, F-actin, PECAM, and Fibronectin (without permeabilization) before being imaged on a spinning disk confocal microscope. Representative maximum intensity projections are displayed. Scale bar: 250 µm. Source data are available for this figure: SourceData FS3.
Figure 3.
Figure 3.
TLNRD1 modulates endothelial monolayer integrity. (A) HUVECs expressing TLNRD1-GFP were fixed, stained for DAPI, F-actin, and PECAM, and imaged using a spinning disk confocal microscope. Two Z-planes from the same field of view are displayed. The yellow squares highlight magnified ROIs. Scale bars: (main) 50 µm and (inset) 10 µm. (B–D) TLNRD1 expression was silenced in HUVECs using two independent siRNA. (B) TLNRD1 expression levels were determined by qPCR. (C and D) HUVEC cells were allowed to form a monolayer in the presence or absence of flow stimulation. Cells were then fixed and stained for DAPI, F-actin, PECAM, and fibronectin (without permeabilization) before imaging on a spinning disk confocal microscope. (C) Representative maximum intensity projections are displayed (flow stimulation). Scale bar: 250 µm. (D) The area covered by fibronectin patches in each field of view was then quantified (three biological repeats, n > 60 fields of view per condition). (E–H) TLNRD1 expression was silenced in HUVECs using two independent siRNAs, and cells were allowed to form a monolayer without flow stimulation. Cells were then fixed and stained for DAPI and F-actin or phospho-Myosin light chain (pMLC S20). Images were acquired using a spinning disk confocal microscope. (E) Representative SUM projections are displayed. Scale bar: (main) 50 µm and (inset) 20 µm. (F) The cell area was measured using manual cell segmentation (three biological repeats, >45 fields of view, >460 cells per condition). (G) The actin organization (order parameter) was quantified using Alignment by Fourier Transform (Marcotti et al., 2021). (H) The average pMLC intensity per cell is displayed. In this case, cells were automatically segmented using cellpose (three biological repeats, n > 861 cells per condition). (I and J) Assessment of trans-endothelial electrical resistance (TEER) in siCTRL and siTLNRD1 endothelial monolayers was conducted utilizing the xCELLigence system. Individual TEER trajectories were normalized to their final readings to study the establishment of the TEER over time. (I) Displays represent data from one biological replicate. Here, the mean TEER trajectory from three individual wells is delineated with a bold line. In contrast, individual TEER curves are rendered in a lighter shade to delineate specific measurements within the same replicate. (J) Focuses on the comparative analysis at the time when siCTRL cells attain 70% of their ultimate TEER values, highlighting the impact of TLNRD1 silencing on developing endothelial barrier function (4 biological repeats, 11 measurements). The results are shown as Tukey boxplots. The whiskers (shown here as vertical lines) extend to data points no further from the box than 1.5× the interquartile range. The P values were determined using a randomization test.
Figure S4.
Figure S4.
TLNRD1 modulates endothelial barrier function. (A and B) siCTRL and siTLNRD1 endothelial cells were allowed to form a monolayer without flow stimulation. Cells were then fixed and stained for phospho-Myosin light chain (pMLC S20) before being imaged on a spinning disk confocal microscope. (A) Representative sum projections are displayed. (B) The overall integrated density was measured for each field of view from SUM projections (three biological repeats, n = 45 FOV per condition). (C and D) Assessment of trans-endothelial electrical resistance (TEER) in siCTRL and siTLNRD1 endothelial monolayers before and after thrombin stimulation was conducted utilizing the xCELLigence system. Individual TEER trajectories were normalized to the readings before the thrombin stimulation to study the effect of thrombin on TEER over time. Thrombin stimulation was performed 48 h after initial recording. (C) Displays representative data from one biological replicate. Here, the mean TEER trajectory from three individual wells is delineated with a bold line. In contrast, individual TEER curves are rendered in a lighter shade to delineate specific measurements within the same replicate. (D) Comparative analysis of the TEER values at 26 h after thrombin stimulation (two biological repeats, six measurements). The P values were determined using a t test (two-sided, assuming unequal population variances).
Figure 4.
Figure 4.
The TLNRD1–CCM2 interaction involves the TLNRD1 4-helix bundle and a C-terminal helix in CCM2. (A and B) U2OS cells expressing TLNRD1-GFP and mito-mScarlet (CTRL), mito-PDCD10-mScarlet, or mito-CCM2-mScarlet were imaged using a spinning disk confocal microscope. (A) Representative single Z-planes are displayed. Dashed yellow lines highlight the cell outlines. The yellow squares highlight magnified ROIs. Scale bars: (main) 25 µm and (inset) 5 µm. (B) 3D colocalization analysis was performed using the JACoP Fiji plugin (three biological repeats, n > 31 image stacks per condition). The results are shown as Tukey boxplots. The whiskers (shown here as vertical lines) extend to data points no further from the box than 1.5× the interquartile range. The P values were determined using a randomization test. NS indicates no statistical difference between the mean values of the highlighted condition and the control. (C) HUVECs expressing TLNRD1-GFP and CCM2-mCherry were stained for F-actin and DAPI and imaged using an Airyscan confocal microscope. A single Z-plane is displayed. The yellow squares highlight a magnified ROI. Scale bars: (main) 25 µm and (inset) 5 µm. (D) GFP-pulldown in HEK293T cells expressing GFP-TLNRD1, GFP-TLNRD14H. GFP-TLNRD15H or GFP alone. CCM2 recruitment to the bait proteins was assessed by western blotting (representative of three biological repeats). (E) CCM2 schematic showing the boundaries of the phosphotyrosine binding (PTB) domain, the harmonin homology domain (HHD), and the C-terminal helix (CTH). (F) A GST-pulldown assay was used where Glutathione agarose-bound GST-CCM2 fragments (beads: B) were incubated with recombinant TLNRD (input: I). After multiple washes, proteins bound to the beads (pellet: P) were eluted. Red boxes highlight areas of interest in the gel. (G) A fluorescence polarization assay was used to determine the Kd of the interaction between TLNRD1, TLNRD14H, or TLN1R7R8 with SUMO-CCM2CTH. Kd values (nM) are shown in parentheses. ND, not determined. Source data are available for this figure: SourceData F4.
Figure S5.
Figure S5.
TLNRD1 interacts with CCM2. (A) U2OS cells expressing mito-PDCD10-mScarlet, mito-CCM2-mScarlet, or mito-TLNRD1-mScarlet were imaged using a spinning disk confocal microscope. (B) U2OS cells treated with siRNA targeting KRIT1 or siRNA control. KRIT1 levels were then analyzed using Western blots. A representative western blot is displayed. (C) U2OS cells treated with siRNA targeting KRIT1 or siRNA control and expressing TLNRD1-GFP and mito-CCM2-mScarlet were imaged using a spinning disk confocal microscope. 3D colocalization analyses were performed using the JACoP Fiji plugin, and results are displayed as Tukey boxplots (three biological repeats, n > 21 image stacks per condition). (D) Glutathione agarose-bound GST-CCM2 (beads: B) was incubated with recombinant TLNRD1, TLNRD14H, or TLN1R7R8 (input: I). After multiple washes, proteins bound to the beads (pellet: P) were visualized. The various fractions were then analyzed using SDS-PAGE followed by Coomassie staining. A representative gel of three independent repeats is displayed. Red boxes highlight areas of interest in the gel. (E) U2OS cells expressing various GFP-tagged CCM2 constructs and mito-TLNRD1-mScarlet or mito-mScarlet (CTRL) were imaged using a spinning disk confocal microscope. Representative single Z-planes are displayed. The yellow squares highlight magnified ROIs. Scale bars: (main) 25 µm and (inset) 5 µm. (F) 3D colocalization analyses were performed using the JACoP Fiji plugin, and results are displayed as Tukey boxplots (three biological repeats, n > 38 image stacks per condition). The whiskers (shown here as vertical lines) extend to data points no further from the box than 1.5× the interquartile range. For all panels, the P values were determined using a randomization test. NS indicates no statistical difference between the mean values of the highlighted condition and the control. Source data are available for this figure: SourceData FS5.
Figure 5.
Figure 5.
The TLNRD1–CCM2 binding interface involves a hydrophobic groove on TLNRD1 and hydrophobic residues of CCM2. (A and B) Modeling of the TLNRD1–CCM2 complex using ColabFold using the TLNRD1 crystal structure (PDB accession no. 6XZ4) as a template. (A) Overall view of the predicted complex. The TLNRD1 monomers are colored blue, and the CCM2CTH helices are colored pink. The TLNRD1–CCM2 binding area is magnified, and the residues contributing to the interface are shown as sticks. (B) TLNRD1 has a hydrophobic channel (green) on the surface, which could facilitate CCM2 (pink) binding. The TLNRD1 four-helix module was colored by hydrophobicity using the AA index database (entry FASG890101 [Nakai et al., 1988]) in PyMOL, where green denotes hydrophobic residues and white polar residues. CCM2CTH is shown as sticks and predominantly contacts the hydrophobic region on TLNRD14H. (C) Comparison of the hydrophobic channel on the surface of TLNRD14H and the equivalent region on TLN1R8. The TLNRD12T mutant was designed to mimic the surface of TLN1R8. The green color denotes hydrophobic residues. On the TLNRD12E, the mutated basic residues are highlighted in blue. (D) Fluorescence polarization was used to determine the Kd of the interaction between TLNRD1 and various SUMO-CCM2CTH constructs (WT, I428S, I432D, and W412A/D422A). Kd values (nM) are shown in parentheses. ND, not determined. (E) Fluorescence polarization was used to determine the Kd of the interaction between CCM2CTH and various TLNRD14H constructs (WT, 2T, and 2E). Kd values (nM) are shown in parentheses. ND, not determined. (F) U2OS cells expressing various GFP-tagged CCM2 constructs and mito-TLNRD1-mScarlet or mito-mScarlet (CTRL) were imaged using a spinning disk confocal microscope. Representative single Z-planes are displayed. See also Fig. S5, E and F. Scale bars: (main) 25 µm and (inset) 5 µm. (G) U2OS cells expressing various GFP-tagged TLNRD1 constructs and mito-CCM2-mScarlet or mito-mScarlet (CTRL) were imaged using a spinning disk confocal microscope. Representative maximum intensity projections are displayed. Scale bars: (main) 25 µm and (inset) 5 µm.
Figure 6.
Figure 6.
TLNRD1 silencing does not impact CCM2 localization. (A and B) HUVECs expressing various CCM2-GFP constructs were stained for DAPI and PECAM and imaged using a spinning disk confocal microscope. (A) SUM projections are displayed. Scale bar: 10 µm. (B) For each condition, the CCM2 nuclear-cytoplasmic ratio was quantified (three biological repeats, n > 110 cells per condition). (C–E) TLNRD1 expression was silenced in HUVECs using two independent siRNA. (C and D) Cells were then transfected to express CCM2-GFP and allowed to form a monolayer. Cells were fixed and stained for DAPI and PECAM and imaged using a spinning disk confocal microscope. (C) SUM projections are displayed. Scale bar: 10 µm. (D) For each condition, the CCM2 nuclear-cytoplasmic ratio was quantified (three biological repeats, n > 60 cells per condition). (E) HUVECs were then allowed to form a monolayer without flow stimulation. KLF4 expression levels were measured by qPCR. (B and D) The results are displayed as Tukey boxplots. The whiskers (shown here as vertical lines) extend to data points no further from the box than 1.5× the interquartile range. For all panels, the P values were determined using a randomization test. NS indicates no statistical difference between the mean values of the highlighted condition and the control.
Figure 7.
Figure 7.
CCM2 modulates TLNRD1 localization and bundling activity. (A–C) HUVECs expressing various TLNRD1-GFP constructs were stained for DAPI and F-actin and imaged using a spinning disk confocal microscope. (A) Single Z-planes are displayed. The yellow squares highlight magnified ROIs. Scale bars: (main) 25 µm and (inset) 5 µm. (B and C) For each condition, the TLNRD1 nuclear-cytoplasmic ratio and the number of TLNRD1-positive actin fibers were quantified (see methods for details), and results are displayed as Tukey boxplots (three biological repeats, n > 72 cells per condition). The P values were determined using a randomization test. (D and E) Actin co-sedimentation assay with various TLNRD14H mutants in the presence or absence of CCM2CTH. Centrifugation at high (D, 48,000 rpm) or low (E, 16,000 rpm) speeds can distinguish between F-actin binding and bundling capability. Representative SDS-PAGE gels are displayed. The quantification was performed using densitometry, and the fraction of TLNRD1 (D) and F-actin (E) present in the pellet was plotted. Standard deviation from three independent repeats are represented as error bars. Source data are available for this figure: SourceData F7.
Figure 8.
Figure 8.
CCM2 modulates TLNRD1 localization and bundling activity. (A and B) HUVECs treated with siCTRL or siTLNRD1 siRNA and expressing lifeact-RFP along with GFP, TLNRD1-GFP, TLNRD12T-GFP, or TLNRD1F250D-GFP were fixed and stained for DAPI and paxillin, followed by imaging using a spinning disk confocal microscope. (A) Maximal intensity projections of representative fields of view. Highlighted within yellow squares are ROIs selected for magnification. The upper ROI panel presents maximal intensity projections showcasing lifeact-RFP and GFP-positive cells. In contrast, the lower ROI panels concentrate on the basal plane to showcase the paxillin-positive adhesions, with yellow outlines delineating the contours of GFP-positive cells. Scale bars: (main) 50 µm and (inset) 20 µm. (B) Quantitative analysis was performed on GFP-positive cells, evaluating various parameters: cell area, the proportion of the cell area covered by paxillin-positive adhesions, and the number of actin stress fibers and filopodia (four biological repeats, >60 fields of view per condition). The results are shown as Tukey boxplots. The whiskers (shown here as vertical lines) extend to data points no further from the box than 1.5× the interquartile range. The P values were determined using a randomization test.

References

    1. Arzt, M., Deschamps J., Schmied C., Pietzsch T., Schmidt D., Tomancak P., Haase R., and Jug F.. 2022. LABKIT: Labeling and segmentation toolkit for big image data. Front. Comput. Sci. 4:777728. 10.3389/fcomp.2022.777728 - DOI
    1. Ball, N.J., Ghimire S., Follain G., Pajari A.O., Diana W., Vaitkevičiūtė M., Cowell A.R., Berki B., Ivaska J., Paatero I., et al. . 2024. TLNRD1 is a CCM complex component and regulates endothelial barrier integrity. zenodo. 10.5281/zenodo.11185144 - DOI - PMC - PubMed
    1. Bindels, D.S., Haarbosch L., van Weeren L., Postma M., Wiese K.E., Mastop M., Aumonier S., Gotthard G., Royant A., Hink M.A., and Gadella T.W. Jr.. 2017. mScarlet: a bright monomeric red fluorescent protein for cellular imaging. Nat. Methods. 14:53–56. 10.1038/nmeth.4074 - DOI - PubMed
    1. Bolte, S., and Cordelières F.P.. 2006. A guided tour into subcellular colocalization analysis in light microscopy. J. Microsc. 224:213–232. 10.1111/j.1365-2818.2006.01706.x - DOI - PubMed
    1. Brinkman, E.K., Chen T., Amendola M., and van Steensel B.. 2014. Easy quantitative assessment of genome editing by sequence trace decomposition. Nucleic Acids Res. 42:e168. 10.1093/nar/gku936 - DOI - PMC - PubMed

MeSH terms