. 2024 Aug 8;187(16):4272-4288.e20.
doi: 10.1016/j.cell.2024.06.024. Epub 2024 Jul 15.

The WDR11 complex is a receptor for acidic-cluster-containing cargo proteins

Affiliations

The WDR11 complex is a receptor for acidic-cluster-containing cargo proteins

Huaqing Deng et al. Cell. .

Abstract

Vesicle trafficking is a fundamental process that allows for the sorting and transport of specific proteins (i.e., "cargoes") to different compartments of eukaryotic cells. Cargo recognition primarily occurs through coats and the associated proteins at the donor membrane. However, it remains unclear whether cargoes can also be selected at other stages of vesicle trafficking to further enhance the fidelity of the process. The WDR11-FAM91A1 complex functions downstream of the clathrin-associated AP-1 complex to facilitate protein transport from endosomes to the TGN. Here, we report the cryo-EM structure of human WDR11-FAM91A1 complex. WDR11 directly and specifically recognizes a subset of acidic clusters, which we term super acidic clusters (SACs). WDR11 complex assembly and its binding to SAC-containing proteins are indispensable for the trafficking of SAC-containing proteins and proper neuronal development in zebrafish. Our studies thus uncover that cargo proteins could be recognized in a sequence-specific manner downstream of a protein coat.

Keywords: AP-1; WDR11; cargo selection; neuronal development; vesicle tethering; vesicle trafficking.


Conflict of interest statement

Declaration of interests The authors declare no competing interests.

Figures
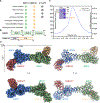
Figure 1.
Figure 1.. Cryo-EM structure of the human WDR11-FAM91A1 complex.
(A) Presence of WDR11, FAM91A1, and C17orf75 in a variety of common model organisms. Solid green, brown, and gray circles indicate WDR11, FAM91A1, C17orf75, or their homolog, respectively. (B) Domain organization of WDR11 (green) and FAM91A1 (brown). The names and boundaries of domains are labeled. WD40–1 and WD40–2 indicate the first and second WD40 domain of WDR11, respectively. NTD and CTD indicate the N-terminal and C-terminal domain of FAM91A1, respectively. (C) Molecular mass of the wild type (WT) WDR11-FAM91A1 complex measured by Static-Light-Scattering (SLS). The horizontal axis is elution volume (Superpose 6 10/300 GL), the left vertical axis is the molecular mass and the right vertical axis is ultraviolet (UV) absorption at 280nm. The Coomassie blue-stained sodium dodecyl sulfate-polyacrylamide gel electrophoresis (SDS-PAGE) gel shows the peak of the WDR11-FAM91A1 complex from the column. (D) Two views of the cryo-EM map (left) and model (right) of intact dimeric WDR11-FAM91A1 complex containing FAM91A1’ (red), WDR11’ (blue), WDR11 (green) and FAM91A1 (brown). The bottom view is a 180° rotation along the horizontal axis of the top view.
Figure 2.
Figure 2.. The WDR11-FAM91A1 complex further dimerizes via WDR11.
(A) The high-resolution map of the WDR11-FAM91A1 complex and its cartoon representation. (B) The dimer interface of the WDR11 and WDR11′ (green and blue) with critical amino acid residues shown. (C) (D) The view obtained by rotating the (B) view around the horizontal axis and the vertical axis. Yellow dashed lines indicate hydrogen bonds or disulfide bonds. (E) HEK293T cells were transfected with mCherry-tagged WDR11 WT and GFP-tagged WDR11 WT or WDR11 dimer mutant (WDR11-dm), and then subjected to mCherry-nanotrap for immunoprecipitation. WDR11 and WDR11-dm were detected via antibodies against mCherry and GFP, respectively. Experiments were performed in triplicate.
Figure 3.
Figure 3.. Interaction between WDR11 and FAM91A1.
(A) Two views of the WDR11-FAM91A1 complex protomer are shown in cartoon. WDR11 and FAM91A1 are colored in green and brown, respectively. (B) (C) (D) The detailed views of the interface between WDR11 and FAM91A1 showed the critical amino acid residues in the interface. Yellow dashed lines indicate hydrogen bonds. (E) HEK293T cells were transfected with mCherry-tagged WDR11 WT and GFP-tagged FAM91A1 WT, FAM91A1 RRKEEE, or FAM91A1 Δα mutants, and then subjected to GFP-nanotrap for immunoprecipitation. FAM91A1 and WDR11 were detected via antibodies against GFP and mCherry, respectively. Experiments were performed in triplicate. (F) HEK293T cells were transfected with mCherry-tagged FAM91A1 WT and GFP-tagged WDR11 WT, WDR11 ΔSITAQ, KLLAAA, or KEAA mutants, and then subjected to mCherry-nanotrap for immunoprecipitation. FAM91A1 and WDR11 were detected via antibodies against mCherry and GFP, respectively. Experiments were performed in triplicate.
Figure 4.
Figure 4.. WDR11 directly interacts with the acidic-clusters-containing cargoes.
(A) The structure of WDR11 is shown in cartoon and the domains are labeled. (B) Electrostatic surface potential map of WDR11 and zoomed-in picture of a region rich in basic amino acids. The lysine residues in this region are labeled. (C) HEK293T cells were transfected with Venus-tagged CI-MPR cytosolic tail WT and mCherry-tagged WDR11 WT, WDR11 K9D, 2KD (K479D+K482D), K719D, K761D, or K808D mutants, and then subjected to mCherry-nanotrap for immunoprecipitation. CI-MPR and WDR11 were detected via antibodies against GFP (Venus) and mCherry, respectively. Experiments were performed in triplicate. (D) The sequence arrangement of the wild type CI-MPR cytosolic tail (WT), acidic cluster 1 (AC1), and acidic cluster 2 (AC2). (E) His-pulldown assays performed with the complex of His-FAM91A1 and WDR11 WT and purified GST-CI-MPR WT, GST-CI-MPR AC1, GST-CI-MPR AC2, or GST. GST-CI-MPR WT, GST-CI-MPR AC1, GST-CI-MPR AC2, or GST is marked with red stars, and the complex of His-FAM91A1 and WDR11 WT is denoted by red triangles. Experiments were performed in triplicate. (F) Bio-layer interferometry (BLI) binding studies of the WDR11-FAM91A1 complex with CI-MPR acidic cluster 1 peptide (AC1 WT). The purified WDR11-FAM91A1 complex was fixed to the probe and different concentrations of AC-1 WT peptide were present in the pool below. Experiments were performed in triplicate.
Figure 5.
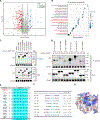
Figure 5.. Proximity proteomics reveal that WDR11-binding proteins harbor a Super Acidic Cluster.
(A) Volcano plot of quantitative analysis of comparative interactome of WDR11–2KD vs WDR11-WT across n=3 independent experiments using One-sample t-test and Benjamini-Hochberg FDR. Red dots indicate up-regulation in WDR11–2KD compared to WDR11-WT cells. Blue dots signify down-regulation in WDR11–2KD compared to WDR11-WT cells. Gray dots represent no significant difference between WDR11–2KD and WDR11-WT cells. (B) The GO/KEGG enrichment analysis of 183 proteins (fold change < 0.667; p < 0.05, t-test) significantly reduced in the WDR11–2KD group compared to the WDR11-WT group. (C) HEK293T cells were transfected with mCherry-tagged WDR11 and Venus, Venus-tagged CI-MPR cytosolic tail, ATG9A cytosolic tail, TMEM87B cytosolic tail, SV2A cytosolic tail, MERTK cytosolic tail, VAMP4 cytosolic tail, and VAMP7 cytosolic tail, respectively. Then subjected to mCherry-nanotrap for immunoprecipitation. WDR11 was detected via antibody against mCherry. CI-MPR, ATG9A, TMEM87B, SV2A, MERTK, VAMP4, and VAMP7 were detected via antibody against GFP (Venus). Experiments were performed in triplicate. (D) HEK293T cells were transfected with mCherry-tagged WDR11-WT or mCherry-tagged WDR11–2KD and Venus-tagged CI-MPR cytosolic tail, ATG9A cytosolic tail, TMEM87B cytosolic tail, SV2A cytosolic tail, MERTK cytosolic tail, and VAMP4 cytosolic tail, respectively. Then subjected to mCherry-nanotrap for immunoprecipitation. WDR11-WT and WDR11–2KD were detected via antibody against mCherry. CI-MPR, ATG9A, TMEM87B, SV2A, MERTK, and VAMP4 were detected via antibody against GFP (Venus). Experiments were performed in triplicate. (E) Alignment of the proteins with cytosolic tail containing acidic clusters bound to WDR11 (Φ = bulky hydrophobic amino acids) established by comparative analysis. (F) Affinity results of CI-MPR-AC1 WT and its mutants with the WDR11-FAM91A1 complex. (G) The model of the WDR11-CI-MPR-AC1 complex predicted by AlphaFold2. WDR11 was shown in an electrostatic surface potential map, and CI-MPR-AC1 was shown in cartoon. The critical amino acids in the interface were shown in sticks and labeled.
Figure 6.
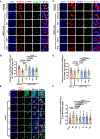
Figure 6.. The WDR11-FAM91A1 complex assembly and its interaction with cargoes are required for SAC-containing protein trafficking.
(A) Subcellular location of CI-MPR in HeLa cells. The WDR11 KO cells were transfected with mCherry, mCherry-tagged WDR11 WT, dm, KEAA, or 2KD, respectively. Cells were then incubated with antibodies against CI-MPR (purple) and golgin-97 (green). The golgin-97 is a marker for the TGN region. Scale bar: 10 μm. Experiments were performed in triplicate. (B) Colocalization analysis between CI-MPR and golgin-97 in (A). Each dot represents Pearson’s correlation coefficients from one cell. Con: n=78 cells; mCherry: n=71 cells; WT: n=57 cells; dm: n=47 cells; KEAA: n=55 cells; 2KD: n=60 cells. Data are presented as mean ± SD, and P values were calculated using one-way ANOVA and Tukey’s multiple comparisons tests. (C) Subcellular location of ATG9A in HeLa cells. The WDR11 KO cells were transfected with mCherry, mCherry-tagged WDR11 WT, dm, KEAA, or 2KD, respectively. Cells were then incubated with antibodies against ATG9A (purple) and golgin-97 (green). Scale bar: 10 μm. Experiments were performed in triplicate. (D) Colocalization analysis between CI-MPR and golgin-97 in (C). Each dot represents Pearson’s correlation coefficients from one cell. Con: n=40 cells; mCherry: n=38 cells; WT: n=41 cells; dm: n=34 cells; KEAA: n=42 cells; 2KD: n=40 cells. Data are presented as mean ± SD, and P values were calculated using one-way ANOVA and Tukey’s multiple comparisons tests. (E) Subcellular location of CI-MPR in HeLa cells. The HeLa cells were transfected with mCherry-GRIP (a marker of trans-Golgi) and Venus-tagged CI-MPR cytosolic tails -WT, -AC2, -AC1-LA, -AC1-VLAA, -AC1–4D, or -AC1–12D, respectively. Cells were fixed, permeabilized, and stained for the cell nuclei before observation using fluorescence microscopy. Scale bar: 10 μm. Experiments were performed in triplicate. (F) Colocalization analysis between CI-MPR and GRIP in (E). Each dot represents Pearson’s correlation coefficients from one cell. Vector: n=67 cells; WT: n=42 cells; AC2: n=61 cells; LA: n=47 cells; VLAA: n=54 cells; 4D: n=51 cells; 12D: n=42 cells. Data are presented as mean ± SD, and P values were calculated using one-way ANOVA and Tukey’s multiple comparisons tests.
Figure 7.
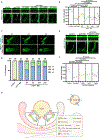
Figure 7.. The WDR11-FAM91A1 complex assembly is critical for neuronal development in zebrafish.
(A) CaP motor neuron axons of [Hb9: GFP]ml2 transgenic zebrafish embryos at 48 hpf that were injected with wdr11 MO or coinjected with indicated mRNAs. All injections were performed at the one-cell stage of embryos. Lateral views (Top); enlarged views of one axon (Bottom). Rectangles indicate axons shown in the Bottom. Scale bar: 100 μm. Experiments were performed in triplicate. (B) Statistical results of the length of Cap neuron axons were treated as in A. For each embryo, 3 axons were counted, and for each group, 10 Tg[Hb9: GFP]ml2 zebrafish embryos were scored. P values were calculated using nested one-way ANOVA, Tukey’s multiple comparisons test. (C) HuC(green) expression in Tg[HuC: GFP] transgenic zebrafish at 48 hpf. Classification of embryos was based on the expression level of HuC (elavl3) at 48 hpf. C1, normal; C2, moderate defects; C3, severe defects. Lateral views (Top); dorsal views (Bottom). Arrows indicate the morphology of neurons in the midbrain. Scale bar: 100 μm. Experiments were performed in triplicate. (D) Percentage of embryos in each group upon injection of wdr11 MO or coinjection of indicated mRNAs. n stands for the number of embryos counted for analysis. (E) CaP axons of Tg[Hb9: GFP]ml2 zebrafish embryos at 48 hpf that were injected with wdr11 MO or coinjected with different concentrations of KIAA0319L mRNA. All injections were performed at the one-cell stage of embryos. Lateral views (Top); enlarged views of one axon (Bottom). Rectangles indicate axons shown in the Bottom. Scale bar: 100 μm. Experiments were performed in triplicate. (F) Statistical results of the length of Cap axons that were treated as in E. Con:n=9 embryos; wdr11 MO: n=9 embryos; wdr11 MO + KIAA0319L 50pg: n=10 embryos; wdr11 MO + KIAA0319L 75pg: n=10 embryos; wdr11 MO + KIAA0319L 100pg: n=10 embryos. P values were calculated using nested one-way ANOVA, Tukey’s multiple comparisons test. (G) A model showing how the WDR11-FAM91A1 complex selectively regulates the trafficking of SAC-containing cargoes. WDR11 directly recognizes the SAC motif in the cytoplasmic tail of cargo proteins, and the recognition is further enhanced by the dimerization of WDR11. FAM91A1, via its N-terminus, directly interacts with TBC1D23 which localizes on the TGN via binding to golgin-97/245. Thus, the WDR11-FAM91A1 complex and TBC1D23 cooperate to promote the endosome-to-TGN trafficking of SAC-containing cargoes. In addition to FAM91A1, TBC1D23 also binds to the WASH complex localized on the endosomal vesicles, which may explain the role of TBC1D23 in transporting proteins without the SAC motif.

References

    1. Cohen S, Valm AM, and Lippincott-Schwartz J (2018). Interacting organelles. Curr. Opin. Cell Biol 53, 84–91. 10.1016/j.ceb.2018.06.003. - DOI - PMC - PubMed
    1. Cui L, Li H, Xi Y, Hu Q, Liu H, Fan J, Xiang Y, Zhang X, Shui W, and Lai Y (2022). Vesicle trafficking and vesicle fusion: mechanisms, biological functions, and their implications for potential disease therapy. Mol. Biomed 3, 29. 10.1186/s43556-022-00090-3. - DOI - PMC - PubMed
    1. Bonifacino JS, and Glick BS (2004). The mechanisms of vesicle budding and fusion. Cell 116, 153–166. 10.1016/s0092-8674(03)01079-1. - DOI - PubMed
    1. Gillingham AK, and Munro S (2019). Transport carrier tethering - how vesicles are captured by organelles. Curr. Opin. Cell Biol 59, 140–146. 10.1016/j.ceb.2019.04.010. - DOI - PubMed
    1. Dell’Angelica EC, and Bonifacino JS (2019). Coatopathies: Genetic Disorders of Protein Coats. Annu Rev Cell Dev Biol 35, 131–168. 10.1146/annurev-cellbio-100818-125234. - DOI - PMC - PubMed

Substances

LinkOut - more resources