. 2024 Aug;300(8):107575.
doi: 10.1016/j.jbc.2024.107575. Epub 2024 Jul 14.

Phosphorylation of GCN2 by mTOR confers adaptation to conditions of hyper-mTOR activation under stress

Affiliations

Phosphorylation of GCN2 by mTOR confers adaptation to conditions of hyper-mTOR activation under stress

Odai Darawshi et al. J Biol Chem. 2024 Aug.

Abstract

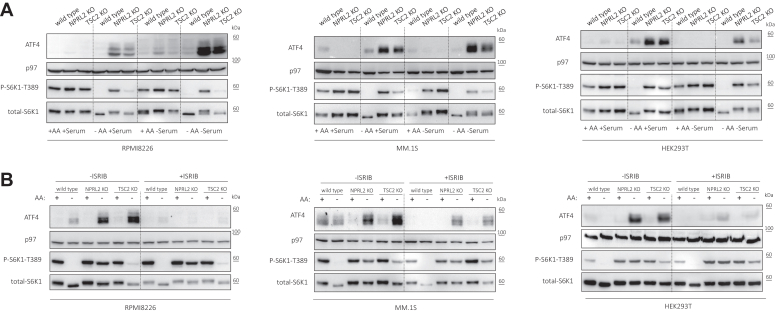
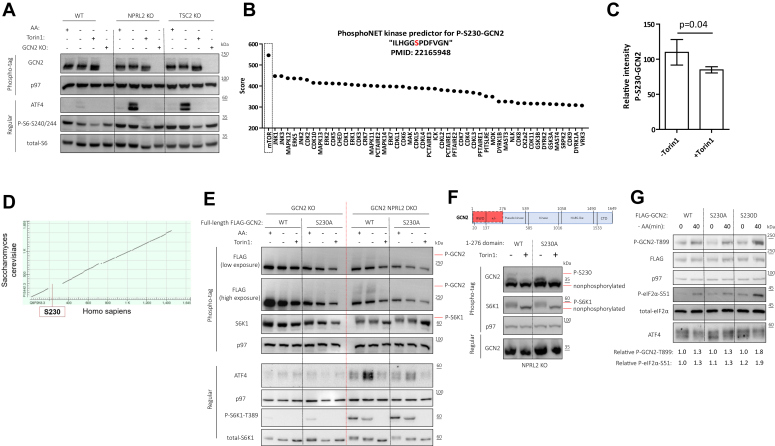
Adaptation to the shortage in free amino acids (AA) is mediated by 2 pathways, the integrated stress response (ISR) and the mechanistic target of rapamycin (mTOR). In response to reduced levels, primarily of leucine or arginine, mTOR in its complex 1 configuration (mTORC1) is suppressed leading to a decrease in translation initiation and elongation. The eIF2α kinase general control nonderepressible 2 (GCN2) is activated by uncharged tRNAs, leading to induction of the ISR in response to a broader range of AA shortage. ISR confers a reduced translation initiation, while promoting the selective synthesis of stress proteins, such as ATF4. To efficiently adapt to AA starvation, the 2 pathways are cross-regulated at multiple levels. Here we identified a new mechanism of ISR/mTORC1 crosstalk that optimizes survival under AA starvation, when mTORC1 is forced to remain active. mTORC1 activation during acute AA shortage, augmented ATF4 expression in a GCN2-dependent manner. Under these conditions, enhanced GCN2 activity was not dependent on tRNA sensing, inferring a different activation mechanism. We identified a labile physical interaction between GCN2 and mTOR that results in a phosphorylation of GCN2 on serine 230 by mTOR, which promotes GCN2 activity. When examined under prolonged AA starvation, GCN2 phosphorylation by mTOR promoted survival. Our data unveils an adaptive mechanism to AA starvation, when mTORC1 evades inhibition.

Keywords: protein docking; protein protein interactions; starvation; stress; translation regulation.


Conflict of interest statement

Conflict of interest The authors declare that they have no conflicts of interest with the contents of this article.

Figures

Figure 1
Figure 1
Genetic activation of mTORC1 enhances the ISR during acute AA starvation.A, wild-type, NPRL2 KO, and TSC2 KO of RPMI8226, MM.1S, and HEK293T cells were cultured in AA replete, or AA deplete conditions with or without dialyzed serum for 1 h, as indicated. B, wild-type, NPRL2 KO, and TSC2 KO cells of the indicated cell lines were cultured in AA replete, or AA deplete conditions and either treated with ISRIB [1 μM] or left untreated as a control. Shown are representative immunoblots of the indicated proteins, p97 immunoblots are shown as a loading control.
Figure 2
Figure 2
mTORC1 activation induces the ISR in a GCN2-dependent manner upon acute AA starvation.A, Wild-type, NPRL2 KO, and TSC2 KO cells of the indicated cell lines were cultured in AA replete, or AA deplete conditions and either treated with Torin1 [1 μM] or left untreated as a control. B, Wild-type, NPRL2 KO, and TSC2 KO cells of the indicated cell lines were cultured in AA replete, or AA deplete conditions and either treated with GCN2iB [1 μM] or left untreated as a control. C, Wild-type, NPRL2 KO, and TSC2 KO HEK293T cells were subjected to genetic deletion of GCN2 and cultured in AA replete, or AA deplete conditions for 1 h. Shown are representative immunoblots of the indicated proteins, p97 immunoblots are shown as a loading control.
Figure 3
Figure 3
mTORC1 overactivity promotes GCN2 autophosphorylation regardless of its binding ability to uncharged tRNAs or ribosomal proteins.A, Wild-type NPRL2 KO RPMI8226 cells were cultured in AA deplete medium for the indicated time points. GCN2 autophosphorylation was assessed by immunoblotting against P-GCN2-T899 and total-GCN2. mTORC1 activity was assessed by immunoblotting against P-S6K1-T389 and total-S6K1. B, human GCN2 protein domain organization scheme of full length and truncated used in (C and D). C, the indicated constructs of GCN2 were transfected into the indicated cells and their autophosphorylation on T899 was assessed as described in (A). D, HEK293T GCN2 KO cells were transfected with the indicated proteins. GCN2 and mTORC1 activities were assessed as described in (A). Shown are representative immunoblots and relative quantification of P-T899-GCN2 (to time 0).
Figure 4
Figure 4
Direct interaction between mTOR and GCN2.A and B, protein complexes were extracted in detergent-free lysis buffer following transfection of FLAG-GCN2 (A) or FLAG-mTOR (B) into HEK293T cells. Lysates were incubated with flag beads in different concentrations of the detergent IGEPAL as indicated. Shown are representative immunoblots of both flag-immunoprecipitated proteins (n = 3 for each condition, technical replicates) and their total lysates (n = 2, technical replicates) of Flag-GCN2 (A) or Flag-mTOR (B) transfected cells. C, in silico docking of the most populated cluster of tranucated-GCN2 (blue, 7QWK) with truncated-mTOR (red, 4JSV). The interacting residues were computationally identified and shown in (D). E, residues in the interface of GCN2 and mTOR were computationally mutated to alanine and change in affinity (Δaffinity) was calculated for each mutation. Among these, 3 mutants of GCN2 were experimentally prepared (F). G, the indicated mutants were transfected into HEK293T GCN2 KO cells and immunoprecipitated. Shown are representative immunoblots of both FLAG-immunoprecipitated proteins and their total lysates. Immunoglobulin heavy chain (IgH) immunoblot was used to evaluate loading quantity of FLAG-beads. The column graph represents the relative immunoprecipitation between mTOR and the different variants of FLAG-GCN2. Columns represent the percentage average ± SD.
Figure 5
Figure 5
mTOR phosphorylate GCN2atS230.A, the indicated HEK293T cell variants were cultured in AA replete, or AA deplete conditions and treated with Torin1 [1 μM] as indicated. Phospho-tag gel (12.5%) was used to evaluate the overall phosphorylation of GCN2; retarded migration of band reflects more phosphorylated protein and vice versa. B, kinase prediction ranking of the S230-GCN2 motif. C, the relative intensity of the phosphorylated S230 peptide was determined through mass spectrometry of FLAG-GCN2 immunoprecipitated from HEK293T NPRL2 KO cells that were starved from AA for 1 h and either treated with Torin1 [1 μM] or left untreated as a control. Each column represents 3 biological replicates ± SD. The p-value was calculated using a one-tailed Type II Student's t test. D, GCN2 protein alignment of Homo sapiens (human) and Saccharomyces cerevisiae (yeast), lines represent conversative sequence while gaps represent distinct sequences. S230 motif is emphasized as distinct to human. E, WT and S230A mutant of full-length FLAG-GCN2 were transfected into HEK293T GCN2 KO and GCN2 NPRL2 DKO cells. These cells were cultured in AA replete, or AA deplete conditions and treated with Torin1 [1 μM] as indicated. Shown are phospho-tag (7.5%) and regular representative immunoblots. F, the indicated domain of GCN2 was cloned and subjected to S230A mutation. Shown are phospho-tag (12.5%) and regular representative immunoblots of HEK293T NPRL2 KO cells expressing either WT or S230A of this domain and treated with Torin1 [1 μM] for 1 h or left untreated as a control. G, HEK293T GCN2 KO cells were transfected with the indicated full-length FLAG-GCN2 and cultured in the indicated conditions. Shown are representative immunoblots and relative quantification of P-GCN2-T899 and P-eIF2α-S51.
Figure 6
Figure 6
PhosphorylationatS230 mounts GCN2 activity and promotes the survival of cells in AA starved conditions.A, MIA PaCa-2 GCN2 KO cells were transduced with the indicated full-length FLAG-GCN2 and cultured in the indicated conditions. Shown are representative immunoblots and relative quantification of P-GCN2-T899 and P-eIF2α-S51. B, cell counting following transduction of MIA PaCa-2 GCN2 KO cells with the indicated full-length FLAG-GCN2. (C) Cells described in (A and B) were starved from AA for 24 h. Column graph represents the average viability of 3 independent experiments ± SD, ∗p < 0.05 of unpaired two-tailed student’s t test. ns, not significant. Flow cytometry dot plots represent the viable cells percentage following the starvation.

References

    1. Hu X., Guo F. Amino acid sensing in metabolic homeostasis and. Health Endocr. Rev. 2021;42:56–76. - PubMed
    1. Harding H.P., Zhang Y., Zeng H., Novoa I., Lu P.D., Calfon M., et al. An integrated stress response regulates amino acid metabolism and resistance to oxidative stress. Mol. Cell. 2003;11:619–633. - PubMed
    1. Lu P.D., Harding H.P., Ron D. Translation reinitiation at alternative open reading frames regulates gene expression in an integrated stress response. J. Cell Biol. 2004;167:27–33. - PMC - PubMed
    1. Jacinto E., Loewith R., Schmidt A., Lin S., Ruegg M.A., Hall A., et al. Mammalian TOR complex 2 controls the actin cytoskeleton and is rapamycin insensitive. Nat. Cell Biol. 2004;6:1122–1128. - PubMed
    1. Sarbassov D.D., Ali S.M., Kim D.H., Guertin D.A., Latek R.R., Erdjument-Bromage H., et al. Rictor, a novel binding partner of mTOR, defines a rapamycin-insensitive and raptor-independent pathway that regulates the cytoskeleton. Curr. Biol. 2004;14:1296–1302. - PubMed

MeSH terms

LinkOut - more resources