. 2024 Jul 16;15(1):5454.
doi: 10.1038/s41467-024-49837-2.

Surface properties of the seas of Titan as revealed by Cassini mission bistatic radar experiments

Affiliations

Surface properties of the seas of Titan as revealed by Cassini mission bistatic radar experiments

Valerio Poggiali et al. Nat Commun. .

Abstract

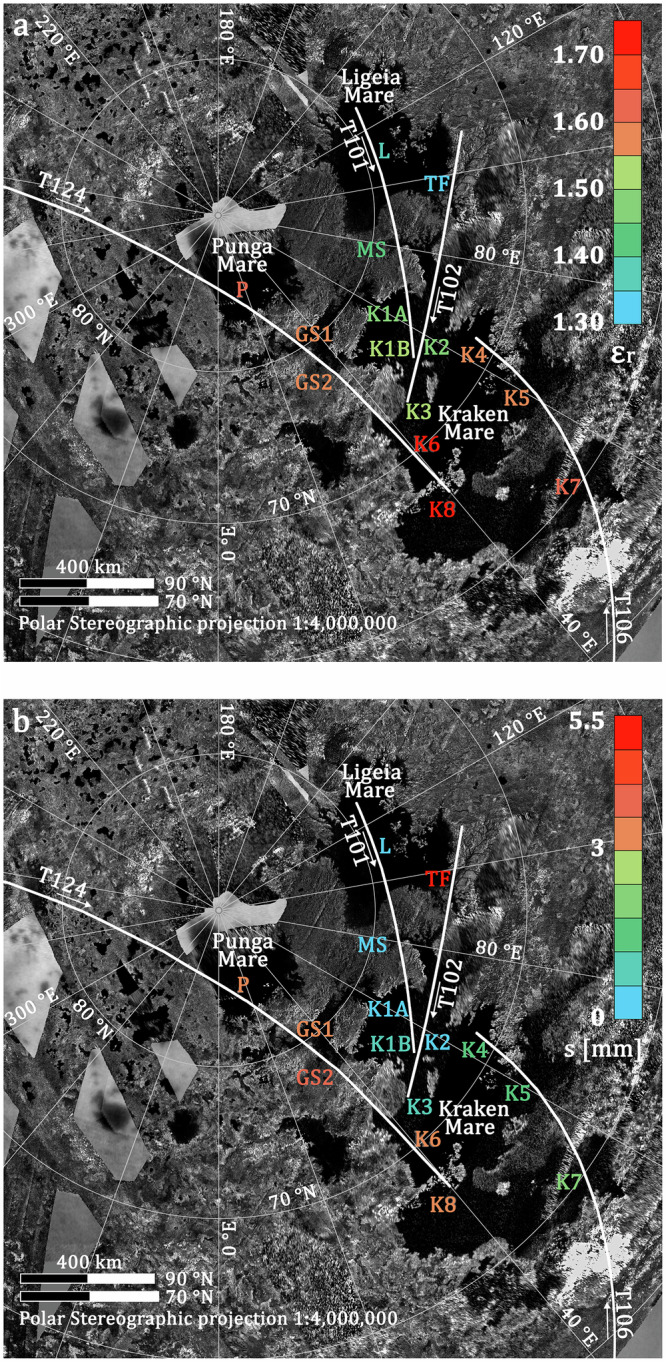
Saturn's moon Titan was explored by the Cassini spacecraft from 2004 to 2017. While Cassini revealed a lot about this Earth-like world, its radar observations could only provide limited information about Titan's liquid hydrocarbons seas Kraken, Ligeia and Punga Mare. Here, we show the results of the analysis of the Cassini mission bistatic radar experiments data of Titan's polar seas. The dual-polarized nature of bistatic radar observations allow independent estimates of effective relative dielectric constant and small-scale roughness of sea surface, which were not possible via monostatic radar data. We find statistically significant variations in effective dielectric constant (i.e., liquid composition), consistent with a latitudinal dependence in the methane-ethane mixing-ratio. The results on estuaries suggest lower values than the open seas, compatible with methane-rich rivers entering seas with higher ethane content. We estimate small-scale roughness of a few millimeters from the almost purely coherent scattering from the sea surface, hinting at the presence of capillary waves. This roughness is concentrated near estuaries and inter-basin straits, perhaps indicating active tidal currents.


Conflict of interest statement

The authors declare no competing interests.

Figures

Fig. 1
Fig. 1. Observing geometry and signal path for Cassini bistatic radar downlink experiments.
Cassini’s antenna is pointed at the predicted specular point where the angle of incidence (θi) equals the angle of reflection (θr), measured from the local vertical. Right circularly polarized (RCP) signals were transmitted, and at least one of the NASA Deep Space Network (DSN) antennas on Earth captured the echo. At the surface of Titan, a left circularly polarized (LCP) component of the echo signal was generated, requiring the presence on the ground of two receiving channels. Complex samples of each receiver output were collected at 16,000 samples/s and stored for later processing. The purpose of this figure is to illustrate the geometry of the observations and distances on the coordinate axes that are not drawn to scale.
Fig. 2
Fig. 2. Specular point tracks of the bistatic observations during experiments T101, T102, T106, T124.
Tracks are plotted on a RADAR/ISS basemap mosaic showing the Titan’s three large polar liquid hydrocarbon seas, Kraken Mare (60–80 °N, 30–80 °E), Ligeia Mare (75–83 °N, 80–140 °E), and Punga Mare (83–87 °N, 0–60 °E). Labels indicate those areas where the surface’s effective a average relative dielectric constant (εr) and b small-scale rms height (s) roughness have been measured and are color-coded with the retrieved values (see Results section and the Source data that are provided as a Source Data file).
Fig. 3
Fig. 3. Four calibrated spectra from the three seas of Titan acquired during T101, T106, and T124 observations.
A powerful specular reflection is clearly visible for all of them in both the RCP and LCP polarizations. These echoes have been obtained by integrating roughly 60 s of observation time. a Echoes from Ligeia Mare; note how the RCP component dominates over the LCP because the incidence angle here is higher than the Brewster angle (i.e., θB ≅ 52° at εr = 1.6); inset: radar map of Ligeia Mare with the location of specular reflection (white dot mark) at 115.73 °E, 79.2 °N; b Echoes from north Kraken Mare; inset: radar map of north Kraken Mare with the location of specular reflection (white dot mark) at 62.98 °E, 76.27 °N; c Echoes from south Kraken Mare; note how the similarity in magnitude between LCP and RCP components is consistent with the vicinity of the incidence angle to the Brewster angle; inset: radar map of north south Kraken Mare with the location of specular reflection (white dot mark) at 54.51 °E, 60.1 °N; d Echoes from Punga Mare; note the increase of noise level due to a rain event happening at Canberra during the T124 observation of Punga Mare (see Method section for more details); inset: radar map of Punga Mare with the location of specular reflection (white dot mark) at 14.49 °E, 84.25 °N. All values indicated in the figure and in this caption are given at the midpoint of a 60 s integration interval.

References

    1. Lopes RMC, et al. Space Sci. Rev. 2019;215:33. doi: 10.1007/s11214-019-0598-6. - DOI
    1. Stofan ER, et al. The lakes of Titan. Nature. 2007;445:61. doi: 10.1038/nature05438. - DOI - PubMed
    1. Hayes AG. The lakes and seas of Titan. Annu. Rev. Earth Planet. Sci. 2016;44:57–83. doi: 10.1146/annurev-earth-060115-012247. - DOI
    1. Hayes AG, Lorenz RD, Lunine JI. A post-Cassini view of Titan’s methane-based hydrologic cycle. Nat. Geosci. 2018;11:306–313. doi: 10.1038/s41561-018-0103-y. - DOI
    1. Mitchell JL, Lora JM. The climate of Titan. Annu. Rev. Earth Planet. Sci. 2016;44:353–380. doi: 10.1146/annurev-earth-060115-012428. - DOI

LinkOut - more resources