. 2024 Jul 16;15(7):507.
doi: 10.1038/s41419-024-06834-z.

Myeloid-derived suppressor cells-induced exhaustion of CD8 + T-cell participates in rejection after liver transplantation

Affiliations

Myeloid-derived suppressor cells-induced exhaustion of CD8 + T-cell participates in rejection after liver transplantation

Liu-Xin Zhou et al. Cell Death Dis. .

Abstract

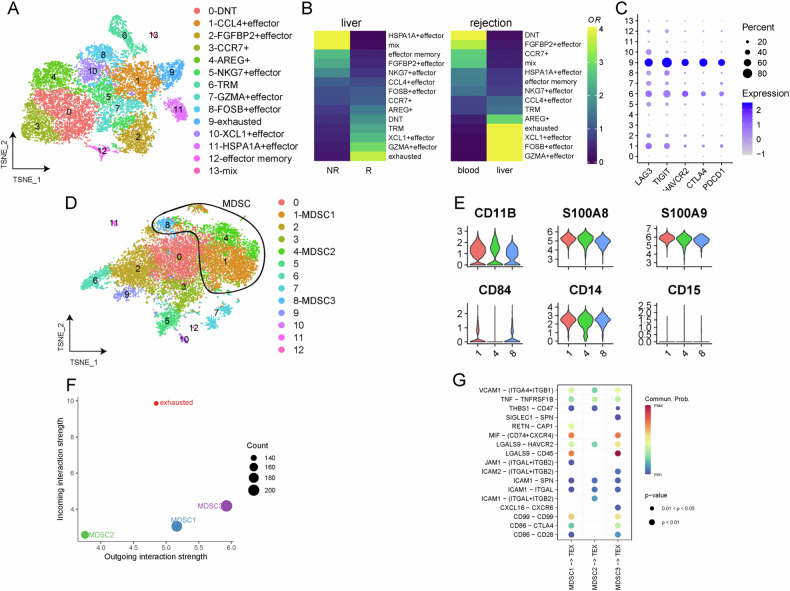
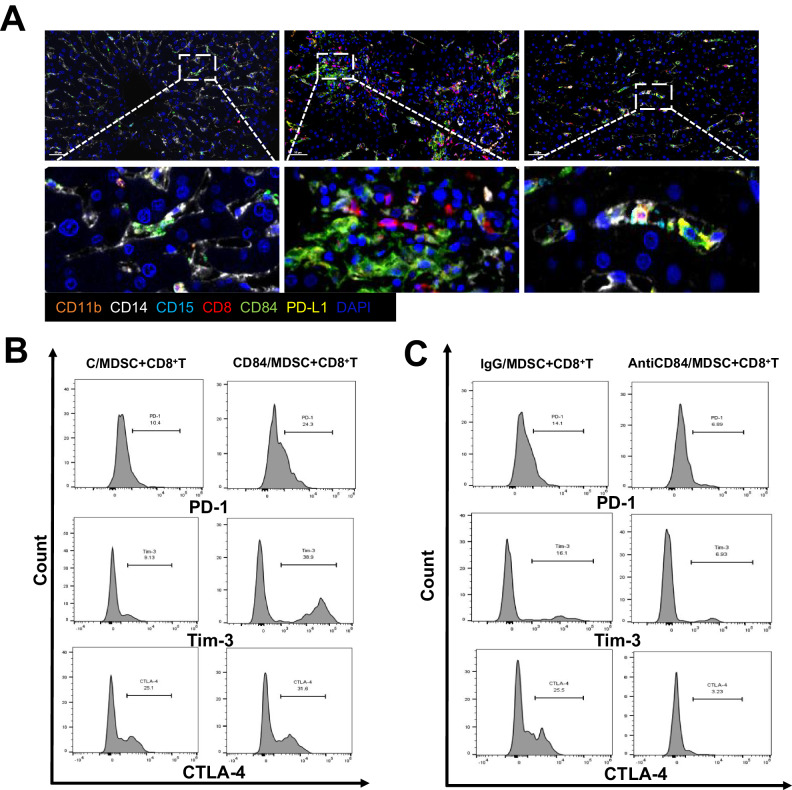
Liver transplantation (LT) rejection remains the most pervasive problem associated with this procedure, while the mechanism involved is still complicated and undefined. One promising solution may involve the use of myeloid-derived suppressor cells (MDSC). However, the immunological mechanisms underlying the effects of MDSC after LT remain unclear. This study is meant to clarify the role MDSCs play after liver transplantation. In this study, we collected liver tissue and peripheral blood mononuclear cells (PBMC) from LT patients showing varying degrees of rejection, as well as liver and spleen tissue samples from mice LT models. These samples were then analyzed using flow cytometry, immunohistochemistry and multiple immunofluorescence. M-MDSCs and CD8 + T-cells extracted from C57/BL6 mice were enriched and cocultured for in vitro experiments. Results, as obtained in both LT patients and LT mice model, revealed that the proportion and frequency of M-MDSC and PD-1 + T-cells increased significantly under conditions associated with a high degree of LT rejection. Within the LT rejection group, our immunofluorescence results showed that a close spatial contiguity was present between PD-1 + T-cells and M-MDSCs in these liver tissue samples and the proportion of CD84/PD-L1 double-positive M-MDSC was greater than that of G-MDSC. There was a positive correlation between the activity of CD84 and immunosuppressive function of M-MDSCs including PD-L1 expression and reactive oxygen species (ROS) production, as demonstrated in our in vitro model. M-MDSCs treated with CD84 protein were able to induce co-cultured CD8 + T-cells to express high levels of exhaustion markers. We found that CD84 regulated M-MDSC function via expression of PD-L1 through activation of the Akt/Stat3 pathway. These results suggest that the capacity for CD84 to regulate M-MDSC induction of CD8 + T-cell exhaustion may play a key role in LT rejection. Such findings provide important, new insights into the mechanisms of tolerance induction in LT.


Conflict of interest statement

The authors declare no competing interests.

Figures

Fig. 1
Fig. 1. Single-cell sequencing of patients after liver transplantation.
A T cells were divided into 14 clusters, of which cluster 9 represents exhausted T cells. B Left: In liver tissue, exhausted T cells are more likely to be present in rejected samples than in non-rejected samples; Right: in rejected samples, exhausted T cells are more likely to be present in liver samples than in blood. C Exhausted marker genes LAG3, TIGIT, HAVCR2, CTLA4 and PDCD1 were highly expressed in cluster 9 cells. D Myeloid cells were divided into 13 clusters, of which cluster1, 4 and 8 were MDSCs. E The expression levels of CD11b, S100A8, S100A9, CD84, CD14 and CD15 in the 3 clusters of MDSCs. F The intercellular communication signal results showed that cluster 1 and 3 MDSCs had stronger output signals, and the exhausted T cells received the strongest signal. G The ligand-receptor pairs of 3 groups of MDSCs interacting with exhausted T cells.
Fig. 2
Fig. 2. Dynamic changes in phenotypes and distributions of MDSC and cytokines in normal, non-rejected and rejected patients.
A Proportion of different types of MDSC in PBMC from LT patients. B The percentages of M-MDSC and G-MDSC in PBMC from LT patients. C Serum cytokine levels (IL-2, IL-10, TGF-β1, IFN-γ and Arg-1) in LT patients. D HE staining of liver demonstrating histopathological changes within different groups (200×). E Comparisons of infiltration levels of CD14+ and CD15+ cells in liver tissues (200×). F The distribution of MDSC in liver tissues was detected by multiple immunofluorescent analysis. Fixed and paraffin-embedded tissue sections were labeled against CD11b (orange), CD15 (green), CD14 (white), and DAPI (blue). Scale bar, 50 μm; N normal, R rejected group, NR non-rejected group; **P < 0.01, ***P < 0.001.
Fig. 3
Fig. 3. Dynamic changes of MDSC in the mouse liver transplantation model.
A For the mouse liver transplantation (LT) model, male C57BL/6 J mice served as donors and male C3H mice as recipients. B HE staining of liver tissues showed that the infiltrations of immune cells were most significant in LT-1W group (400×). C Serum ALT and AST levels at different timepoints post-LT. D Serum IL-1β and IL-4 levels at different timepoints post-LT. E In spleen, the percentage of M-MDSC peaked at LT-1W and gradually decreased, while that of G-MDSC continued to increase from week 1 to 2 after LT. F In liver, the proportion of both M-MDSC and G-MDSC gradually increased from week 1 to 2 after LT determined using flow cytometry. C control group, LT-1W post-transplant 1 week group, LT-2W post-transplant 2 weeks group. *P < 0.05, ***P < 0.001.
Fig. 4
Fig. 4. Changes in T cells after liver transplantation.
A Immunohistochemistry results of infiltrated CD4+ and CD8 + T-cells following LT indicated that massive amounts of T cells were observed in rejected liver tissues (400×). B Distribution of CD4+ (red), CD8+ (cyan) and FOXP3+ (green) cells in liver tissues were determined using multiple immunofluorescence (Scale bar, 50 μm). C Dynamic changes of PD-1 + CD8 + T cells in PBMC of LT recipients were determined using cytometric analysis. D Distributions of PD-1+ cells in liver tissues of LT patients were determined using immunohistochemistry (400×). E Expressions and distributions of PD-1+ (red) and CD8+ (green) cells in liver tissues of LT patients were determined using immunofluorescence (Scale bar, 50 μm). F Expressions and distributions of PD-1 and CD8+ cells in liver and spleen tissues of the mouse LT model were determined using immunohistochemistry (400×). Dynamic changes of PD-1 + CD8 + T cells in mice spleen (G) and liver grafts (H) were determined using cytometric analysis. N normal, R rejected group, NR non-rejected group, C control group, LT-1W post-transplant 1 week group, LT-2W post-transplant 2 weeks group.
Fig. 5
Fig. 5. Spatial relationships between CD8 + T cells and different phenotypes of MDSC in different groups.
A Distribution of MDSC and CD8 + T cells in liver tissues of LT patients were determined using multiple immunofluorescence. Fixed and paraffin-embedded tissue sections were labeled against CD11b (green), CD8 (red), CD15 (cyan), CD14 (white), and DAPI (blue). Scale bar, 50 μm. B The spatial relationships between MDSC and CD8 + T cells in different groups were determined based on their labeling (CD11b + CD14+ for M-MDSCs; CD11b + CD15+ for G-MDSCs). N normal, R rejected group, NR non-rejected group.
Fig. 6
Fig. 6. Relationships between CD84 and PD-L1 after liver transplantation.
mRNA levels of CD84 (A) and PD-L1 (B) in liver grafts of mice were determined using qRT-PCR. C Expressions and distributions of CD84 + , PD-L1+ and S100a8 + S100a9+ cells in mice liver grafts were determined using immunohistochemistry (400×). D Flow cytometry analysis showed the numbers of CD84+ gated in M-MDSC were greater than in G-MDSC in mice liver grafts. E Expressions and distributions of CD84 + , S100a8 + S100a9+ and PD-L1+ cells in LT patients were determined using immunohistochemistry (400×). F Expressions and distributions of CD84+ and PD-L1+ cells in LT patients were determined using immunofluorescent staining. Fixed and paraffin-embedded liver tissue sections were labeled against CD84 (green), PD-L1 (red) and DAPI (blue). Scale bar, 50 μm. N normal, R rejected group, NR non-rejected group, C control group, LT-1W post-transplant 1 week group, LT-2W post-transplant 2 weeks group, *P < 0.05; ***P < 0.001.
Fig. 7
Fig. 7. CD84 activates the Stat3 pathway to promote M-MDSC immunosuppression in vitro.
Relative mRNA levels of PD-L1 (A), IL-10 (B) and Arg-1 (C) in M-MDSC treated with CD84 siRNA and control group. D Flow cytometry analysis showed the expressions of PD-L1 in M-MDSCs after treated with CD84 siRNA. E The expressions of PD-L1 in M-MDSCs after treated with CD84 protein. F The expressions of PD-L1 in M-MDSCs after treated with anti-CD84 protein; The levels of Arg-1 in supernate of M-MDSC treated with CD84 protein (G) and anti-CD84 protein (H) were detected by ELISA. Changes in ROS production in M-MDSC treated with CD84 protein (I) and anti-CD84 protein (J) were determined using flow cytometry. K Western blot determinations of the Stat3 pathway (Akt, P-Akt, Stat3, P-Stat3, S100a8 + S100a9 and PD-L1) protein levels in M-MDSC treated with CD84 and anti-CD84 protein. L After treatment with the Stat-3 inhibitor, NSC 74859 (MCE, USA), the mRNA levels of PD-L1 in bone marrow-derived and induced cells was decreased; The proportion of MDSC (M) and the amount of PD-L1 + MDSC (N) were both decreased when treated with the Stat-3 inhibitor than DMSO group. *P < 0.05; **P < 0.01; ***P < 0.001.
Fig. 8
Fig. 8. CD84 is crucial for M-MDSC-induced CD8 + T cell exhaustion.
A Spatial relationships between CD84 + PD-L1+MDSCs and CD8 + T cells were measured by multiple immunofluorescent staining. Fixed and paraffin-embedded liver tissues were labeled against CD11b (orange), CD14 (white), CD15 (cyan), CD8 (red), CD84 (green), PD-L1 (yellow) and DAPI (blue). Scale bar, 50 μm. B The flow cytometry analysis revealed the changes of exhaustion markers in CD8 + T cell co-cultured with M-MDSC treated with CD84 protein and control group. C The changes of exhaustion markers in CD8 + T cell co-cultured with M-MDSC treated with anti-CD84 protein and control group. N normal, R rejected group, NR non-rejected group, C control group.

References

    1. Lake JR. Clinical frontiers in liver transplantation. Liver Transpl. 2014;20:S1–S1. doi: 10.1002/lt.24025. - DOI - PubMed
    1. Butt Z, Parikh ND, Skaro AI, Ladner D, Cella D. Quality of life, risk assessment, and safety research in liver transplantation: new frontiers in health services and outcomes research. Curr Opin Organ Transpl. 2012;17:241–7. doi: 10.1097/MOT.0b013e32835365c6. - DOI - PMC - PubMed
    1. Lee-Riddle GS, Rocca JP. Low-dose aspirin, rejection, and thrombosis: is it the wonder drug® of liver transplantation? Liver Transpl Publ Am Assoc Study Liver Dis Int Liver Transpl Soc. 2022;28:1825–6. - PubMed
    1. Li X, Li S, Wu B, Xu Q, Teng D, Yang T, et al. Landscape of immune cells heterogeneity in liver transplantation by single-cell RNA sequencing analysis. Front Immunol. 2022;13:890019. doi: 10.3389/fimmu.2022.890019. - DOI - PMC - PubMed
    1. Neil DAH, Hübscher SG. Current views on rejection pathology in liver transplantation. Transpl Int J Eur Soc Organ Transpl. 2010;23:971–83. doi: 10.1111/j.1432-2277.2010.01143.x. - DOI - PubMed

Substances