. 2024 Jul 17;15(1):5996.
doi: 10.1038/s41467-024-50267-3.

Neurostructural subgroup in 4291 individuals with schizophrenia identified using the subtype and stage inference algorithm

Yuchao Jiang  1   2 Cheng Luo  3   4   5 Jijun Wang  6 Lena Palaniyappan  7 Xiao Chang  1   2 Shitong Xiang  1   2 Jie Zhang  1   2 Mingjun Duan  3 Huan Huang  3 Christian Gaser  8   9   10 Kiyotaka Nemoto  11 Kenichiro Miura  12 Ryota Hashimoto  12 Lars T Westlye  13   14   15 Genevieve Richard  13   14   15 Sara Fernandez-Cabello  13   14   15 Nadine Parker  14 Ole A Andreassen  14 Tilo Kircher  16 Igor Nenadić  16 Frederike Stein  16 Florian Thomas-Odenthal  16 Lea Teutenberg  16 Paula Usemann  16 Udo Dannlowski  17 Tim Hahn  17 Dominik Grotegerd  17 Susanne Meinert  17   18 Rebekka Lencer  17   19   20 Yingying Tang  6 Tianhong Zhang  6 Chunbo Li  6 Weihua Yue  21   22   23 Yuyanan Zhang  21 Xin Yu  21 Enpeng Zhou  21 Ching-Po Lin  24 Shih-Jen Tsai  25 Amanda L Rodrigue  26 David Glahn  26 Godfrey Pearlson  27 John Blangero  28 Andriana Karuk  29   30 Edith Pomarol-Clotet  29   30 Raymond Salvador  29   30 Paola Fuentes-Claramonte  29   30 María Ángeles Garcia-León  29   30 Gianfranco Spalletta  31 Fabrizio Piras  31 Daniela Vecchio  31 Nerisa Banaj  31 Jingliang Cheng  32 Zhening Liu  33 Jie Yang  33 Ali Saffet Gonul  34 Ozgul Uslu  35 Birce Begum Burhanoglu  35 Aslihan Uyar Demir  34 Kelly Rootes-Murdy  36 Vince D Calhoun  36 Kang Sim  37   38   39 Melissa Green  40 Yann Quidé  41 Young Chul Chung  42   43   44 Woo-Sung Kim  42   44 Scott R Sponheim  45   46   47 Caroline Demro  46 Ian S Ramsay  46 Felice Iasevoli  48 Andrea de Bartolomeis  48 Annarita Barone  48 Mariateresa Ciccarelli  48 Arturo Brunetti  49 Sirio Cocozza  49 Giuseppe Pontillo  49 Mario Tranfa  49 Min Tae M Park  50   51 Matthias Kirschner  52   53 Foivos Georgiadis  53 Stefan Kaiser  52 Tamsyn E Van Rheenen  54   55 Susan L Rossell  55 Matthew Hughes  55 William Woods  55 Sean P Carruthers  55 Philip Sumner  55 Elysha Ringin  56 Filip Spaniel  56 Antonin Skoch  56   57 David Tomecek  56   58   59 Philipp Homan  60   61 Stephanie Homan  62   63 Wolfgang Omlor  60 Giacomo Cecere  60 Dana D Nguyen  64 Adrian Preda  65 Sophia I Thomopoulos  66 Neda Jahanshad  66 Long-Biao Cui  67 Dezhong Yao  3   4   5 Paul M Thompson  66 Jessica A Turner  68 Theo G M van Erp  69   70 Wei Cheng  1   2   71   72   73 ENIGMA Schizophrenia ConsortiumJianfeng Feng  74   75   76   77   78   79   80 ZIB Consortium
Collaborators, Affiliations

Neurostructural subgroup in 4291 individuals with schizophrenia identified using the subtype and stage inference algorithm

Yuchao Jiang et al. Nat Commun. .

Abstract

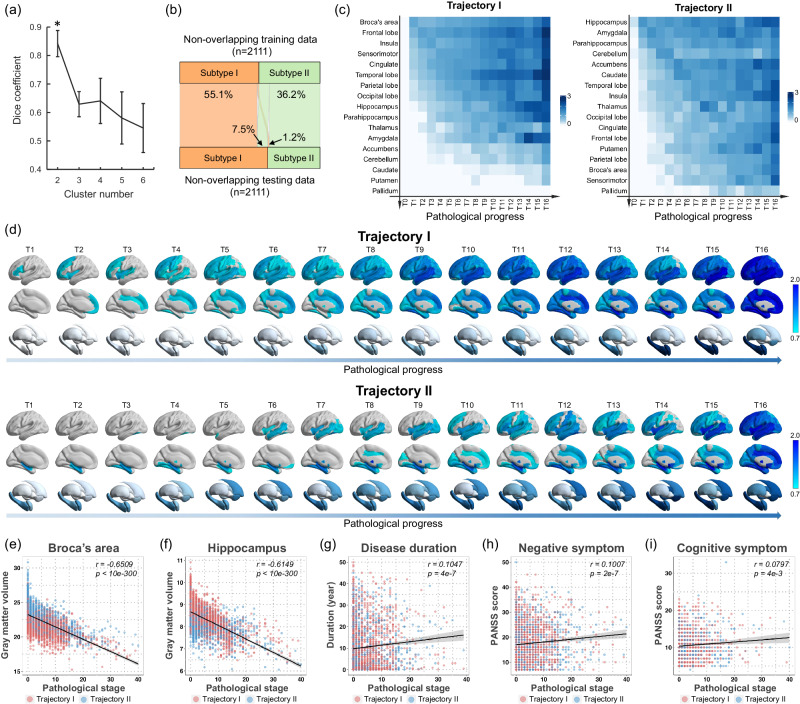
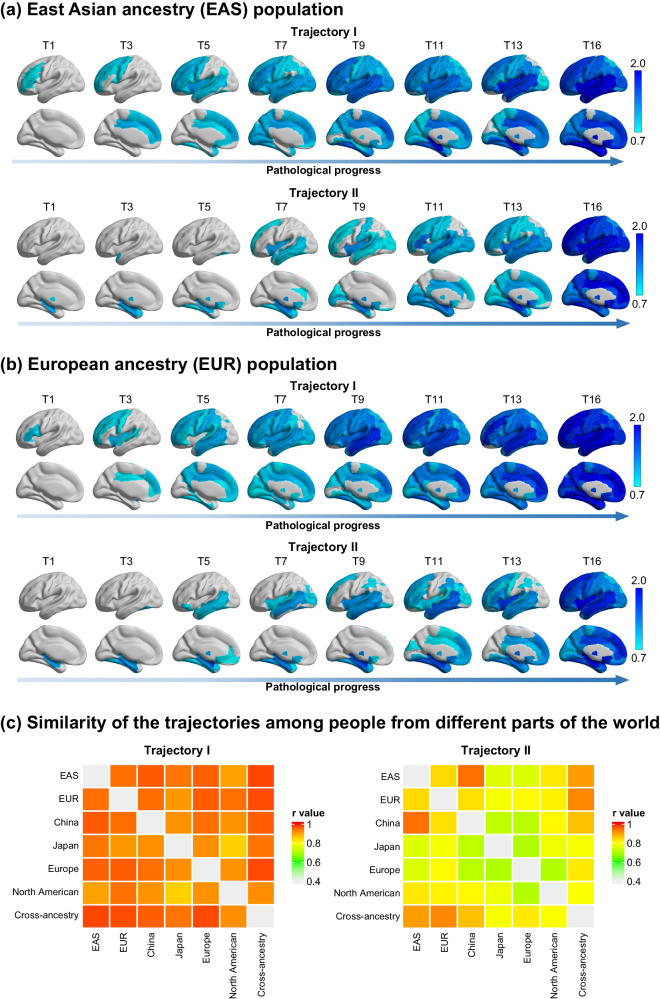
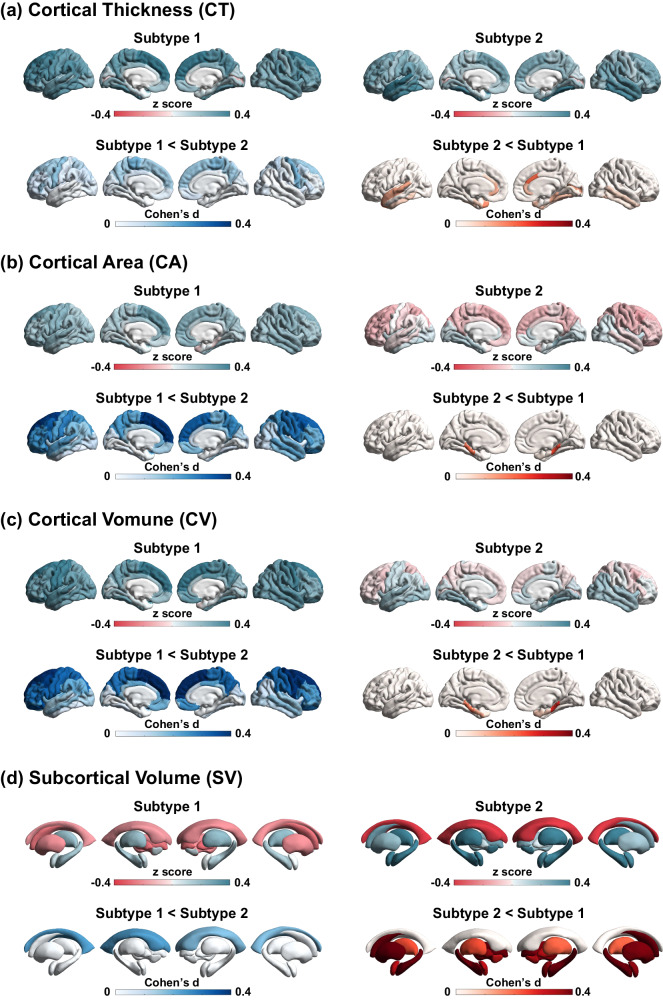
Machine learning can be used to define subtypes of psychiatric conditions based on shared biological foundations of mental disorders. Here we analyzed cross-sectional brain images from 4,222 individuals with schizophrenia and 7038 healthy subjects pooled across 41 international cohorts from the ENIGMA, non-ENIGMA cohorts and public datasets. Using the Subtype and Stage Inference (SuStaIn) algorithm, we identify two distinct neurostructural subgroups by mapping the spatial and temporal 'trajectory' of gray matter change in schizophrenia. Subgroup 1 was characterized by an early cortical-predominant loss with enlarged striatum, whereas subgroup 2 displayed an early subcortical-predominant loss in the hippocampus, striatum and other subcortical regions. We confirmed the reproducibility of the two neurostructural subtypes across various sample sites, including Europe, North America and East Asia. This imaging-based taxonomy holds the potential to identify individuals with shared neurobiological attributes, thereby suggesting the viability of redefining existing disorder constructs based on biological factors.


Conflict of interest statement

LP reports personal fees from Janssen Canada, Otsuka Canada, SPMM Course Limited UK and the Canadian Psychiatric Association; book royalties from Oxford University Press; and investigator-initiated educational grants from Sunovion, Janssen Canada and Otsuka Canada, outside the submitted work. TK received unrestricted educational grants from Servier, Janssen, Recordati, Aristo, Otsuka, neuraxpharm. PH has received grants and honoraria from Novartis, Lundbeck, Mepha, Janssen, Boehringer Ingelheim, Neurolite outside of this work. OAA is a consultant to Cortechs.ai and received speakers honorarium from Lundbeck, Janssen, Sunovion. Other authors disclose no conflict of interest.

Figures

Fig. 1
Fig. 1. Two pathophysiological progression trajectories in schizophrenia.
a Dice coefficient indicates that K = 2 is the optimal number (marked by asterisk) of subtypes with best consistency of the subtype labeling between two independent schizophrenia populations using non-overlap 2-folds cross-validation procedure. This procedure was repeated ten times (n = 10) to avoid the occasionality of one split. Data are presented as median values +/- standard deviation (SD). b The proportion of individuals whose subtype labels keep consistent by a non-overlap cross-validation procedure. c Sequences of regional volume loss across seventeen brain regions for each ‘trajectory’ via SuStaIn are shown in y-axis. The heatmap shows regional volume loss in which biomarker (y-axis) in a particular ‘temporal’ stage (T0-T16) in the ‘trajectory’ (x-axis). The Color bar represents the degree of gray matter volume (GMV) loss in schizophrenia relative to healthy controls (i.e., z score). d Spatiotemporal pattern of pathophysiological ‘trajectory’. The z-score images are mapped to a glass brain template for visualization. The spatiotemporal pattern of gray matter loss displays a progressive pattern of spatial extension along with later ‘temporal’ stages of pathological progression that are distinct between trajectories. ef Pathological stages of SuStaIn are correlated with reduced gray matter volume of Broca’s area and hippocampus. gi Pathological stages of SuStaIn are correlated with longer disease duration, worse negative symptoms and worse cognitive symptoms. Spearman correlation test is conducted for data analysis in figures (ei). Two-sided p value is reported after multiple comparisons correction by FDR. The error bands in figures (ei) represent 95% confidence interval. n = 4222 biologically independent samples in figures (ef). n = 2333 biologically independent samples in figure (g). n = 2651 biologically independent samples in figure (h). n = 1322 biologically independent samples in figure (i).
Fig. 2
Fig. 2. Trajectories are reproducibility for samples from different locations of the world.
Two sets of ‘trajectories’ are separately derived from two non-overlapping location cohorts, that are (a) East Asian ancestry (EAS) cohort, and (b) European ancestry (EUR) cohort. The Color bar represents the degree of gray matter volume (GMV) loss in schizophrenia relative to healthy controls (i.e., z-score). c The similarity of the spatiotemporal pattern of each ‘trajectory’ between any two of cohorts is shown by the heatmap. The color bar of the heatmap represents the similarity, which is quantified via the Spearman correlation coefficient between the trajectories from two cohorts. A total of six location cohorts are classified by where the sample locate at, including the EAS, EUR, China, Japan, Europe and North American. The whole sample is labeled as a cross-ancestry cohort.
Fig. 3
Fig. 3. Subtype-specific signatures in neuroanatomical pathology.
Brain morphological measures include (a) cortical thickness, (b) cortical surface area, (c) cortical volume, and (d) subcortical volume. For each morphological measure, regional z-scores (i.e., normative deviations from healthy control group) in each subtype are mapped to a brain template for visualization. Effect size of inter-subtype difference is quantified using Cohen’s d.
Fig. 4
Fig. 4. Symptomatic trajectories across three stages of disease duration.
Individuals of each subtype are divided into three subgroups according to their illness durations (early stage: ≤2 years; middle stage: 2−10 years; late stage: >10 years). Two sample t test was performed to compare the inter-subtype difference separately within each of the stages after regressing out the effects of age, sex and SuStaIn stage. * two-sided p < 0.05, uncorrected. At the late stage, subtype 1 exhibited worse positive symptom (t = 2.9, p = 0.003), general psychopathology (t = 2.5, p = 0.010) and worse depression/anxiety (t = 2.1, p = 0.033) compared to subtype 2. Data are presented as mean values +/- standard error (se). n = 579 (347), 362 (216), and 400 (282) biologically independent samples in the early stage, middle stage and late stage in subtype 1 (subtype 2) for positive, negative and general subscales. n = 377 (220), 144 (86), and 166 (109) biologically independent samples in the early stage, middle stage and late stage in subtype 1 (subtype 2) for depression & anxiety, cognitive dimension and excitement dimension.

References

    1. Organization W. H. The Global Burden Of Disease: 2004 Update. (World Health Organization, 2008).
    1. Howes OD, Onwordi EC. The synaptic hypothesis of schizophrenia version III: a master mechanism. Mol. Psychiatry. 2023;28:1843–1856. doi: 10.1038/s41380-023-02043-w. - DOI - PMC - PubMed
    1. McCutcheon RA, Krystal JH, Howes OD. Dopamine and glutamate in schizophrenia: biology, symptoms and treatment. World Psychiatry. 2020;19:15–33. doi: 10.1002/wps.20693. - DOI - PMC - PubMed
    1. Wolfers T, et al. Mapping the heterogeneous phenotype of schizophrenia and bipolar disorder using normative models. JAMA Psychiatry. 2018;75:1146–1155. doi: 10.1001/jamapsychiatry.2018.2467. - DOI - PMC - PubMed
    1. Fusar-Poli P, et al. Heterogeneity of psychosis risk within individuals at clinical high risk: a meta-analytical stratification. JAMA Psychiatry. 2016;73:113–120. doi: 10.1001/jamapsychiatry.2015.2324. - DOI - PubMed

MeSH terms