. 2024 Jul 16;15(1):5985.
doi: 10.1038/s41467-024-50036-2.

Aging aggravates aortic aneurysm and dissection via miR-1204-MYLK signaling axis in mice

Affiliations

Aging aggravates aortic aneurysm and dissection via miR-1204-MYLK signaling axis in mice

Ze-Long Liu et al. Nat Commun. .

Abstract

The mechanism by which aging induces aortic aneurysm and dissection (AAD) remains unclear. A total of 430 participants were recruited for the screening of differentially expressed plasma microRNAs (miRNAs). We found that miR-1204 is significantly increased in both the plasma and aorta of elder patients with AAD and is positively correlated with age. Cell senescence induces the expression of miR-1204 through p53 interaction with plasmacytoma variant translocation 1, and miR-1204 induces vascular smooth muscle cell (VSMC) senescence to form a positive feedback loop. Furthermore, miR-1204 aggravates angiotensin II-induced AAD formation, and inhibition of miR-1204 attenuates β-aminopropionitrile monofumarate-induced AAD development in mice. Mechanistically, miR-1204 directly targets myosin light chain kinase (MYLK), leading to the acquisition of a senescence-associated secretory phenotype (SASP) by VSMCs and loss of their contractile phenotype. MYLK overexpression reverses miR-1204-induced VSMC senescence, SASP and contractile phenotypic changes, and the decrease of transforming growth factor-β signaling pathway. Our findings suggest that aging aggravates AAD via the miR-1204-MYLK signaling axis.


Conflict of interest statement

The authors declare no competing interests.

Figures

Fig. 1
Fig. 1. miR-1204 is upregulated with aging in patients with aortic aneurysm and dissection (AAD).
A miRNA-selective strategies in plasma samples. B Venn diagram showing common miRNAs in older adults and patient datasets. C Plasma miR-1204 expression was determined by real-time quantitative reverse transcription-polymerase chain reaction (qRT-PCR) in the indicated groups. n = 70 (young normal), n = 88 (elder normal), n = 116 (young patient), and n = 156 (elder patient). Statistical analysis was performed using Kruskal–Wallis test with Dunn’s multiple comparison test. D Correlation between miR-1204 expression in the plasma and age of patients with AAD. n = 272. Statistical analysis was performed using two-tailed Spearman’s correlation test. E Differences in plasma miR-1204 expression between patients with thoracic aortic aneurysm and dissection (TAAD) and those with abdominal aortic aneurysm (AAA) were determined using qRT-PCR. n = 108 (young patients with TAAD), n = 8 (young patients with AAA), n = 101 (elder patients with TAAD), and n = 55 (elder patients with AAA). Statistical analysis was performed using two-tailed Mann–Whitney U test. F Expression of several differentially expressed miRNAs (identified in panel B) in aortic samples from healthy participants and patients with AAD were determined using qRT-PCR. n = 6 except for hsa-miR-376b-5p in elder patient group, n = 5 for hsa-miR-376b-5p in elder patient group. Statistical analysis was performed using two-tailed Student’s t test with Welch’s correction. G Representative images (left) and quantification (right) of miR-1204 in the aortas of healthy participants and patients with AAD detected by in situ hybridization staining. n = 8 (young normal), n = 8 (elder normal), n = 10 (young patient), n = 10 (elder patient). Statistical analysis was performed using two-tailed Welch’s ANOVA followed by Dunn’s multiple comparison test. Scale bar indicates 100 μm. Data are presented as mean ± SD. ns not significant. Source data are provided as a source data file.
Fig. 2
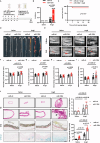
Fig. 2. miR-1204 aggravates angiotensin II (AngII) induced aortic aneurysm and dissection (AAD) formation.
A Scheme of AngII-induced AAD experiments. MiR-1204 agomir or miR-control (miR-ctl) (10 nmol) was administered to 4-month-old male C57BL/6 mice by tail vein injection every 3 d for a total of five times before 4-week AngII-infusion. B AAD incidence. AA aortic aneurysm, AD aortic dissection. Statistical analysis was performed using two-tailed Fisher’s exact test. C Kaplan–Meier curves of survival in the indicated groups. Statistical analysis was performed using log-rank test. D Representative photographs of aortas in the indicated groups. Bar indicates 4 mm. E Representative B-mode ultrasound and doppler ultrasound (DUS) detection of abdominal aortas. The white arrow indicates an aneurysm. FI Quantification of ascending aorta, aortic arch, descending aorta and abdominal aorta diameters using ultrasound. n = 17 biological replicates for miR-1204 + AngII group. n = 19 biological replicates for other groups. Statistical analysis was performed using a one-way ANOVA followed by Tukey’s multiple comparison test. J Representative images of hematoxylin & eosin (H&E) staining of the abdominal aortas. The black arrow indicates an intimal tear. Upper bar indicates 400 μm. Lower bar indicates 100 μm. Representative images of elastic van Gieson (EVG) staining (left) and elastin degradation grade (right) in the abdominal aorta. n = 17 biological replicates for miR-1204 + AngII group. n = 19 biological replicates for other groups. Statistical analysis was performed using the Kruskal–Wallis test with Dunn’s multiple comparisons test. Scale bar, 100 μm. Representative images of senescence-associated-β-galactosidase (SA-β-gal) staining (left) and quantification of SA-β-gal activity area (right) in the abdominal aorta. n = 17 biological replicates for miR-1204 + AngII group. n = 19 biological replicates for other groups. Statistical analysis was performed using two-tailed Welch’s ANOVA followed by Dunn’s multiple comparison test. Scale bar indicates 50 μm. Data are presented as mean ± SD. Source data are provided as a source data file.
Fig. 3
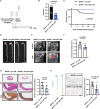
Fig. 3. Inhibition of miR-1204 ameliorates β-aminopropionitrile monofumarate (BAPN)-induced aortic aneurysm and dissection (AAD) formation.
A Scheme of BAPN-induced AAD experiments. LNA anti-miR-1204 or LNA scramble-miR (LNAscr-miR) were administered (10 mg/kg) via tail vein injection to 3-week-old male C57BL/6 mice prior to administration of 1 g/kg/day BAPN in drinking water for four weeks. B AAD incidence. AD: aortic dissection. Statistical analysis was performed using two-tailed Fisher’s exact test. C Kaplan–Meier curves of survival in the indicated groups. Statistical analysis was performed using log-rank test. D Representative photographs of aortas in the indicated groups. Scale bar represents 4 mm. E Representative B-mode ultrasound and doppler ultrasound (DUS) detection of the aortic arch. The white arrow indicates an aneurysm. F Quantification of aortic arch diameters measured by ultrasound. n = 15 biological replicates for BAPN + scr-miR group. n = 20 biological replicates for BAPN + anti-miR-1204. Statistical analysis was performed using two-tailed Student’s t test. G Representative images of hematoxylin & eosin (H&E) staining of the aortic arch. The black arrow indicates an intimal tear. Upper scale bar, 400 μm. Lower scale bar, 100 µm. Representative images of elastic van Gieson (EVG) staining (left) and elastin degradation grade (right) in the aortic arch. n = 15 biological replicates for BAPN + scr-miR group. n = 20 biological replicates for BAPN + anti-miR-1204. Statistical analysis was performed using two-tailed Mann–Whitney U test. Scale bar, 100 μm. H Representative images of senescence-associated-β-galactosidase (SA-β-gal) staining (left) and quantification of the SA-β-gal activity area (right) in the aortic arch. n = 15 biological replicates for BAPN + scr-miR group. n = 20 biological replicates for BAPN + anti-miR-1204.Statistical analysis was performed using two-tailed Student’s t test. Left bar represents 4 mm. Right bar indicates 50 μm. Data were presented as mean ± SD. Source data are provided as a source data file.
Fig. 4
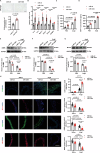
Fig. 4. miR-1204 promotes senescence-associated secretory phenotype (SASP) component accumulation and contractile phenotype loss in vascular smooth muscle cells (VSMCs).
A Representative images of senescence-associated-β-galactosidase (SA-β-gal) staining (upper panel) and quantification (lower panel) in VSMCs transfected with miR-1204 mimics or miR-control (miR-ctl). n = 6 biological replicates. Statistical analysis was performed using two-tailed Student’s t test. Scale bar, 100 μm. B Quantification of mRNA levels of SASP components in VSMCs transfected with miR-1204 mimics or miR-ctl. n = 6 biological replicates. Statistical analysis was performed using two-tailed Student’s t test. C Interleukin 6 (IL-6) concentration in the culture supernatant of VSMCs transfected with miR-1204 mimics or miR-ctl combined with angiotensin II (AngII) treatment. n = 6 biological replicates. Statistical analysis was performed using a one-way ANOVA followed by Tukey’s multiple comparison test. D Monocyte chemotactic protein 1 (MCP-1) concentration in the culture supernatant of VSMCs transfected with miR-1204 mimics or miR-ctl combined with AngII treatment. n = 6 biological replicates. Statistical analysis was performed using a one-way ANOVA followed by Tukey’s multiple comparison test. EG Representative plots (upper) and quantification (lower) of immunoblot analysis of contractile markers, α-smooth muscle actin (α-SMA), smooth muscle protein 22 (SM22), and myosin heavy chain 11 (MYH11) in VSMCs transfected with miR-1204 mimics or miR-ctl combined with AngII treatment. n = 6 biological replicates. Statistical analysis was performed using a one-way ANOVA followed by Tukey’s multiple comparison test. H Representative images (left) and quantification (right) of immunofluorescence staining of CD68, MYH11, α-SMA, and SM22 in mouse aortas in the indicated groups. n = 17 biological replicates for miR-1204 + AngII group. n = 19 biological replicates for other groups. Statistical analysis was performed using a one-way ANOVA followed by Tukey’s multiple comparison test for α-SMA and SM22 quantification, by two-tailed Welch’s ANOVA followed by Dunn’s multiple comparisons for CD68 and MYH11 quantification. Scale bar, 100 μm. Data are presented as mean ± SD. Source data are provided as a source data file.
Fig. 5
Fig. 5. Myosin light chain kinase (MYLK) is a direct target of miR-1204 in vascular smooth muscle cells (VSMCs).
A, B Volcano plot showing the mRNA expression of potential miR-1204 targets in VSMCs transfected with miR-1204 mimic or miR-control (miR-ctl) combined with angiotensin II (AngII) treatment (B) or not (A). n = 3 biological replicates. Statistical analysis was performed using a two-tailed Student’s t test. C Representative plots (upper) and quantification (lower) of MLYK immunoblot analysis in VSMCs transfected with miR-1204 mimic or miR-ctl combined with AngII treatment. n = 6 biological replicates. Statistical analysis was performed using a one-way ANOVA followed by Tukey’s multiple comparison test. D Representative images (upper panel) and quantification (lower panel) of MYLK immunofluorescence staining of mouse aortas from in the indicated groups. n = 17 biological replicates for the miR-1204 + AngII group. n = 19 biological replicates for other groups. Statistical analysis was performed using a one-way ANOVA followed by Tukey’s multiple comparison test. Scale bar represents 100 μm. E Potential hsa-miR-1204 binding site in MYLK (upper panel). Luciferase activity assay confirmed that MYLK is a direct target of miR-1204 (lower panel). n = 6 biological replicates. Statistical analyses were performed using two-tailed Student’s t tests. F Representative images (left) and quantification (right) of MYLK immunofluorescent staining in aortas of healthy participants and patients with AAD. n = 6 (young normal), n = 6 (elder normal), n = 7 (young patient), n = 8 (elder patient). Statistical analysis was performed using a one-way ANOVA followed by Tukey’s multiple comparison test. Scale bar represents 20 μm. Data are presented as mean ± SD. Source data are provided as a source data file.
Fig. 6
Fig. 6. Myosin light chain kinase (MYLK) ameliorates miR-1204-induced senescence-associated secretory phenotype (SASP) and contractile phenotype loss in vitro and in vivo.
A Representative images of senescence-associated-β-galactosidase (SA-β-gal) staining (left) and quantification (right) in the indicated groups. n = 6 biological replicates. Statistical analysis was performed using a one-way ANOVA followed by Tukey’s multiple comparison test. Scale bar represents 100 μm. B Interleukin 6 (IL-6) concentration in the culture supernatant of VSMCs in the indicated groups. n = 6 biological replicates. Statistical analysis was performed using a one-way ANOVA followed by Tukey’s multiple comparison test. C Monocyte chemotactic protein 1 (MCP-1) concentration in the culture supernatant of VSMCs in the indicated groups. n = 6 biological replicates. Statistical analysis was performed using a one-way ANOVA followed by Tukey’s multiple comparison test. D Quantification of the mRNA levels of SASP components in VSMCs transfected with miR-1204 mimics or miR-ctl in the indicated groups. n = 6 biological replicates. Statistical analysis was performed using a one-way ANOVA followed by Tukey’s multiple comparison test. EG Representative plots (upper panel) and quantification (lower panel) of immunoblot analysis of contractile markers, myosin heavy chain 11 (MYH11), α-smooth muscle actin (α-SMA), and smooth muscle protein 22 (SM22) in the indicated groups. n = 6 biological replicates. Statistical analysis was performed using a one-way ANOVA followed by Tukey’s multiple comparison test. H Scheme of AngII-induced aortic aneurysm and dissection (AAD) experiments. MiR-1204 agomir or miR-ctl (10 nmol) was administered by tail vein injection to 4-month-old male and female C57BL/6 mice every 3 d for a total of five times. Then the mice were administered MYLK adenovirus or blank adenovirus via tail vein prior to 4-weeks of AngII-infusion. I AAD incidence. AA aortic aneurysm, AD aortic dissection. Statistical analysis was performed using two-tailed Fisher’s exact test. J Representative photographs of aortas in the indicated groups. Bar indicates 4 mm. K Representative images of SA-β-gal staining in the indicated groups. Scale bar indicates 4 mm. L Representative B-mode ultrasound and doppler ultrasound (DUS) detection of abdominal aortas (upper) and quantification of abdominal aorta diameters (below). n = 17 biological replicates for AngII + miR-1204 group. n = 20 biological replicates for other groups. Statistical analysis was performed using a one-way ANOVA followed by Tukey’s multiple comparison test. The white arrow indicates an aneurysm. M Representative images of immunofluorescence staining of MYLK, MCP-1, and IL-6 in mouse aortas in the indicated groups. Scale bar represents 100 μm. N Contraction of isolated aortic rings from indicated groups in response to the phenylephrine (Phe) treatment. n = 8 biological replicates. Statistical analysis was performed using two-tailed repeated-measures ANOVA with Bonferroni’s multiple comparison test. Data are presented as mean ± SD. Source data are provided as a source data file.
Fig. 7
Fig. 7. P53 up-regulates miR-1204 through interaction with plasmacytoma variant translocation 1 (PVT1) response element in senescent vascular smooth muscle cells (VSMCs).
A Quantification of pri-mir-1204 levels in VSMCs treated with angiotensin II (AngII, 1 × 10−6 M), hydrogen peroxide (H2O2, 30 μM) or daunorubicin (0.22 μM). n = 6 biological replicates. Statistical analysis was performed using a one-way ANOVA followed by Tukey’s multiple comparison test. B Quantification of pri-mir-1204 levels in VSMCs treated with nutlin-3a with or without silencing TP53. n = 6 biological replicates. Statistical analysis was performed using a one-way ANOVA followed by Tukey’s multiple comparison test. C Chromatin immunoprecipitation analysis quantifying DNA fragments co-immunoprecipitated with p53 at the PVT1 response element (PVT1 RE). The P21 3′response element (P21 3′ RE) was used as a positive control. n = 6 biological replicates. Statistical analysis was performed using a one-way ANOVA followed by Tukey’s multiple comparison test. D Luciferase activity confirms the interaction between p53 and PVT1 RE. n = 6 biological replicates. Statistical analysis was performed using a one-way ANOVA followed by Tukey’s multiple comparison test. E Representative plots of immunoblot analysis of cellular senescence markers, p53, p21, p16, and p-γH2AX in control VSMCs, VSMCs transfected with miR-1204 mimics alone and VSMCs transfected with miR-1204 mimics plus MYLK adenovirus. F Quantification of cellular senescence markers in the indicated groups by immunoblot analysis. n = 6 biological replicates. Statistical analyses were performed using a one-way ANOVA followed by Tukey’s multiple comparison test expect for MYLK quantification. Statistical analysis was performed using two-tailed Welch’s ANOVA, followed by Dunn’s multiple comparisons for MYLK quantification. G VSMC division was monitored for 72 h in control VSMCs, VSMCs transfected with miR-1204 mimic alone, and VSMCs transfected with miR-1204 mimic and MYLK adenovirus. Scale bar represents 200 μm. H Quantification of VSMC division in the indicated groups. n = 3 biological replicates. Statistical analysis was performed using two-tailed repeated-measures ANOVA with Bonferroni’s multiple comparison test. I KEGG analysis of target genes binding to p53 in VSMCs overexpressing miR-1204. Statistical analyses were performed using hypergeometric tests. J Distribution of reads from ChIP-Seq of SASP genes in miR-1204 overexpressing or control VSMCs. K Phosphorylation of MDM2 in the VSMCs from indicated groups. The experiment was independently repeated three times with similar results. L Expression of MDM2 and p53 in proteins pulled-down by MDM2-Co-IP and input immunoprecipitation in VSMCs from indicated groups. The experiment was independently repeated three times with similar results. Data are presented as mean ± SD. ns not significant. Source data are provided as a source data file.
Fig. 8
Fig. 8. Hypothetical working model.
Cell senescence induces the expression of miR-1204 through interaction of p53 with the plasmacytoma variant translocation 1response element (PVT1 RE). MiR-1204 directly targets myosin light chain kinase (MYLK), leading to the acquisition of a senescence-associated secretory phenotype (SASP) by vascular smooth muscle cells (VSMCs) and loss of their contractile phenotype. MiR-1204 induces VSMC senescence by forming a positive feedback loop. This figure was created with Bio-Render.com.

References

    1. Isselbacher EM, et al. 2022 ACC/AHA Guideline for the Diagnosis and Management of Aortic Disease: A Report of the American Heart Association/American College of Cardiology Joint Committee on Clinical Practice Guidelines. Circulation. 2022;146:E334–E482. doi: 10.1161/CIR.0000000000001106. - DOI - PMC - PubMed
    1. Erbel R, et al. 2014 ESC Guidelines on the diagnosis and treatment of aortic diseases. Eur. Heart J. 2014;35:2873–U2893. doi: 10.1093/eurheartj/ehu281. - DOI - PubMed
    1. Bossone E, Eagle KA. Epidemiology and management of aortic disease: aortic aneurysms and acute aortic syndromes. Nat. Rev. Cardiol. 2021;18:331–348. doi: 10.1038/s41569-020-00472-6. - DOI - PubMed
    1. Howard DPJ, et al. Population-based study of incidence and outcome of acute aortic dissection and premorbid risk factor control 10-year results from the oxford vascular study. Circulation. 2013;127:2031–2037. doi: 10.1161/CIRCULATIONAHA.112.000483. - DOI - PMC - PubMed
    1. Trimarchi S, et al. Role of age in acute type A aortic dissection outcome: report from the International Registry of Acute Aortic Dissection (IRAD) J. Thorac. Cardiovasc. Surg. 2010;140:784–789. doi: 10.1016/j.jtcvs.2009.11.014. - DOI - PubMed

MeSH terms