. 2024 Jul 16;15(1):5944.
doi: 10.1038/s41467-024-49982-8.

Rational correction of pathogenic conformational defects in HTRA1

Affiliations

Rational correction of pathogenic conformational defects in HTRA1

Nathalie Beaufort et al. Nat Commun. .

Abstract

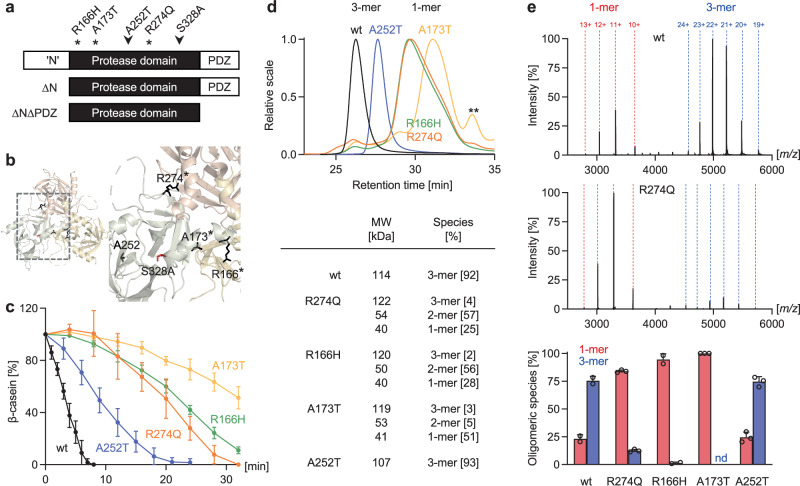
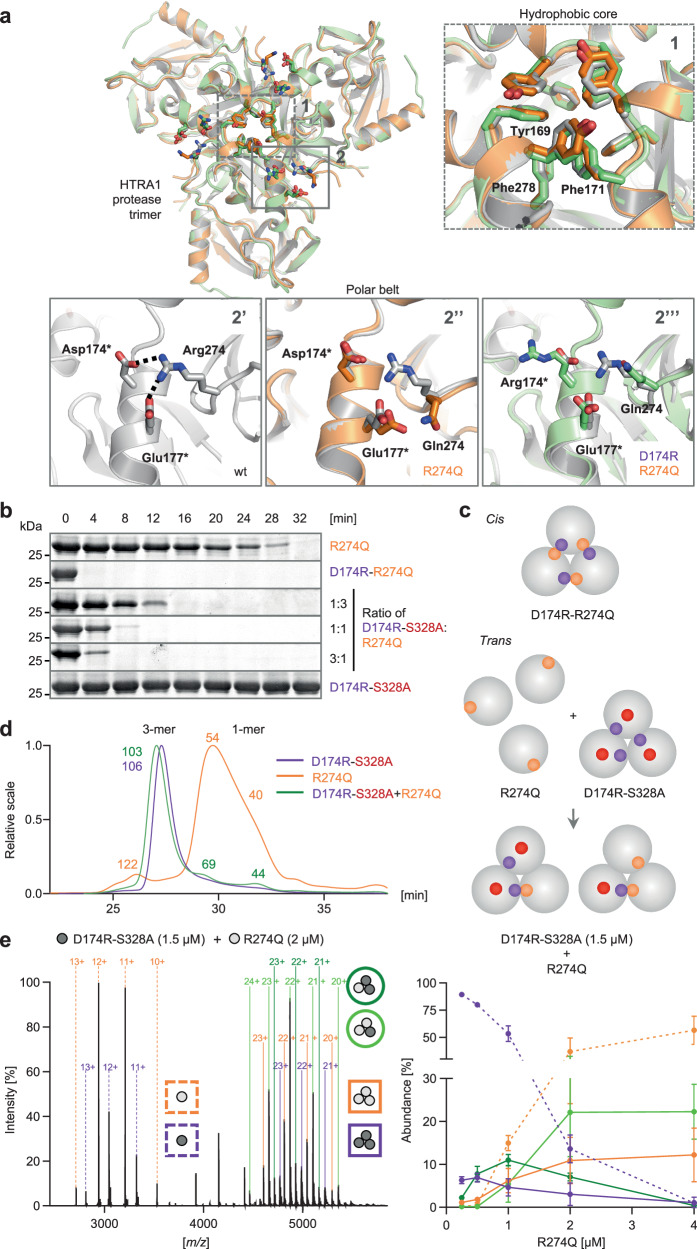
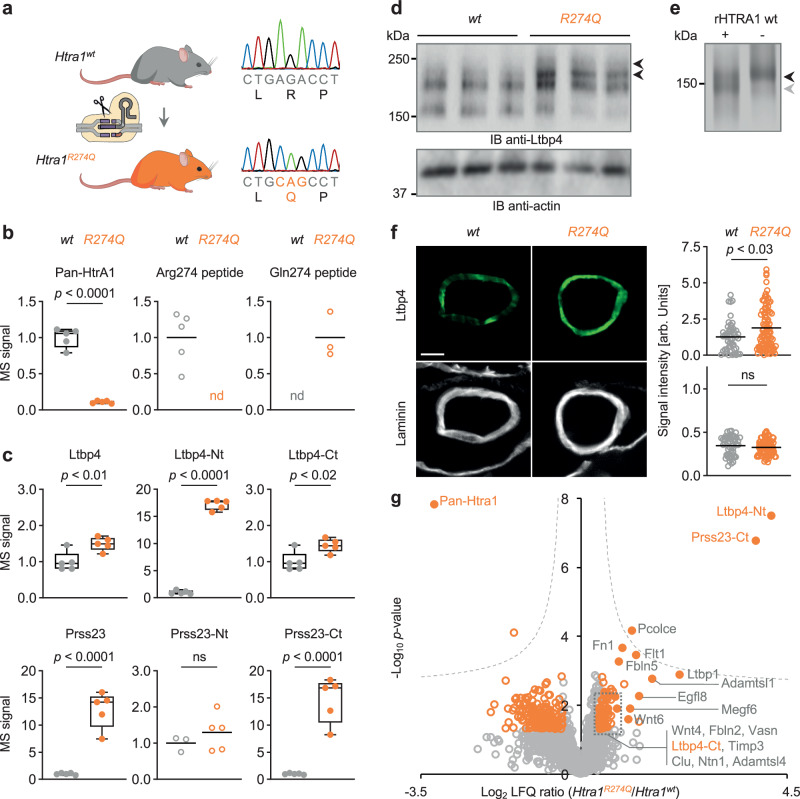
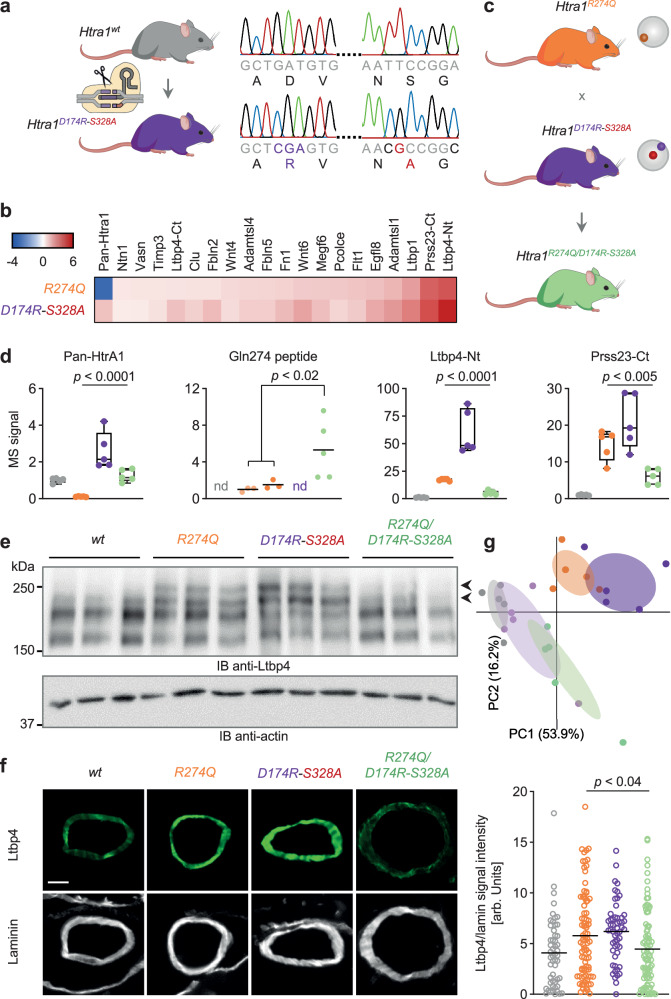
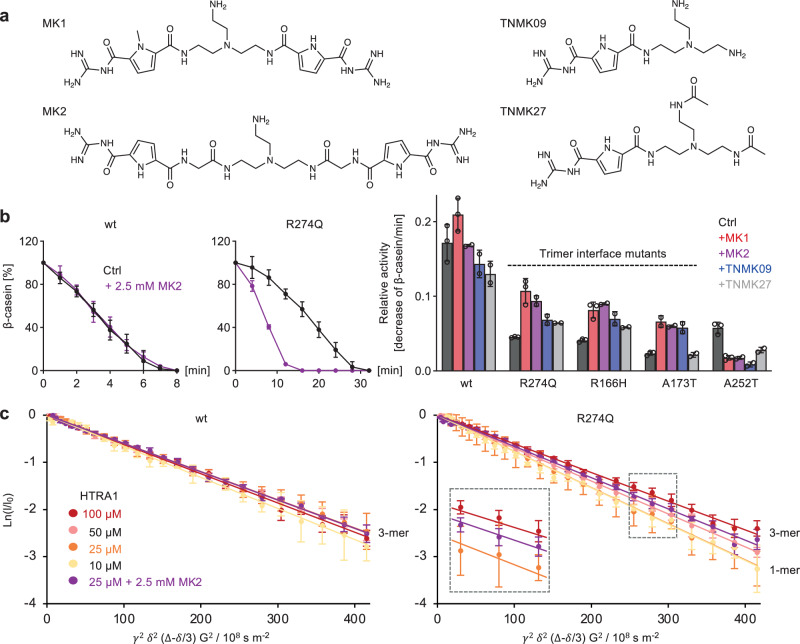
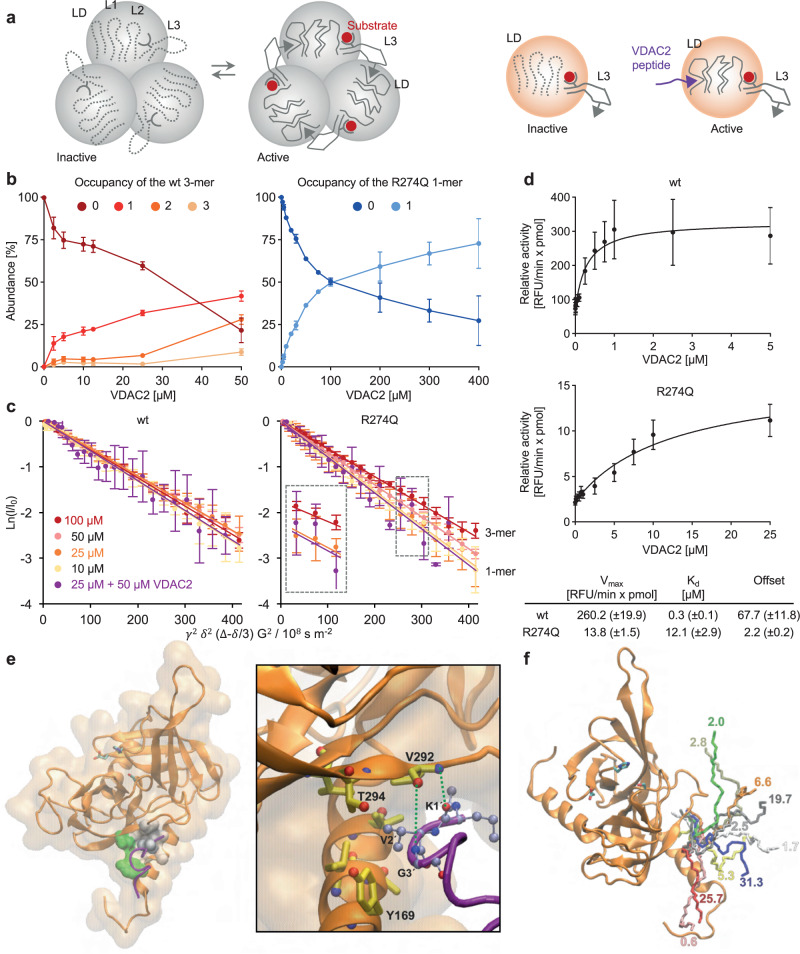
Loss-of-function mutations in the homotrimeric serine protease HTRA1 cause cerebral vasculopathy. Here, we establish independent approaches to achieve the functional correction of trimer assembly defects. Focusing on the prototypical R274Q mutation, we identify an HTRA1 variant that promotes trimer formation thus restoring enzymatic activity in vitro. Genetic experiments in Htra1R274Q mice further demonstrate that expression of this protein-based corrector in trans is sufficient to stabilize HtrA1-R274Q and restore the proteomic signature of the brain vasculature. An alternative approach employs supramolecular chemical ligands that shift the monomer-trimer equilibrium towards proteolytically active trimers. Moreover, we identify a peptidic ligand that activates HTRA1 monomers. Our findings open perspectives for tailored protein repair strategies.


Conflict of interest statement

The authors declare no competing interests. Carsten Schmuck is deceased.

Figures

Fig. 1
Fig. 1. HTRA1 interface mutants exhibit oligomeric assembly defects.
a Schematic representation of HTRA1 domain organization and position of selected pathogenic mutations and the active site mutation S328A. Mutations located at the protomer-protomer interface are marked by an asterisk. The N-terminal (‘N’) domain consists of a fragmented IGFBP7 domain where neither the incomplete IGFBP binds insulin nor the incomplete Kazal-like domain functions as a protease inhibitor. b Position of pathogenic mutations in the HTRA1 trimer (PDB ID 3TJO). c Proteolytic activity of wt and mutant HTRA1s (1 µM) using β-casein (20 µM) as a substrate. The graph depicts the relative β-casein signal intensity (average ± SD of 3 independent experimental data). d Oligomeric states of wt and mutant HTRA1s evaluated by SEC-MALS. Upper panel: representative UV chromatograms of wt and mutant HTRA1s depicted in overlay. Lower panel: calculated molecular weights and relative abundance of mono-, di- and trimeric HTRA1 species. **: degradation products or impurities. e Oligomeric states of wt and mutant HTRA1s evaluated by native MS. Upper panels: representative spectra of HTRA1 wt and R274Q (5 µM). Mono- and trimeric species and charge states are labeled. Lower panel: relative abundance of mono- and trimeric HTRA1 species (5 µM; nd: not detected; mean + SD of 2 [wt, R166H] or 3 [R274Q, A173T, A252T] independent datasets; empty circles: individual data points). Dimers (relative abundance <5%) are not depicted. Source data are provided as a Source Data file.
Fig. 2
Fig. 2. Restoration of HTRA1 assembly and activity via protein-based complementation.
a Structures of wt HTRA1 (gray; PDB ID 3TJO), R274Q (orange; PDB ID 6Z0E), and D174R-R274Q (green; PDB ID 6Z0X; 6Z0Y) in S328A background. Mutants are shown in an overlay with wt. Panel 1: similar to wt HTRA1, R274Q and D174R-R274Q were crystallized in their trimeric state, superimposing well as seen for the aligned aromatic residues of the central hydrophobic core. Panels 2’–2”’: salt bridges in the HTRA1 protomer interface. Asterisks denote residues on adjacent protomers. The side chains at positions 174, 177, and 274 were well defined by electron density allowing their direct comparison. b Proteolytic activity (β-casein degradation) of D174R-R274Q (1 µM), and of D174R-S328A (0.33–3 µM) and R274Q (1 µM) mixed at increasing molar ratios. The activity of R274Q (1 µM) and D174R-S328A (1 µM) serve as controls. Data are representative of 2 independent experiments. c Cartoons of cis- and trans-complementation. D174R-R274Q assembles as an active homotrimer (complementation in cis); R274Q (monomeric, inactive) and D174R-S328A (trimeric, inactive) assemble as proteolytically active heterotrimers (complementation in trans). d, e Oligomeric states of R274Q and D174R-S328A alone or in combination. d Representative SEC-MALS UV chromatograms of R274Q, D174R-S328A and D174R-S328A + R274Q (mixed at a 1:1 ratio) depicted in overlay. The calculated molecular weight of mono-, di- and trimeric HTRA1 species is indicated. e Left panel: representative native MS spectrum of D174R-S328A (1.5 µM) mixed with R274Q (2 µM). Mono- and trimeric species and charge states are labeled. Right panel: titration of D174R-S328A (1.5 µM) with R274Q. R274Q dimers (<9%) are not depicted. The mean abundance of oligomeric species is depicted and error bars indicate SD (n = 3 independent datasets). Source data are provided as a Source Data file.
Fig. 3
Fig. 3. Htra1R274Q mice show an altered cerebrovascular proteome.
a Generation of Htra1R274Q mice by CRISPR/Cas9-mediated genome editing. Created with BioRender.com released under a Creative Commons Attribution-NonCommercial-NoDerivs 4.0 International license https://creativecommons.org/licenses/by-nc-nd/4.0/deed.en. Isoform-specific detection of HtrA1 (b) and region-specific analysis of Ltbp4 and Prss23 (c) by mass spectrometry (MS). LFQ values as box-and-whisker plots (centerline: median; limits: 25th and 75th percentile; whiskers: minimum and maximum) with filled circles. MS peptide intensity as scatter plots with empty circles (black bars: mean; nd: not detected). Data points represent individual mice (n = 5 per genotype). The mean signal intensity in Htra1wt or Htra1R274Q samples was set to 1 as appropriate. Significance was tested by two-sided unpaired t test (Pan-HtrA1: p = 4.2E-07; Ltbp4: p = 9.6E-03; Ltbp4-Nt: p = 3.0E-10; Ltbp4-Ct: p = 1.5E-02; Prss23: p = 4.8E-05; Prss23-Nt: p = 3.8E-01; Prss23-Ct: p = 8.4E-05). d Detection of Ltbp4 by immunoblot (IB) in brain vessels from n = 3 mice per genotype. Actin serves as loading control. The multiple Ltbp4 bands most likely account for post-translational modifications and splice variants. Black arrowheads: Ltbp4 species enriched in Htra1R274Q compared to Htra1wt vessels. e Processing of LTBP4 by wt HTRA1 in vitro for comparison (purified proteins; SDS-PAGE and silver staining). Black and gray arrowheads: intact and cleaved LTBP4, respectively. Data are representative of 2 independent experiments. f Detection of Ltbp4 and laminin by immunohistochemistry (IHC) in brain arteries. Left panels: representative images (scale bar: 25 µm). Right panels: quantification of fluorescence signal intensity as scatter plots (black bars: mean). Data points represent individual vessels (wt: n = 52 arteries from 3 mice; R274Q: n = 87 arteries from 4 mice). Significance was tested by two-sided unpaired Mann-Whitney U-test (Ltbp4: p = 2.6E-02; laminin: p = 2.1E-01). g Volcano plot of all proteins quantified by MS. Orange circles: deregulated proteins; filled circles: proteins of interest (see text for explanations); hyperbolic curve: permutation-based FDR estimation. Proteins are labeled with gene names. Source data are provided as a Source Data file.
Fig. 4
Fig. 4. Protein-based functional correction of HtrA1 in vivo.
a Generation of Htra1D174R-S328A mice. b, MS analysis of brain vessels: log2 LFQ ratio-based heatmap of protein deregulation in Htra1R274Q and Htra1D174R-S328A vessels. Depicted are the proteins of interest. c Htra1R274Q mice were crossed with Htra1D174R-S328A mice to generate heterozygous Htra1R274Q/D174R-S328A animals. a, c Created with BioRender.com released under a Creative Commons Attribution-NonCommercial-NoDerivs 4.0 International license https://creativecommons.org/licenses/by-nc-nd/4.0/deed.en. d MS signal intensity of Pan-HtrA1, Gln274-containing peptide, Ltbp4-Nt and Prss23-Ct in brain vessels (n = 5 mice per genotype). Colors are as in (a) and (c); light orange: Htra1wt/R274Q. Pan-HtrA1, Ltbp4-Nt, Prss23-Ct: LFQ values as box-and-whisker plots (centerline: median; limits: 25th and 75th percentile; whiskers: minimum and maximum) with filled circles. The mean value in Htra1wt samples was set to 1. Gln274 peptide: MS peptide intensity as scatter plots with filled circles (black bars: mean; nd: not detected). The mean value in Htra1wt/R274Q vessels was set to 1. Since this peptide was not detected in 2 out of 5 samples in Htra1wt/R274Q and Htra1R274Q vessels, these groups were combined for statistical analysis. Significance was tested by two-sided unpaired t-test; no correction for multiple comparison was performed (Pan-HtrA1: p = 5.9E-05; Gln274 peptide: p = 1.2E-02; Ltbp4-Nt: p = 1.3E-06; Prss23-Ct: p = 3.4E-03). e Ltbp4 and actin detected by IB in brain vessels (n = 3 mice per genotype). f Ltbp4 and laminin detected by IHC in brain arteries. Scale bar in left panel: 25 µm. Right panel: Ltbp4/laminin signal intensity as scatter plots (black bars: mean). Data points represent individual vessels (wt: n = 52 arteries from 3 mice; R274Q: n = 87 arteries from 4 mice; D174R-S328A: n = 54 arteries from 4 mice, R274Q/D174R-S328A: 87 arteries from 4 mice). Significance was tested by two-sided unpaired Mann-Whitney U-test; no correction for multiple comparison was performed (p = 3.0E-02). g Following MS analysis, principal component (PC) analysis of protein abundance was applied to the proteins of interest, excluding HtrA1 which exhibited opposite behaviors in Htra1R274Q and Htra1D174R-S328A vessels (filled circles: individual mice, n = 5 per genotype). PC1 and PC2, explaining most of the variance, are depicted. Colors are as in (a), (c), (d); light purple: Htra1wt/D174R-S328A. Source data are provided as a Source Data file.
Fig. 5
Fig. 5. HTRA1 assembly and activity in the presence of supramolecular ligands.
a Structure of guanidiniocarbonyl pyrroles (GCPs). b β-casein degradation by wt and mutant HTRA1 (1 µM) in the absence (Ctrl) or presence of MK2 (2.5 mM). Left panels: activity of HTRA1 wt or R274Q. Graphs depict the relative loss of β-casein signal (mean ± SD of 2 [MK2] or 3 [Ctrl] independent experimental data). Right panel: relative activity of wt or mutant HTRA1. The rates of β-casein cleavage are presented as the maximum gradient of β-casein degradation after acceleration and before substrate exhaustion (mean ± SD of 2 [MK2, TNMK09, TNMK27] or 3 [Ctrl, MK1] independent experimental data; empty circles: individual data points). c Oligomeric states of wt and mutant HTRA1 in the absence or presence of MK2 analyzed via NMR DOSY experiments. Inlet: 25 µM R274Q (monomeric), 100 µM R274Q (trimeric) and 25 µM R274Q + MK2 2.5 mM (mean ± SD of 6 technical replicates). The slope in the Stejskal-Tanner plots represents the negative diffusion coefficient. Small molecules exhibit a larger diffusion coefficient and thus a steeper slope, while large molecules with a smaller diffusion coefficient show a shallower slope. Source data are provided as a Source Data file.
Fig. 6
Fig. 6. Allosteric activation of monomeric HTRA1 by peptidic modulators.
a Model of activation of trimeric and monomeric HTRA1. Left panel: in wt HTRA1, the substrate bound to the active site interacts with loop L3, followed by an inter-protomer loop L3-LD interaction. This interaction mediates the proper positioning of loops L1 and L2, and of the catalytic site. Right panel: in monomeric mutant HTRA1, loop L3-LD interaction is disrupted. VDAC2 acts as a surrogate of the missing loop L3 from an adjacent protomer leading to the proper positioning of loop LD and thus of loops L1 and L2. Therefore, in active monomeric HTRA1, the activation domain resembles that of classic monomeric serine proteases,. b Binding of VDAC2 to HTRA1 wt trimers or to R274Q monomers analyzed by native MS. Graphs depict the occupancy (average ± SD of 4 independent datasets). c Oligomeric states of HTRA1 wt and R274Q in the absence (Ctrl) or presence of VDAC2 analyzed by NMR DOSY (mean ± SD of 6 technical replicates). d Normalized cleavage rates of peptidic fluorescence-quenched substrate (2 µM) by HTRA1 wt (30 nM) and R274Q (300 nM) plotted vs. VDAC2 concentration (mean ± SD of 3 independent datasets with technical duplicates). Data were fitted to the hyperbolic weak-binding equation to obtain Vmax and Kd for peptide binding; brackets: SE of the fit. e Model of the binding mode of VDAC2 at the N-terminal tip of HTRA1-R274Q. Backbones of HTRA1 (orange) and VDAC2 (magenta), sidechains of the catalytic triad’s residues shown with sticks (licorice style). Green: hydrophilic residues; gray: hydrophobic residues. Surface representation is used for HTRA1 (transparent surface). Inset: close-up view of selected HTRA1’s residues nearby VDAC2. Sidechains of HTRA1’s residues depicted with sticks (licorice style) and colored in yellow except oxygen (red) and nitrogen (blue). Sidechains of VDAC2 residues are shown with balls and sticks (CPK style) and colored in light blue except oxygen (red) and nitrogen (blue). f Representative structures of the 10 largest clusters of the advanced sampling simulations (three replicas combined). Numbers: relative population of each cluster (percent of the simulation’s frames).

References

    1. Clausen T, Kaiser M, Huber R, Ehrmann M. HTRA proteases: regulated proteolysis in protein quality control. Nat. Rev. Mol. Cell Biol. 2011;12:152–162. doi: 10.1038/nrm3065. - DOI - PubMed
    1. Beaufort N, et al. Cerebral small vessel disease-related protease HtrA1 processes latent TGF-beta binding protein 1 and facilitates TGF-beta signaling. Proc. Natl Acad. Sci. USA. 2014;111:16496–16501. doi: 10.1073/pnas.1418087111. - DOI - PMC - PubMed
    1. Zellner A, et al. CADASIL brain vessels show a HTRA1 loss-of-function profile. Acta Neuropathol. 2018;136:111–125. doi: 10.1007/s00401-018-1853-8. - DOI - PubMed
    1. Yang Z, et al. A variant of the HTRA1 gene increases susceptibility to age-related macular degeneration. Science. 2006;314:992–993. doi: 10.1126/science.1133811. - DOI - PubMed
    1. Dewan A, et al. HTRA1 promoter polymorphism in wet age-related macular degeneration. Science. 2006;314:989–992. doi: 10.1126/science.1133807. - DOI - PubMed

Substances

LinkOut - more resources